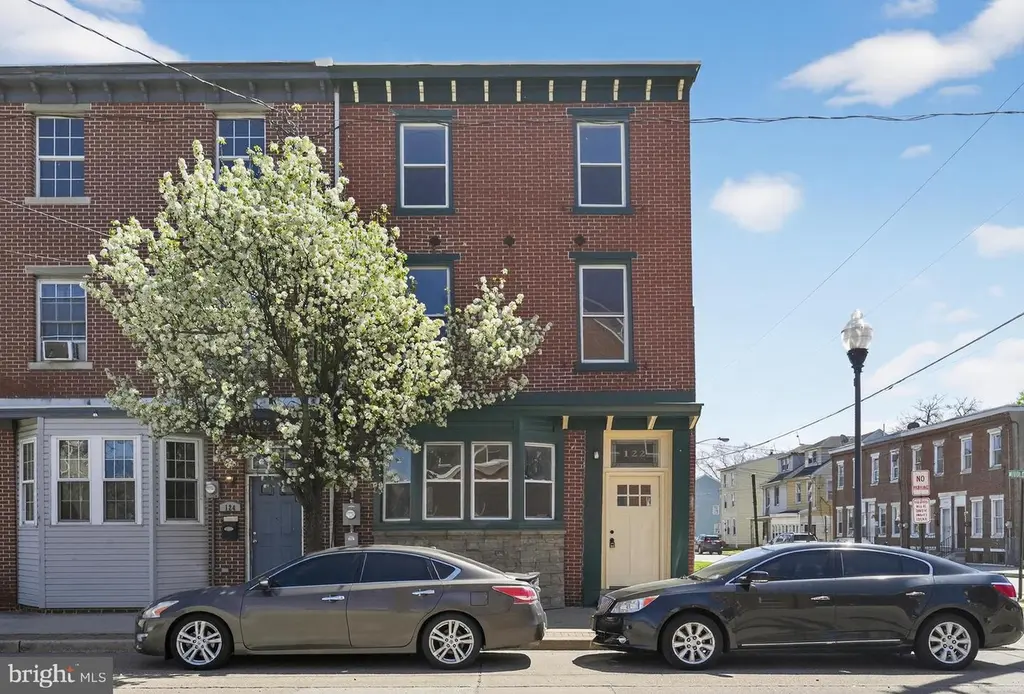
122 N King St · Gloucester City, NJ
Flood risk 2/10 · Minimal
- FEMA flood zone
- X (unshaded)
- Chance of flooding over 30 yrs
- 0.05%
- Est. flood insurance / yr
- $507 – $1,088
Fire risk 1/10 · Minimal
- Est. fire insurance / yr
- $526 – $976
Heat risk 7/10 · Major
- Hot days now (above 103°F)
- 7 days/yr
- Hot days in 30 yrs
- 15 days/yr
Wind risk 6/10 · Moderate
- Chance of severe wind over 30 yrs
- 38.0%
Air-quality risk 4/10 · Minor
- Unhealthy air days now
- 5 days/yr
- Unhealthy air days in 30 yrs
- 6 days/yr
Risk factors via First Street. Map © Google.
Why this score? — see what drove the C- grade
The composite is a weighted blend of 9 inputs, each scored 0–100. Each bar is that input's sub-score; the figure is the points it added to the 100-point composite (weight × sub-score).
- Cash flow +17.6/30.0
- ARV discount +12.3/15.0
- DSCR +5.5/10.0
- 1% rule +4.8/10.0
- Livability +3.6/5.0
- Rent growth +2.5/5.0
- Condition / age +2.5/5.0
- Schools +2.0/10.0
- Appreciation +0.0/10.0
$289,900
🖨 Deal sheet (PDF) 📄 Offer letter ✓ Due diligence
Listing remarks
Welcome to this completely renovated 3-story twin home, perfectly situated on the up and coming King Street! From top to bottom, everything has been thoughtfully redone; offering the perfect blend of modern updates and spacious living. Step inside to a bright and spacious layout, featuring a large living and dining combination, plus a formal dining room as well-- ideal for entertaining or hosting family gatherings. The home offers great space across all 3 levels. There is a powder room on the main level. On the second floor, you will find 2 generously sized bedrooms with a large bathroom, and laundry area. The third floor offers two additional bedrooms, perfect for a growing family, guest r
Key facts
- Formal dining room
- Bright layout
- End rowhome
Tags
Neighborhood map
What this means for you Summary
Snapshot
- This is a 4-bed/1.5-bath single-family listed at $290k.
Deal economics
- At list price, monthly cash flow is $227 ($3k/yr) — positive.
- The deal already cash-flows at list — no discount required.
- To meet the 1% rule (rent ≥ 1% of price), the offer needs to be $285k (1.7% below list).
- Recommended offer: $285k (1.7% below list) — sets the bar for 1% rule.
- Cap rate 7.2% vs local median 5.7% in Gloucester City — meaningfully above typical; check what's discounted (condition, days-on-market, listing class) to confirm the premium yield is real.
Location & tenants
- Location reads 72/100 on livability (#215 in NJ) — a middle-class / working-renter tenant base. Strengths: housing A+, health & safety B+; Watch: amenities F, commute F.
- Gloucester City Public School District (suburban): math 11% / reading 34% proficiency, ranked #413 of 472 in NJ (top 88%) — low school quality limits family demand, transient renter base, plan for 1-2y turnover.
- Zoned schools: Cold Springs School (math 8% / reading 17%, grade F, #1,172 of 1,303 statewide, top 91%, 842 students, 68% FRL); Gloucester City Middle School (math 8% / reading 36%, grade F, #383 of 431 statewide, top 90%, 779 students, 65% FRL); Gloucester City High School (math 21% / reading 42%, grade F, #275 of 399 statewide, top 69%, 702 students, 59% FRL).
- Market conditions: 92 active listings in the ZIP; 1 comparable units currently listed for rent nearby; 1,018 units permitted in Camden County in 2024 (509 in 5+ unit buildings).
- At $2,848/mo this rent would consume 54% of the median local household income ($63k/yr) (locally 431% of renters already pay >50% of income on rent) — very limited rent-growth headroom before tenants either downsize or default.
Forward outlook
- Local home prices are declining (-3.0%/yr); year-one equity from $2k of loan paydown is wiped out by about $9k of value loss. Plan a longer hold.
- Camden County population projected to shrink 8% by 2050 — rents likely to lag national; underwrite the cash flow, not the appreciation.
Negotiation context
- Only 5 days on market — expect competitive offers; lowballing is unlikely to land.
- Current owner paid $125k; list at $290k implies a 132% gain — meaningful room to come down on a strong offer.
Risks & watch-outs
- Watch-outs: built in 1900 — expect roof / HVAC / electrical / plumbing capex.
- Climate carrying-cost: major wind risk, 38% chance of damaging wind over 30y; extreme-heat days projected 7→15/yr by 2055 (HVAC capex compounding) — expect insurance premiums to compound above CPI over the hold.
Questions for the listing agent
- Built in 1900 — when were the roof, HVAC, electrical panel, plumbing, and water heater last replaced?
- Is there a deadline driving the sale (1031 exchange, divorce, estate, relocation)? That informs how much negotiation room exists.
- What's the average days-on-market for RENTAL listings here right now (not sales)? A rising rental-DOM trend means longer vacancies and softer asking-rent achievability than the comps imply.
- What's the recent tenant-quality profile in this submarket — average credit score on applications, eviction rate, late-payment / NSF rate, and stable-employment percentage? A property-management company in the area should have these aggregated.
- How much new for-sale + rental construction is in the pipeline within 1–3 miles? Heavy new supply typically softens prices + rents 12–24 months out; constrained supply supports both.
Investment metrics
- 1% rule
- 0.98% ✗
- Cap rate
- 7.23%
- Cash-on-cash
- 3.35%
- DSCR
- 1.15
- GRM
- 8.5
CMA / ARV
- ARV (on-the-fly)
- $324,375
- Comps found
- 6
Show comp detail 6 sales within ~0.75 mi
| Address | Dist | Beds/Ba | Sqft | Sold | Price | $/sf | Match |
|---|---|---|---|---|---|---|---|
| 412 Market St | 0.38mi | 5/2.0 (+1) | 2,736 (+5%) | 7mo | $162,000 | $59 | 61 |
| 222 Monmouth St | 0.16mi | 5/1.5 (+1) | 2,844 (+10%) | 18mo | $330,000 | $116 | 56 |
| 942 Paul St | 0.51mi | 5/2.5 (+1) | 2,692 (+4%) | 9mo | $398,000 | $148 | 53 |
| 705 Hunter St | 0.58mi | 4/2.5 | 2,864 (+10%) | 19mo | $310,000 | $108 | 36 |
| 424 Ridgeway St | 0.37mi | 5/3.0 (+1) | 2,287 (-12%) | 20mo | $285,000 | $125 | 36 |
| 830 Powell St | 0.72mi | 3/2.5 (-1) | 2,244 (-14%) | 8mo | $342,000 | $152 | 29 |
Match score weights: distance 35% · size 25% · config 20% · recency 20%. Top-matched comps best support the ARV.
Projected returns pro-forma
-3.0% appreciation · 3.0% rent growth · sell at horizon
- IRR
- -11.0%
- Equity multiple
- 0.60×
- Total profit
- $-32,474
- Equity at exit
- $43,225
- IRR
- -1.7%
- Equity multiple
- 0.88×
- Total profit
- $-9,451
- Equity at exit
- $25,065
Cash invested: $81,172 (down + closing). Projections, not guarantees.
Landlord ↔ Tenant lean methodology
- Overall (STATE)
- 21 Tenant-Leaning
- State New Jersey
- 21 Tenant-Leaning · D+6
- County
- — inherits STATE
- City
- — inherits STATE
ZIP-level market 08030
- Home prices YoY
- -27.9%
- Active inventory
- 92
- Price-to-rent
- 8.5×
Monthly cashflow live
- Estimated rent
- $2,848 medium interval (Pro) →
- Mortgage (P&I)
- −$1,520
- Tax from tax record
- −$382 /mo · $4,589/yr
- Insurance
- −$121
- HOA
- −$0
- Vacancy / Maint / Mgmt
- −$598
- Net cashflow
- $227
Break-even live
Sensitivity live
| Price | -10% $391 | -5% $309 | +0% $227 | +5% $145 | +10% $63 |
|---|---|---|---|---|---|
| Rent | -10% $2 | -5% $114 | +0% $227 | +5% $339 | +10% $452 |
| Rate | -1.0pp $373 | -0.5pp $301 | base $227 | +0.5pp $152 | +1.0pp $75 |
UW: 25.0% down · 7.5% · 30yr · 1.5% tax · 5.0% vac · 8.0% maint · 8.0% mgmt
Financing live
Cash to close
- Down payment
- $72,475
- Closing costs
- $8,697
- Reserves months
- —
- Total cash needed
- —
Loan-product check · same deal, 3 products live
Conventional
25% down · 7.5% · 30yr
- Down + closing
- —
- Monthly P&I
- —
- Monthly cashflow
- —
- DSCR
- —
- Eligible?
- —
Personal DTI + credit; lowest rate.
DSCR
20% down · 8.5% · 30yr
- Down + closing
- —
- Monthly P&I
- —
- Monthly cashflow
- —
- DSCR
- —
- Eligible?
- —
No personal income docs; deal must DSCR.
Hard money
10% down · 12.0% · 12mo
- Down + closing
- —
- Monthly P&I
- —
- Monthly cashflow
- —
- DSCR
- —
- Eligible?
- —
Short-term bridge; refi at stabilization.
Rent comps 1 comps
| Address | Beds | Baths | Sqft | Rent | $/sqft | DOM | Units | Dist |
|---|---|---|---|---|---|---|---|---|
| 322 Nicholson Rd Gloucester City, NJ | 4.0 | 2.0 | 1968 | $3,700 | $1.88 | 0d | 1 | 0.95mi |
Listing history 4 events
-
2026-04-13status Pending
-
2026-04-08$289,900 Active
-
2024-07-11soldstatus $125,000
-
2001-05-30soldstatus $57,900
ⓘ Source: listings_history table (triggers on properties + properties_extension) + one-shot
backfill from property_details.listing_events for pre-trigger history.
Tax reassessment forecast NJ · Partial reset (capped growth)
- Current annual tax
- $4,589 · $382/mo
- Projected year-2 tax
- $5,904 · $492/mo
- Expected delta
- +$1,315/yr (+$110/mo · 28.6%)
ⓘ Screening estimate from a state-policy table — verify with the county assessor before closing.
Climate risk First Street
- Flood 2/10 Low FEMA zone X (unshaded) · 5% chance over 30 yrs
- Wildfire 1/10 Low
- Heat 7/10 Severe 7 d/yr ≥103°F today · 15 d/yr by 30 yrs out
- Wind 6/10 Major 38% chance of damaging wind over 30 yrs
- Air quality 4/10 Moderate 5 unhealthy d/yr today · 6 by 30 yrs out
Nearby sold comps map
Loading sold comps map…
Walkable amenities ~0.75 mi
Loading nearby amenities…
Taxation est. · year 1
- Rental income
- $34,182
- − Mortgage interest
- −$16,239
- − Property taxes
- −$4,589
- − Insurance
- −$1,450
- − Repairs & maintenance
- −$2,735
- − Management
- −$2,735
- − Depreciation
- −$8,433
- Taxable loss
- −$1,998
- Est. tax savings @ 24.0%
- +$480
- After-tax cash flow
- $3,201/yr
For passive investors: Depreciation is non-cash, so a rental often shows a tax loss while cash-flowing — sheltering income. Rental losses are passive: they offset passive income freely, and up to $25,000/yr can offset ordinary (W-2) income if you actively participate and your MAGI is under $100k (phasing out to $0 by $150k); unused losses carry forward. On sale, claimed depreciation is recaptured at up to 25%, and gains may owe capital-gains tax (a 1031 exchange can defer both). Figures are a year-1 estimate at your 24.0% rate — not tax advice; consult a CPA.
Schools (NCES district)
- District
- Gloucester City Public School District
- NCES district ID
- 3406000
- Math proficiency
- 11% ▼ -21.00%
- Reading proficiency
- 34% ▼ -15.00%
- Median HH income
- $51,231
- Composite
- 20.01/100
- National rank
- #8664
- State rank
- #413 of 472 in NJ
Livability — Gloucester City
- Score
- 72/100
- State rank
- #215
- US rank
- #5984
Category grades
Schools grade is shown separately in the Schools card above.
Census & demographics
- Census place
- Gloucester City, NJ
- County
- Camden County · 407,624 people
- City population
- 13,217
- Metro
- Philadelphia-Camden-Wilmington, PA-NJ-DE-MD
- Population (ZIP)
- 13,217
- Household income
- $63,384
- Rent vs Own
- Severe rent burden
- 431.0
Population outlook (Camden County) Hauer SSP2
- Today (2025)
- 507,964 people
- By 2030
- 502,182 · -1.1%
- By 2040
- 485,602 · -4.4%
- By 2050
- 465,630 · -8.3%
- By 2075
- 419,986 · -17.3%
- By 2100
- 369,492 · -27.3%
Race, ethnicity, and origin ACS 2023
- Neighborhood character
- Predominantly White (68%)
- Race & ethnicity
- White 68% Hispanic / Latino 18% Black 7% Asian 5% Two or more races 5%
- Hispanic origin (detail)
- Mexican 4% Puerto Rican 10%
- Common ancestry
- Romanian 4% Lithuanian 3% Hispanic 2%
- Foreign-born
- 8% · Canada, Jamaica, China
- Languages at home
- 81% English-only · Spanish 13% Other Indo-European 4% Arabic 1%
Political lean MEDSL · Camden
- 2024 margin
- Strong D (+27.4) · D 63.0% · R 35.5% · Other 1.5%
- 2008→2024 swing
- -8.8pp toward R · 2008: 36.2pp · 2024: 27.4pp
- All cycles
- 2024: D+27.4 2020: D+33.5 2016: D+32.4 2012: D+36.6 2008: D+36.2
Not yet ingested
- Civics
- —
Market trends
- HPI YoY
- ▼ -115.59%
- Current HPI
- 298.9139
- Rent YoY
- —
- Metro
- Philadelphia-Camden-Wilmington, PA-NJ-DE-MD
- State GDP YoY
- ▲ 2.05%
- F500 in state
- 34
Industry mix (Fortune 500 HQ in NJ)
| Industry | F500 HQs | Revenue |
|---|---|---|
| Consumer Goods | 3 | $31B |
|
||
| Pharmaceuticals | 2 | $153B |
|
||
| Technology | 2 | $21B |
|
||
| Insurance | 2 | $20B |
|
||
| Healthcare | 2 | $19B |
|
||
| Financial Services | 1 | $70B |
|
||
Price history
+400.7% since first listed4 events — show timeline
- 2026-04-13 Pending — BRIGHT MLS
- 2026-04-08 Listed $289,900 BRIGHT MLS
- 2024-07-11 Sold (Public Records) $125,000 Public Records
- 2001-05-30 Sold (Public Records) $57,900 Public Records
Property tax history
+3.9%/yrLatest (2025): $4,589 · +5.6% YoY. Source: county tax records.
Cash-flow waterfall
monthlySold comps — $/sqft
last 12 mo · ≤1 miLoading sold comps…