2183 Railroad St · Monticello, IL
Flood risk 1/10 · Minimal
- FEMA flood zone
- X (unshaded)
- Chance of flooding over 30 yrs
- 0.0%
- Est. flood insurance / yr
- $507 – $1,088
Fire risk 1/10 · Minimal
- Est. fire insurance / yr
- $804 – $1,492
Heat risk 3/10 · Minor
- Hot days now (above 104°F)
- 7 days/yr
- Hot days in 30 yrs
- 19 days/yr
Wind risk 2/10 · Minimal
- Chance of severe wind over 30 yrs
- 2.0%
Air-quality risk 2/10 · Minimal
- Unhealthy air days now
- 1 days/yr
- Unhealthy air days in 30 yrs
- 1 days/yr
Risk factors via First Street. Map © Google.
Why this score? — see what drove the D+ grade
The composite is a weighted blend of 9 inputs, each scored 0–100. Each bar is that input's sub-score; the figure is the points it added to the 100-point composite (weight × sub-score).
- ARV discount +15.0/15.0
- Cash flow +13.2/30.0
- Livability +4.1/5.0
- DSCR +4.0/10.0
- 1% rule +3.7/10.0
- Schools +3.7/10.0
- Rent growth +2.5/5.0
- Condition / age +2.5/5.0
- Appreciation +0.0/10.0
$189,900
🖨 Deal sheet 📄 Offer letter ✓ Due diligence
Listing remarks
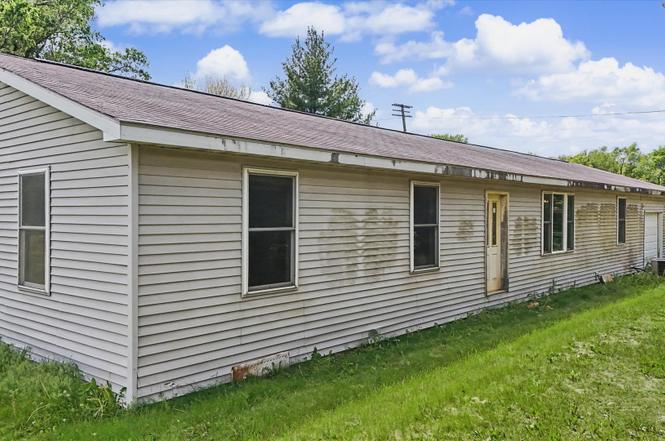
Opportunity awaits with this spacious home with close to 2,000 square feet situated on 5.93 acres in the sought-after Monticello school district! Featuring 3 bedrooms, 2.5 baths, and a two-car attached garage, this property offers plenty of room both inside and out. Conveniently located just off Route 10, you'll enjoy easy access while still having the space and privacy of country living. With solid potential and room to make it your own, this property is a great opportunity for buyers looking to add their personal touch. Home is being sold as-is and needs TLC, but the possibilities are endless!
Key facts
- 5.93 acre lot
- 2 garage spots
- Built 2004
Property features AI
Finance
- HOA & community: No master association fee required
Exterior
- Parking: Attached garage (2 garage spaces, 2 total parking spaces)
- Utilities: Well water; Septic tank
- Home design: Detached single-family home; Single-story; Fee simple ownership
- Construction: Vinyl siding; Property built approximately 21–25 years ago
- Exterior features: Irregular lot with mature trees and pasture
Interior
- Kitchen: Eating area / breakfast bar; Range; Dishwasher; Refrigerator
- Bedrooms: Master bedroom on main level (14 x 14) with full bath; Bedroom on main level (10 x 15); Bedroom on main level (12 x 11)
- Bathrooms: Two full bathrooms; One half bathroom
- Heating & cooling: Natural gas forced-air heating; Central air conditioning
- Interior features: Six total rooms; Kitchen/Dining combo
- Laundry & utility: Main-level laundry (8 x 14); Washer; Dryer
Neighborhood map
What this means for you Summary
Snapshot
- This is a 3-bed/2.5-bath single-family listed at $190k.
Deal economics
- At list price, monthly cash flow is $-4 ($-47/yr) — negative.
- To cash-flow at today's rent, offer at most $189k (0.4% below list).
- To meet the 1% rule (rent ≥ 1% of price), the offer needs to be $165k (13.3% below list).
- Recommended offer: $165k (13.3% below list) — sets the bar for 1% rule.
- Cap rate 6.3% vs local median 3.5% in Monticello — top-decile yield for the area; either an underpriced asset or a hidden risk that comps aren't pricing in. Stress-test before assuming the spread holds.
Location & tenants
- Location reads 82/100 on livability (#69 in IL, #1,132 nationally) — a professional / high-income tenant draw. Strengths: crime A+, employment A+, cost of living A+; Watch: amenities F, commute F.
- Monticello CUSD 25 (town): math 30% / reading 51% proficiency, ranked #123 of 620 in IL (top 20%) — families likely to look elsewhere, expect single-tenant / working-renter base with shorter leases; only 15% free/reduced lunch — higher-income household profile.
- Zoned schools: Monticello Middle School (math 25% / reading 56%, grade F, #136 of 665 statewide, top 21%, 379 students, 0% FRL); Monticello High School (math 32% / reading 42%, grade F, #107 of 693 statewide, top 17%, 476 students, 0% FRL) — zoned schools average 0% FRL vs 15% district-wide (15 pts lower); this property's tenant base skews higher-income than the district average.
- Market conditions: 47 active listings in the ZIP; 34 units permitted in Piatt County in 2024 (0 in 5+ unit buildings).
Forward outlook
- Local home prices are declining (-3.0%/yr); year-one equity from $1k of loan paydown is wiped out by about $6k of value loss. Plan a longer hold.
- Piatt County population projected at -19% by 2050 — secular population decline; favor cash flow + early exit over multi-decade hold.
Negotiation context
- It's been on market 44 days — a 3% lower offer ($184k) is reasonable based on typical stale-listing flexibility.
Questions for the listing agent
- What do current leases actually rent for vs. the listed asking? Can we see a recent rent roll and the last 12 months of T-12 income?
- It's been on market 44 days. Have you received any prior offers? Is the seller open to a 13% concession, seller financing, or rate buy-down credit?
- Is there a deadline driving the sale (1031 exchange, divorce, estate, relocation)? That informs how much negotiation room exists.
- Schools are B-rated — typically a magnet for longer-tenancy family renters. What's the average tenant stay here, and is there a school-zone premium baked into asking?
- The area grade is low — what's the realistic commute time and amenity access for the typical tenant pool here? Any planned neighborhood developments (good or bad) we should know about?
- What's the average days-on-market for RENTAL listings here right now (not sales)? A rising rental-DOM trend means longer vacancies and softer asking-rent achievability than the comps imply.
- What's the recent tenant-quality profile in this submarket — average credit score on applications, eviction rate, late-payment / NSF rate, and stable-employment percentage? A property-management company in the area should have these aggregated.
- How much new for-sale + rental construction is in the pipeline within 1–3 miles? Heavy new supply typically softens prices + rents 12–24 months out; constrained supply supports both.
Investment metrics
- 1% rule
- 0.87% ✗
- Cap rate
- 6.27%
- Cash-on-cash
- -0.09%
- DSCR
- 1.00
- GRM
- 9.6
CMA / ARV
- ARV (median comp)
- $378,754
- List price
- $189,900
- Delta
- -49.86%
- Verdict
- UNDERPRICED
- Comps
- 10 within 2.0 mi
Show comp detail 1 sale within ~0.75 mi
| Address | Dist | Beds/Ba | Sqft | Sold | Price | $/sf | Match |
|---|---|---|---|---|---|---|---|
| 1069 E IL Route 10 | 0.64mi | 3/3.0 | 2,148 (+10%) | 20mo | $549,900 | $256 | 34 |
Match score weights: distance 35% · size 25% · config 20% · recency 20%. Top-matched comps best support the ARV.
Projected returns pro-forma
-3.0% appreciation · 3.0% rent growth · sell at horizon
- IRR
- -16.4%
- Equity multiple
- 0.42×
- Total profit
- $-31,001
- Equity at exit
- $28,315
- IRR
- -8.2%
- Equity multiple
- 0.49×
- Total profit
- $-27,234
- Equity at exit
- $16,419
Cash invested: $53,172 (down + closing). Projections, not guarantees.
Landlord ↔ Tenant lean methodology
- Overall (STATE)
- 43 Moderately Tenant-Leaning
- State Illinois
- 43 Moderately Tenant-Leaning · D+7
- County
- — inherits STATE
- City
- — inherits STATE
ZIP-level market 61856
- Active inventory
- 47
- Price-to-rent
- 9.6×
Monthly cashflow live
- Estimated rent
- $1,646 medium interval (Pro) →
- Mortgage (P&I)
- −$996
- Tax from tax record
- −$230 /mo · $2,755/yr
- Insurance
- −$79
- HOA
- −$0
- Vacancy / Maint / Mgmt
- −$346
- Net cashflow
- $-4
Break-even live
UW: 25.0% down · 7.5% · 30yr · 1.5% tax · 5.0% vac · 8.0% maint · 8.0% mgmt
Financing live
Cash to close
- Down payment
- $47,475
- Closing costs
- $5,697
- Reserves months
- —
- Total cash needed
- —
Loan-product check · same deal, 3 products live
Conventional
25% down · 7.5% · 30yr
- Down + closing
- —
- Monthly P&I
- —
- Monthly cashflow
- —
- DSCR
- —
- Eligible?
- —
Personal DTI + credit; lowest rate.
DSCR
20% down · 8.5% · 30yr
- Down + closing
- —
- Monthly P&I
- —
- Monthly cashflow
- —
- DSCR
- —
- Eligible?
- —
No personal income docs; deal must DSCR.
Hard money
10% down · 12.0% · 12mo
- Down + closing
- —
- Monthly P&I
- —
- Monthly cashflow
- —
- DSCR
- —
- Eligible?
- —
Short-term bridge; refi at stabilization.
Listing history 18 events
-
2026-06-18status $189,900 Pending 44 DOM
-
2026-06-18days on market $189,900 Contingent - No Showings 44 DOM
-
2026-06-17days on market $189,900 Contingent - No Showings 43 DOM
-
2026-06-16days on market $189,900 Contingent - No Showings 42 DOM
-
2026-06-15days on market $189,900 Contingent - No Showings 41 DOM
-
2026-06-14days on market $189,900 Contingent - No Showings 39 DOM
-
2026-06-13days on market $189,900 Contingent - No Showings 38 DOM
-
2026-06-10days on market $189,900 Contingent - No Showings 36 DOM
-
2026-06-09days on market $189,900 Contingent - No Showings 35 DOM
-
2026-06-08days on market $189,900 Contingent - No Showings 34 DOM
-
2026-06-07days on market $189,900 Contingent - No Showings 33 DOM
-
2026-06-05days on market $189,900 Contingent - No Showings 30 DOM
-
2026-06-02days on market $189,900 Contingent - No Showings 28 DOM
-
2026-06-01days on market $189,900 Contingent - No Showings 27 DOM
-
2026-05-31days on market $189,900 Contingent - No Showings 26 DOM
-
2026-05-30days on market $189,900 Contingent - No Showings 25 DOM
-
2026-05-09historical Contingent - No Showings 602-char remark
-
2026-05-05$189,900 Active 602-char remark
ⓘ Source: listings_history table (triggers on properties + properties_extension) + one-shot
backfill from property_details.listing_events for pre-trigger history.
Tax reassessment forecast IL · Partial reset (capped growth)
- Current annual tax
- $2,755 · $230/mo
- Projected year-2 tax
- $3,533 · $294/mo
- Expected delta
- +$778/yr (+$65/mo · 28.2%)
ⓘ Screening estimate from a state-policy table — verify with the county assessor before closing.
Climate risk First Street
- Flood 1/10 Low FEMA zone X (unshaded) · 0% chance over 30 yrs
- Wildfire 1/10 Low
- Heat 3/10 Moderate 7 d/yr ≥104°F today · 19 d/yr by 30 yrs out
- Wind 2/10 Low 2% chance of damaging wind over 30 yrs
- Air quality 2/10 Low 1 unhealthy d/yr today · 1 by 30 yrs out
Nearby sold comps map
Loading sold comps map…
Walkable amenities ~0.75 mi
Loading nearby amenities…
Taxation est. · year 1
- Rental income
- $19,757
- − Mortgage interest
- −$10,637
- − Property taxes
- −$2,755
- − Insurance
- −$950
- − Repairs & maintenance
- −$1,581
- − Management
- −$1,581
- − Depreciation
- −$5,524
- Taxable loss
- −$3,270
- Est. tax savings @ 24.0%
- +$785
- After-tax cash flow
- $738/yr
For passive investors: Depreciation is non-cash, so a rental often shows a tax loss while cash-flowing — sheltering income. Rental losses are passive: they offset passive income freely, and up to $25,000/yr can offset ordinary (W-2) income if you actively participate and your MAGI is under $100k (phasing out to $0 by $150k); unused losses carry forward. On sale, claimed depreciation is recaptured at up to 25%, and gains may owe capital-gains tax (a 1031 exchange can defer both). Figures are a year-1 estimate at your 24.0% rate — not tax advice; consult a CPA.
Schools (NCES district)
- District
- Monticello CUSD 25
- NCES district ID
- 1726550
- Math proficiency
- 30% ▼ -10.00%
- Reading proficiency
- 51% ▼ -5.00%
- Median HH income
- $69,919
- Composite
- 36.73/100
- National rank
- #4590
- State rank
- #123 of 620 in IL
Livability — Monticello
- Score
- 82/100
- State rank
- #69
- US rank
- #1132
Category grades
Schools grade is shown separately in the Schools card above.
Census & demographics
- City population
- 8,110
- Population (ZIP)
- 8,110
Population outlook (Piatt County) Hauer SSP2
- Today (2025)
- 15,501 people
- By 2030
- 14,978 · -3.4%
- By 2040
- 13,805 · -10.9%
- By 2050
- 12,563 · -19.0%
- By 2075
- 9,916 · -36.0%
- By 2100
- 7,295 · -52.9%
Race, ethnicity, and origin ACS 2023
- Neighborhood character
- Predominantly White (95%)
- Race & ethnicity
- White 95% Black 3% Two or more races 2% Hispanic / Latino 1%
- Common ancestry
- Slovak 3% Italian 3% Iranian 1%
- Foreign-born
- 1% · Canada
- Languages at home
- 99% English-only · Spanish 1%
Political lean MEDSL · Piatt
- 2024 margin
- Solid R (+30.5) · D 33.7% · R 64.3% · Other 2.0%
- 2008→2024 swing
- -18.0pp toward R · 2008: -12.6pp · 2024: -30.5pp
- All cycles
- 2024: R+30.5 2020: R+29.6 2016: R+33.6 2012: R+26.8 2008: R+12.6
Not yet ingested
- Civics
- —
Market trends
- HPI YoY
- ▼ -100.96%
- Current HPI
- 160.6145
- Rent YoY
- —
- Metro
- —
- State GDP YoY
- ▲ 1.59%
- F500 in state
- 60
Industry mix (Fortune 500 HQ in IL)
| Industry | F500 HQs | Revenue |
|---|---|---|
| Insurance | 4 | $201B |
|
||
| Consumer Goods | 4 | $87B |
|
||
| Industrial Machinery | 3 | $64B |
|
||
| Healthcare | 2 | $55B |
|
||
| Retail / Pharmacy | 1 | $148B |
|
||
| Agriculture / Food | 1 | $86B |
|
||
Price history
3 events — show timeline
- 2026-06-18 Pending — MRED as Distributed by MLS Grid
- 2026-05-09 Contingent — MRED as Distributed by MLS Grid
- 2026-05-05 Listed $189,900 MRED as Distributed by MLS Grid
Property tax history
+9.1%/yrLatest (2025): $2,755 · +10.3% YoY. Source: county tax records.
Cash-flow waterfall
monthlySold comps — $/sqft
last 12 mo · ≤1 miLoading sold comps…