601 NE 23rd St #1605 · Miami, FL
Flood risk No data
- FEMA flood zone
- —
- Chance of flooding over 30 yrs
- —
- Est. flood insurance / yr
- —
Fire risk No data
- Est. fire insurance / yr
- —
Heat risk No data
- Hot days now (above threshold)
- —
- Hot days in 30 yrs
- —
Wind risk No data
- Chance of severe wind over 30 yrs
- —
Air-quality risk No data
- Unhealthy air days now
- —
- Unhealthy air days in 30 yrs
- —
Risk factors via First Street. Map © Google.
Why this score? — see what drove the D grade
The composite is a weighted blend of 9 inputs, each scored 0–100. Each bar is that input's sub-score; the figure is the points it added to the 100-point composite (weight × sub-score).
- Cash flow +8.0/30.0
- ARV discount +7.5/15.0
- 1% rule +5.1/10.0
- Appreciation +5.1/10.0
- Schools +4.2/10.0
- Livability +3.9/5.0
- Rent growth +3.2/5.0
- Condition / age +2.5/5.0
- DSCR +2.1/10.0
$579,000
🖨 Deal sheet (PDF) 📄 Offer letter ✓ Due diligence
Listing remarks MLS
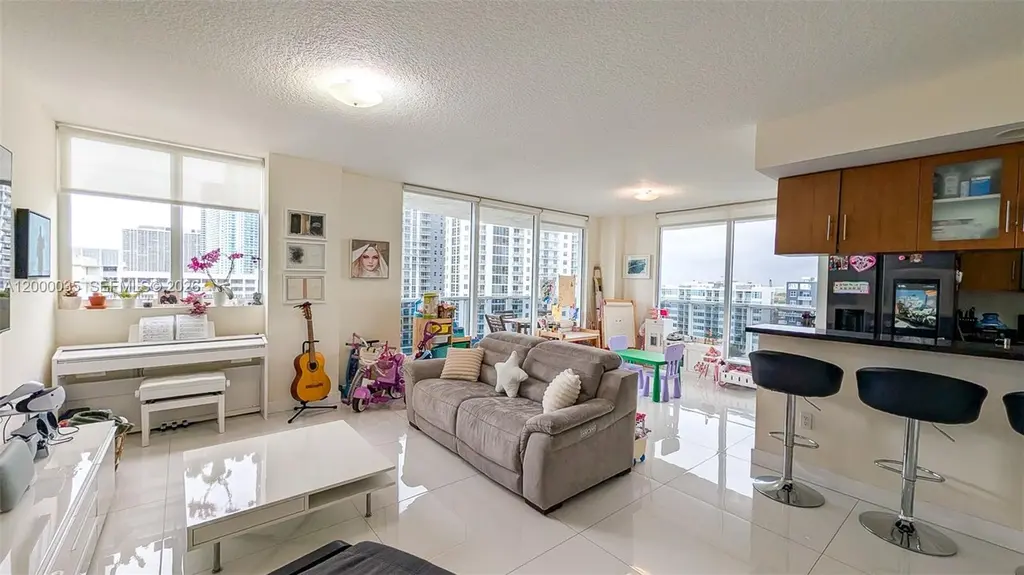
Corner unit on the 16 floor. 3 bedrooms and 2 bathrooms, located in 23 Biscayne Condo. Near to shoppings, Biscayne Blvd, Wynwood. Miami lifestyle experience.
Key facts
- Controlled access
- Fitness center
- Private balcony
Tags
Property features AI
Finance
- Financial info: Pets allowed (dogs OK)
- HOA & community: Monthly association fee; Association amenities include elevators and pool; Association fee covers amenities, parking, and trash
Exterior
- Parking: 2-car garage; Garage door opener; Two or more parking spaces (covered)
- Security: Fire alarm; Intercom; Secured lobby
- Utilities: Appliances and thermostat listed as energy-efficient
- Home design: Attached property; 16th floor entry/level; 18-story building
- Construction: Block construction; Resale property
- Exterior features: Balcony; Open balcony/patio; Security/high-impact doors; Association pool; Waterfront (bay front); Has a view
Interior
- Kitchen: Dishwasher; Microwave; Refrigerator; Electric water heater
- Flooring: Ceramic tile
- Bathrooms: 2 full bathrooms
- Heating & cooling: Central heating; Central air; Ceiling fans
- Interior features: Blinds; Impact glass windows; Dual sinks; Handicap access; Elevator
- Laundry & utility: Washer hookup; Dryer hookup
Neighborhood map
What this means for you Summary
Snapshot
- This is a 3-bed/2.0-bath condo listed at $579k.
Deal economics
- At list price, monthly cash flow is $-585 ($-7k/yr) — negative.
- To cash-flow at today's rent, offer at most $476k (17.9% below list).
- Meets the 1% rule at list price ($6k rent vs $579k).
- Recommended offer: $476k (17.9% below list) — sets the bar for cash-flow.
- Cap rate 5.1% vs local median 1.9% in Miami — top-decile yield for the area; either an underpriced asset or a hidden risk that comps aren't pricing in. Stress-test before assuming the spread holds.
Location & tenants
- Location reads 78/100 on livability (#177 in FL, #2,724 nationally) — a middle-class / working-renter tenant base. Strengths: amenities A+, commute A+, health & safety A+; Watch: employment C-, crime F, cost of living F.
- Miami-Dade (suburban): math 45% / reading 54% proficiency, ranked #40 of 73 in FL (top 55%) — families likely to look elsewhere, expect single-tenant / working-renter base with shorter leases; 64% free/reduced lunch — lower-income household profile, screen leases tightly.
- Zoned schools: Phyllis Wheatley Elementary School (math 17% / reading 17%, grade F, #2,121 of 2,144 statewide, top 99%, 189 students, 88% FRL); Jose De Diego Middle School (math 20% / reading 24%, grade F, #549 of 571 statewide, top 97%, 868 students, 68% FRL); Booker T. Washington Senior High (math 12% / reading 19%, grade F, #604 of 667 statewide, top 91%, 1,014 students, 60% FRL).
- Zoned-school proficiency averages 18% at this address vs 50% district-wide (-31 pts) — the specific schools serving this property underperform the Miami-Dade average; the district grade overstates school quality for this exact location.
- Market conditions: Rents rising (+2.7%/yr); 758 active listings in the ZIP; 3 comparable units currently listed for rent nearby; rentals leasing fast (median 1d on market — plan ~1-2 weeks tenant-placement turnaround); solid renter incomes; 10,051 units permitted in Miami-Dade County in 2024 (7,758 in 5+ unit buildings).
Forward outlook
- In year one you build about $6k of equity ($4k loan paydown + $2k appreciation (0.3% local appreciation)).
- Miami-Dade County population projected at +28% by 2050 — long-run rental-demand tailwind backs the buy-and-hold thesis.
- By year 6, paydown + projected appreciation supports a ~$36k cash-out refi (75% LTV) — recoverable capital for the next deal without selling this one.
Negotiation context
- It's been on market 29 days — a 2% lower offer ($570k) is reasonable based on typical stale-listing flexibility.
- 3 sale attempts since 8y ago with the ask held roughly flat each time — persistent listings suggest the price (not the market) is what's stuck; bring a comps-based counter.
- Current owner paid $400k; 45% above their basis — modest negotiation headroom, anchor on the comps not their cost.
Risks & watch-outs
- Watch-outs: HOA is 21% of rent.
Questions for the listing agent
- What do current leases actually rent for vs. the listed asking? Can we see a recent rent roll and the last 12 months of T-12 income?
- What does the HOA fee cover, when was the last increase, and are there any pending special assessments or reserve-fund shortfalls?
- Any open or pending special assessments — roof, HVAC, plumbing, elevator, façade? What's the per-unit balance and payoff schedule, and is the seller paying it off at close or rolling it to the buyer?
- Is there a deadline driving the sale (1031 exchange, divorce, estate, relocation)? That informs how much negotiation room exists.
- Schools are B-rated — typically a magnet for longer-tenancy family renters. What's the average tenant stay here, and is there a school-zone premium baked into asking?
- Crime grade is F in this area — have there been break-ins, vandalism, or insurance claims at this property in the last 3 years? What carrier currently insures it and at what premium?
- The area grade is low — what's the realistic commute time and amenity access for the typical tenant pool here? Any planned neighborhood developments (good or bad) we should know about?
- What's the average days-on-market for RENTAL listings here right now (not sales)? A rising rental-DOM trend means longer vacancies and softer asking-rent achievability than the comps imply.
- What's the recent tenant-quality profile in this submarket — average credit score on applications, eviction rate, late-payment / NSF rate, and stable-employment percentage? A property-management company in the area should have these aggregated.
- How much new apartment / multifamily construction is in the pipeline within 1–3 miles? Heavy new supply (>2% of stock underway) typically softens rents 12–24 months out; light construction supports rent growth.
Investment metrics
- 1% rule
- 1.01% ✓
- Cap rate
- 5.08%
- Cash-on-cash
- -4.33%
- DSCR
- 0.81
- GRM
- 8.2
CMA / ARV
No comps found within radius.
Projected returns pro-forma
0.27% appreciation · 2.73% rent growth · sell at horizon
- IRR
- -6.1%
- Equity multiple
- 0.71×
- Total profit
- $-47,535
- Equity at exit
- $176,038
- IRR
- -0.4%
- Equity multiple
- 0.95×
- Total profit
- $-8,026
- Equity at exit
- $218,030
Cash invested: $162,120 (down + closing). Projections, not guarantees.
Landlord ↔ Tenant lean methodology
- Overall (STATE)
- 87 Strongly Landlord-Friendly
- State Florida
- 87 Strongly Landlord-Friendly · R+3
- County
- — inherits STATE
- City
- — inherits STATE
ZIP-level market 33137
- Home prices YoY
- 0.1%
- Rents YoY
- 2.7%
- Active inventory
- 758
- Price-to-rent
- 8.2×
Monthly cashflow live
- Estimated rent
- $5,867 medium interval (Pro) →
- Mortgage (P&I)
- −$3,036
- Tax from tax record
- −$725 /mo · $8,705/yr
- Insurance
- −$241
- HOA
- −$1,217
- Vacancy / Maint / Mgmt
- −$1,232
- Net cashflow
- $-585
Break-even live
Sensitivity live
| Price | -10% $-258 | -5% $-422 | +0% $-585 | +5% $-749 | +10% $-913 |
|---|---|---|---|---|---|
| Rent | -10% $-1,049 | -5% $-817 | +0% $-585 | +5% $-354 | +10% $-122 |
| Rate | -1.0pp $-294 | -0.5pp $-438 | base $-585 | +0.5pp $-735 | +1.0pp $-888 |
UW: 25.0% down · 7.5% · 30yr · 1.5% tax · 5.0% vac · 8.0% maint · 8.0% mgmt
Financing live
Cash to close
- Down payment
- $144,750
- Closing costs
- $17,370
- Reserves months
- —
- Total cash needed
- —
Loan-product check · same deal, 3 products live
Conventional
25% down · 7.5% · 30yr
- Down + closing
- —
- Monthly P&I
- —
- Monthly cashflow
- —
- DSCR
- —
- Eligible?
- —
Personal DTI + credit; lowest rate.
DSCR
20% down · 8.5% · 30yr
- Down + closing
- —
- Monthly P&I
- —
- Monthly cashflow
- —
- DSCR
- —
- Eligible?
- —
No personal income docs; deal must DSCR.
Hard money
10% down · 12.0% · 12mo
- Down + closing
- —
- Monthly P&I
- —
- Monthly cashflow
- —
- DSCR
- —
- Eligible?
- —
Short-term bridge; refi at stabilization.
Rent comps 3 comps
| Address | Beds | Baths | Sqft | Rent | $/sqft | DOM | Units | Dist |
|---|---|---|---|---|---|---|---|---|
| 2900 Biscayne Blvd Miami, FL | 3.0 | 1.0–3.5 | 1260 | $18,500 | $14.68 | 4d | 13 | 0.35mi |
| 555 NE 34th St Miami, FL | 1.0–4.0 | 1.5–4.0 | 2653 | $13,925 | $5.25 | 0d | 19 | 0.64mi |
| 601 NE 1st Ave Unit 1227496P Miami, FL | 3.0 | 1.0–3.0 | 904 | $19,135 | $21.17 | 0d | 4 | 1.37mi |
HOA detail condo
- Monthly dues
- $1,217 · $14,604/yr
- Assessments
- None detected in remarks — confirm with the listing agent.
Listing history 10 events
-
2026-05-14status Pending
-
2026-05-11historical Active Under Contract
-
2026-04-14$579,000 Active
-
2021-05-28soldstatus $400,000 Closed 157-char remark
Show marketing remark (157 chars)
Corner unit on the 16 floor. 3 bedrooms and 2 bathrooms, located in 23 Biscayne Condo. Near to shoppings, Biscayne Blvd, Wynwood. Miami lifestyle experience.
-
2021-04-19status Pending 157-char remark
Show marketing remark (157 chars)
Corner unit on the 16 floor. 3 bedrooms and 2 bathrooms, located in 23 Biscayne Condo. Near to shoppings, Biscayne Blvd, Wynwood. Miami lifestyle experience.
-
2021-03-02$419,000 Active 157-char remark
Show marketing remark (157 chars)
Corner unit on the 16 floor. 3 bedrooms and 2 bathrooms, located in 23 Biscayne Condo. Near to shoppings, Biscayne Blvd, Wynwood. Miami lifestyle experience.
-
2020-06-02historical
-
2019-10-07price $399,000
-
2019-05-15price $415,000
-
2018-12-18$425,000 Active
ⓘ Source: listings_history table (triggers on properties + properties_extension) + one-shot
backfill from property_details.listing_events for pre-trigger history.
Tax reassessment forecast FL · Resets to sale price
- Current annual tax
- $8,705 · $725/mo
- Projected year-2 tax
- $8,705 · $725/mo
- Expected delta
- $0/yr ($0/mo · 0.0%)
ⓘ Screening estimate from a state-policy table — verify with the county assessor before closing.
Nearby sold comps map
Loading sold comps map…
Walkable amenities ~0.75 mi
Loading nearby amenities…
Taxation est. · year 1
- Rental income
- $70,399
- − Mortgage interest
- −$32,433
- − Property taxes
- −$8,705
- − Insurance
- −$2,895
- − Repairs & maintenance
- −$5,632
- − Management
- −$5,632
- − HOA
- −$14,604
- − Depreciation
- −$16,844
- Taxable loss
- −$16,346
- Est. tax savings @ 24.0%
- +$3,923
- After-tax cash flow
- $-3,102/yr
For passive investors: Depreciation is non-cash, so a rental often shows a tax loss while cash-flowing — sheltering income. Rental losses are passive: they offset passive income freely, and up to $25,000/yr can offset ordinary (W-2) income if you actively participate and your MAGI is under $100k (phasing out to $0 by $150k); unused losses carry forward. On sale, claimed depreciation is recaptured at up to 25%, and gains may owe capital-gains tax (a 1031 exchange can defer both). Figures are a year-1 estimate at your 24.0% rate — not tax advice; consult a CPA.
Schools (NCES district)
- District
- Miami-Dade
- NCES district ID
- 1200390
- Math proficiency
- 45% ▼ -16.00%
- Reading proficiency
- 54% ▼ -5.00%
- Median HH income
- $43,928
- Composite
- 41.76/100
- National rank
- #3397
- State rank
- #40 of 73 in FL
Livability — Miami
- Score
- 78/100
- State rank
- #177
- US rank
- #2724
Category grades
Schools grade is shown separately in the Schools card above.
Census & demographics
- Census place
- Miami, FL
- County
- Miami-Dade County · 2,697,751 people
- City population
- 827,308
- Metro
- Miami-Fort Lauderdale-Pompano Beach, FL
- Population (ZIP)
- 29,414
- Household income
- $94,036
- Rent vs Own
- Severe rent burden
- 3106.0
Population outlook (Miami-Dade County) Hauer SSP2
- Today (2025)
- 3,126,439 people
- By 2030
- 3,325,765 · +6.4%
- By 2040
- 3,697,561 · +18.3%
- By 2050
- 4,012,134 · +28.3%
- By 2075
- 4,605,612 · +47.3%
- By 2100
- 4,866,598 · +55.7%
Race, ethnicity, and origin ACS 2023
- Neighborhood character
- Diverse neighborhood (Simpson 0.63)
- Race & ethnicity
- Hispanic / Latino 54% Two or more races 25% White 24% Black 16% Asian 2%
- Hispanic origin (detail)
- Mexican 1% Puerto Rican 5% Cuban 10% Dominican 3% Salvadoran 3%
- Common ancestry
- Hispanic 8% Estonian 2% Lithuanian 2%
- Foreign-born
- 47% · Canada, Jamaica, Dominican Republic
- Languages at home
- 34% English-only · Spanish 49% French/Haitian/Cajun 8% Other Indo-European 5%
Political lean MEDSL · Miami-Dade
- 2024 margin
- R (+11.4) · D 43.9% · R 55.4%
- 2008→2024 swing
- -27.6pp toward R · 2008: 16.1pp · 2024: -11.4pp
- All cycles
- 2024: R+11.4 2020: D+7.3 2016: D+29.6 2012: D+23.7 2008: D+16.1
Not yet ingested
- Civics
- —
Market trends
- HPI YoY
- ▲ 0.27%
- Current HPI
- 385.1514
- Rent YoY
- ▲ 2.73%
- Metro
- Miami-Fort Lauderdale-Pompano Beach, FL
- State GDP YoY
- ▲ 3.28%
- F500 in state
- 36
Industry mix (Fortune 500 HQ in FL)
| Industry | F500 HQs | Revenue |
|---|---|---|
| Industrial Technology | 2 | $29B |
|
||
| Insurance | 2 | $17B |
|
||
| Retail | 1 | $60B |
|
||
| Technology Distribution | 1 | $58B |
|
||
| Homebuilding | 1 | $35B |
|
||
| Technology Manufacturing | 1 | $35B |
|
||
Price history
+36.2% since first listed10 events — show timeline
- 2026-05-14 Pending — MARMLS
- 2026-05-11 Contingent — MARMLS
- 2026-04-14 Listed $579,000 MARMLS
- 2021-05-28 Sold (MLS) $400,000 MARMLS
- 2021-04-19 Pending — MARMLS
- 2021-03-02 Listed $419,000 MARMLS
- 2020-06-02 Listing Removed — MARMLS
- 2019-10-07 Price Changed $399,000 MARMLS
- 2019-05-15 Price Changed $415,000 MARMLS
- 2018-12-18 Listed $425,000 MARMLS
Property tax history
+2.7%/yrLatest (2025): $8,705 · -1.9% YoY. Source: county tax records.
Cash-flow waterfall
monthlySold comps — $/sqft
last 12 mo · ≤1 miLoading sold comps…