 Multi-family
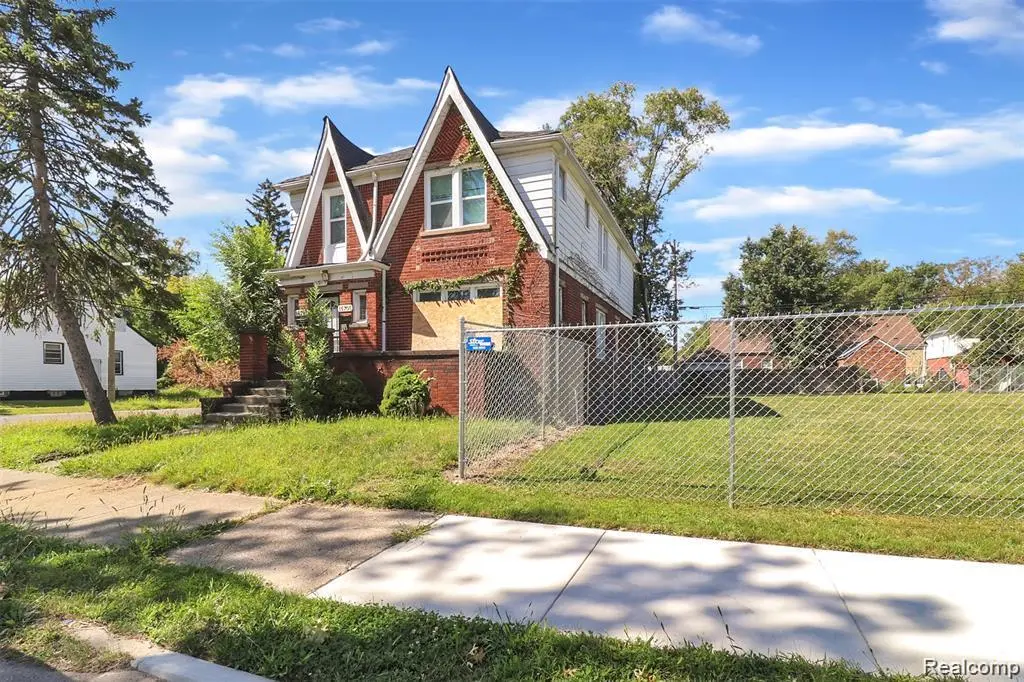
15703 Ardmore St · Detroit, MI
Flood risk 1/10 · Minimal
- FEMA flood zone
- X (unshaded)
- Chance of flooding over 30 yrs
- 0.0%
- Est. flood insurance / yr
- $473 – $860
Fire risk 1/10 · Minimal
- Est. fire insurance / yr
- $784 – $1,456
Heat risk 3/10 · Minor
- Hot days now (above 98°F)
- 7 days/yr
- Hot days in 30 yrs
- 14 days/yr
Wind risk 2/10 · Minimal
- Chance of severe wind over 30 yrs
- —
Air-quality risk 3/10 · Minor
- Unhealthy air days now
- 2 days/yr
- Unhealthy air days in 30 yrs
- 5 days/yr
Risk factors via First Street. Map © Google.
Why this score? — see what drove the B grade
The composite is a weighted blend of 9 inputs, each scored 0–100. Each bar is that input's sub-score; the figure is the points it added to the 100-point composite (weight × sub-score).
- Cash flow +30.0/30.0
- ARV discount +10.6/15.0
- 1% rule +10.0/10.0
- DSCR +10.0/10.0
- Rent growth +3.9/5.0
- Livability +3.7/5.0
- Condition / age +2.2/5.0
- Schools +1.3/10.0
- Appreciation +0.0/10.0
$103,000
🖨 Deal sheet (PDF) 📄 Offer letter ✓ Due diligence
Multi-family units
County records classify this as Multi-Family (2-4 Unit). Listing-text estimate: 1 unit. estimate disagrees with records
Listing remarks MLS
This well-maintained property features spacious living areas, plenty of natural light, and lasting character in a desirable location close to shopping, dining, and major roadways. Ideal for house-hacking - live in one unit while generating rental income from the other - or as a strong addition to your investment portfolio. Offers income potential from day one and is currently tenant-occupied.
Key facts
- Tenant occupied
- Income potential
- Desirable location
Tags
Neighborhood map
What this means for you Summary
Snapshot
- This is a 4-bed/2.0-bath multifamily listed at $103k. Condition is rated fair.
Deal economics
- At list price, monthly cash flow is $541 ($6k/yr) — positive.
- The deal already cash-flows at list — no discount required.
- Meets the 1% rule at list price ($2k rent vs $103k).
- Recommended offer: $94k (9.0% below list) — sets the bar for market timing.
- Cap rate 12.6% vs local median 10.2% in Detroit — meaningfully above typical; check what's discounted (condition, days-on-market, listing class) to confirm the premium yield is real.
Location & tenants
- Location reads 73/100 on livability (#218 in MI) — a middle-class / working-renter tenant base. Strengths: amenities A+, commute A+, cost of living A+; Watch: schools F, crime F, employment F.
- Detroit Public Schools Community District (urban): math 10% / reading 24% proficiency, ranked #499 of 540 in MI (top 92%) — low school quality limits family demand, transient renter base, plan for 1-2y turnover; 90% free/reduced lunch — lower-income household profile, screen leases tightly.
- Market conditions: Rents rising fast (+5.6%/yr); 385 active listings in the ZIP; 9 comparable units currently listed for rent nearby; rentals at typical pace (median 21d on market — plan ~3-4 weeks tenant-placement turnaround); lower-income renter base — watch delinquency; 2,639 units permitted in Wayne County in 2024 (1,216 in 5+ unit buildings).
- At $1,586/mo this rent would consume 52% of the median local household income ($37k/yr) (locally 2371% of renters already pay >50% of income on rent) — very limited rent-growth headroom before tenants either downsize or default.
Forward outlook
- Local home prices are declining (-3.0%/yr); year-one equity from $712 of loan paydown is wiped out by about $3k of value loss. Plan a longer hold.
- Wayne County population projected at -17% by 2050 — secular population decline; favor cash flow + early exit over multi-decade hold.
- At projected returns (-3.0% appreciation + 5.6% rent growth), your $29k cash investment doubles in ~5 years — after that, you're playing with house money.
Negotiation context
- It's been on market 115 days — a 9% lower offer ($94k) is reasonable based on typical stale-listing flexibility.
- 7 sale attempts since 2y ago with the ask held roughly flat each time — persistent listings suggest the price (not the market) is what's stuck; bring a comps-based counter.
Risks & watch-outs
- Watch-outs: built in 1927 — expect roof / HVAC / electrical / plumbing capex.
Questions for the listing agent
- It's been on market 115 days. Have you received any prior offers? Is the seller open to a 9% concession, seller financing, or rate buy-down credit?
- Have any recent inspections been done? Can we get a copy of the seller's disclosures and any deferred-maintenance estimates?
- Built in 1927 — when were the roof, HVAC, electrical panel, plumbing, and water heater last replaced?
- Why hasn't it sold? Are there any deal-killer items the seller is aware of (foundation, flood, title, zoning, code violations)?
- Is there a deadline driving the sale (1031 exchange, divorce, estate, relocation)? That informs how much negotiation room exists.
- Schools are F-rated, which usually means shorter tenancies and higher turnover. Who's the typical renter profile here, and what's been the actual vacancy rate?
- Crime grade is F in this area — have there been break-ins, vandalism, or insurance claims at this property in the last 3 years? What carrier currently insures it and at what premium?
- What's the average days-on-market for RENTAL listings here right now (not sales)? A rising rental-DOM trend means longer vacancies and softer asking-rent achievability than the comps imply.
- What's the recent tenant-quality profile in this submarket — average credit score on applications, eviction rate, late-payment / NSF rate, and stable-employment percentage? A property-management company in the area should have these aggregated.
- How much new apartment / multifamily construction is in the pipeline within 1–3 miles? Heavy new supply (>2% of stock underway) typically softens rents 12–24 months out; light construction supports rent growth.
Investment metrics
- 1% rule
- 1.54% ✓
- Cap rate
- 12.60%
- Cash-on-cash
- 22.51%
- DSCR
- 2.00
- GRM
- 5.4
CMA / ARV
- ARV (median comp)
- $110,696
- List price
- $103,000
- Delta
- -6.95%
- Verdict
- FAIR
- Comps
- 20 within 1.0 mi
Show comp detail 12 sales within ~0.75 mi
| Address | Dist | Beds/Ba | Sqft | Sold | Price | $/sf | Match |
|---|---|---|---|---|---|---|---|
| 15780 Stansbury St | 0.17mi | 4/2.0 | 1,824 (-10%) | 1mo | $23,500 | $13 | 74 |
| 15355 Ward St | 0.58mi | 4/2.0 | 2,043 (+1%) | 5mo | $110,000 | $54 | 68 |
| 15468 Sussex St | 0.51mi | 4/2.0 | 2,096 (+3%) | 5mo | $125,000 | $60 | 66 |
| 15425 Sorrento St | 0.62mi | 4/3.0 | 2,052 (+1%) | 4mo | $145,000 | $71 | 62 |
| 14961 Strathmoor St | 0.47mi | 4/2.0 | 1,819 (-10%) | 1mo | $110,000 | $60 | 60 |
| 15443 Whitcomb St | 0.62mi | 4/2.5 | 1,944 (-4%) | 7mo | $82,000 | $42 | 57 |
| 16143 Cheyenne St | 0.58mi | 5/2.0 (+1) | 1,928 (-5%) | 5mo | $149,500 | $78 | 55 |
| 14951 Strathmoor St | 0.47mi | 4/2.0 | 1,824 (-10%) | 7mo | $148,000 | $81 | 55 |
| 15415 Sorrento St | 0.62mi | 4/2.0 | 2,052 (+1%) | 22mo | $175,000 | $85 | 51 |
| 15438 Stansbury St | 0.17mi | 4/5.0 | 1,873 (-8%) | 20mo | $35,000 | $19 | 51 |
| 15751-53 Greenfield Rd | 0.73mi | 4/2.0 | 2,004 (-1%) | 20mo | $80,000 | $40 | 47 |
| 16567 Littlefield St | 0.65mi | 4/2.0 | 1,863 (-8%) | 22mo | $145,000 | $78 | 38 |
Match score weights: distance 35% · size 25% · config 20% · recency 20%. Top-matched comps best support the ARV.
Projected returns pro-forma
-3.0% appreciation · 5.59% rent growth · sell at horizon
- IRR
- 18.3%
- Equity multiple
- 1.76×
- Total profit
- $22,034
- Equity at exit
- $15,358
- IRR
- 28.4%
- Equity multiple
- 3.84×
- Total profit
- $82,005
- Equity at exit
- $8,906
Cash invested: $28,840 (down + closing). Projections, not guarantees.
Landlord ↔ Tenant lean methodology
- Overall (STATE)
- 62 Landlord-Friendly
- State Michigan
- 62 Landlord-Friendly · EVEN
- County
- — inherits STATE
- City
- — inherits STATE
ZIP-level market 48227
- Rents YoY
- 5.6%
- Active inventory
- 385
- Price-to-rent
- 5.4×
Monthly cashflow live
- Estimated rent
- $1,586 high interval (Pro) →
- Mortgage (P&I)
- −$540
- Tax est. 1.5%
- −$129 /mo · $1,545/yr
- Insurance
- −$43
- HOA
- −$0
- Vacancy / Maint / Mgmt
- −$333
- Net cashflow
- $541
Break-even live
Sensitivity live
| Price | -10% $612 | -5% $577 | +0% $541 | +5% $505 | +10% $470 |
|---|---|---|---|---|---|
| Rent | -10% $416 | -5% $478 | +0% $541 | +5% $604 | +10% $666 |
| Rate | -1.0pp $593 | -0.5pp $567 | base $541 | +0.5pp $514 | +1.0pp $487 |
UW: 25.0% down · 7.5% · 30yr · 1.5% tax · 5.0% vac · 8.0% maint · 8.0% mgmt
Financing live
Cash to close
- Down payment
- $25,750
- Closing costs
- $3,090
- Reserves months
- —
- Total cash needed
- —
Loan-product check · same deal, 3 products live
Conventional
25% down · 7.5% · 30yr
- Down + closing
- —
- Monthly P&I
- —
- Monthly cashflow
- —
- DSCR
- —
- Eligible?
- —
Personal DTI + credit; lowest rate.
DSCR
20% down · 8.5% · 30yr
- Down + closing
- —
- Monthly P&I
- —
- Monthly cashflow
- —
- DSCR
- —
- Eligible?
- —
No personal income docs; deal must DSCR.
Hard money
10% down · 12.0% · 12mo
- Down + closing
- —
- Monthly P&I
- —
- Monthly cashflow
- —
- DSCR
- —
- Eligible?
- —
Short-term bridge; refi at stabilization.
Rent comps 9 comps
| Address | Beds | Baths | Sqft | Rent | $/sqft | DOM | Units | Dist |
|---|---|---|---|---|---|---|---|---|
| 15762 Mark Twain St Detroit, MI | 3.0 | 2.0 | 1430 | $1,250 | $0.87 | 17d | 1 | 0.10mi |
| 16505 Stansbury St Detroit, MI | 3.0 | 1.0 | 1700 | $1,345 | $0.79 | 44d | 1 | 0.42mi |
| 16230 Cheyenne St Detroit, MI | 3.0 | 1.0 | 1653 | $1,450 | $0.88 | 44d | 1 | 0.63mi |
| 16837 Winthrop St Detroit, MI | 5.0 | 2.0 | 1500 | $2,000 | $1.33 | 20d | 1 | 1.02mi |
| 14669 Rutherford St Detroit, MI | 4.0 | 2.0 | 2359 | $1,950 | $0.83 | 44d | 1 | 1.20mi |
| 16210 Ferguson St Detroit, MI | 4.0 | 2.0 | 1493 | $1,750 | $1.17 | 4d | 1 | 1.29mi |
| 14800 Woodmont Ave Detroit, MI | 3.0 | 2.0 | 1612 | $1,525 | $0.95 | 15d | 1 | 1.32mi |
| 16211 Kentucky St Detroit, MI | 4.0 | 2.0 | 2168 | $1,995 | $0.92 | 18d | 1 | 1.37mi |
| 16934 Ilene St Detroit, MI | 3.0 | 1.5 | 1516 | $1,400 | $0.92 | 20d | 1 | 1.37mi |
Listing history 27 events
-
2026-06-18days on market $103,000 Active 115 DOM
-
2026-06-17days on market $103,000 Active 114 DOM
-
2026-06-15pricedays on market $103,000 Active 112 DOM
-
2026-06-13days on market $104,000 Active 110 DOM
-
2026-06-13days on market $104,000 Active 109 DOM
-
2026-06-09days on market $104,000 Active 106 DOM
-
2026-06-08days on market $104,000 Active 105 DOM
-
2026-06-07days on market $104,000 Active 104 DOM
-
2026-06-04days on market $104,000 Active 101 DOM
-
2026-06-03days on market $104,000 Active 100 DOM
-
2026-06-01days on market $104,000 Active 98 DOM
-
2026-05-31days on market $104,000 Active 97 DOM
-
2026-05-04price $104,000 395-char remark
Show marketing remark (403 chars)
This well-maintained property features spacious living areas, plenty of natural light, and lasting character in a desirable location close to shopping, dining, and major roadways. Ideal for house-hacking—live in one unit while generating rental income from the other—or as a strong addition to your investment portfolio. Offers income potential from day one and is currently tenant-occupied.
-
2026-05-04price $104,000 403-char remark
Show marketing remark (403 chars)
This well-maintained property features spacious living areas, plenty of natural light, and lasting character in a desirable location close to shopping, dining, and major roadways. Ideal for house-hacking—live in one unit while generating rental income from the other—or as a strong addition to your investment portfolio. Offers income potential from day one and is currently tenant-occupied.
-
2026-02-23$105,000 Active 403-char remark
Show marketing remark (395 chars)
This well-maintained property features spacious living areas, plenty of natural light, and lasting character in a desirable location close to shopping, dining, and major roadways. Ideal for house-hacking - live in one unit while generating rental income from the other - or as a strong addition to your investment portfolio. Offers income potential from day one and is currently tenant-occupied.
-
2026-02-23$105,000 Active 395-char remark
Show marketing remark (395 chars)
This well-maintained property features spacious living areas, plenty of natural light, and lasting character in a desirable location close to shopping, dining, and major roadways. Ideal for house-hacking - live in one unit while generating rental income from the other - or as a strong addition to your investment portfolio. Offers income potential from day one and is currently tenant-occupied.
-
2026-02-12historical
-
2025-09-10status Active
-
2025-09-10status Active
-
2025-08-18historical
-
2025-08-18price $105,000
-
2025-08-18price $105,000
-
2025-08-18historical
-
2025-08-11$89,999 Active
-
2025-08-11$89,999 Active
-
2024-09-20historical
-
2024-05-03$95,000 Active
ⓘ Source: listings_history table (triggers on properties + properties_extension) + one-shot
backfill from property_details.listing_events for pre-trigger history.
Climate risk First Street
- Flood 1/10 Low FEMA zone X (unshaded) · 0% chance over 30 yrs
- Wildfire 1/10 Low
- Heat 3/10 Moderate 7 d/yr ≥98°F today · 14 d/yr by 30 yrs out
- Wind 2/10 Low
- Air quality 3/10 Moderate 2 unhealthy d/yr today · 5 by 30 yrs out
Nearby sold comps map
Loading sold comps map…
Walkable amenities ~0.75 mi
Loading nearby amenities…
Taxation est. · year 1
- Rental income
- $19,031
- − Mortgage interest
- −$5,770
- − Property taxes
- −$1,545
- − Insurance
- −$515
- − Repairs & maintenance
- −$1,522
- − Management
- −$1,522
- − Depreciation
- −$2,996
- Taxable income
- $5,160
- Est. tax owed @ 24.0%
- −$1,238
- After-tax cash flow
- $5,254/yr
For passive investors: Depreciation is non-cash, so a rental often shows a tax loss while cash-flowing — sheltering income. Rental losses are passive: they offset passive income freely, and up to $25,000/yr can offset ordinary (W-2) income if you actively participate and your MAGI is under $100k (phasing out to $0 by $150k); unused losses carry forward. On sale, claimed depreciation is recaptured at up to 25%, and gains may owe capital-gains tax (a 1031 exchange can defer both). Figures are a year-1 estimate at your 24.0% rate — not tax advice; consult a CPA.
Condition & rehab AI · 10 photos
This multi-family property requires moderate renovations to its kitchen and bathrooms, as well as exterior improvements. Upgrading these areas would significantly increase its value for both resale and rental.
Repairs flagged
- Major Kitchen cabinets — The cabinets are outdated and in poor condition.
- Major Kitchen countertop — The countertop is worn and in poor condition.
- Major Kitchen backsplash — The backsplash is outdated and in poor condition.
- Major Bathroom fixtures — The fixtures are outdated and in poor condition.
- Major Bathroom flooring — The flooring is worn and in poor condition.
- Moderate Exterior siding — The siding is in fair condition but shows signs of wear and tear.
- Major Landscaping — The landscaping is sparse and in need of maintenance.
Value-add opportunities
- Both Kitchen renovation — A new kitchen with updated cabinetry, countertop, and backsplash would significantly increase the home's value for both resale and rental.
- Both Bathroom renovation — Upgrading the bathrooms with new fixtures and flooring would significantly increase the home's value for both resale and rental.
- Both Exterior siding and landscaping — Renovating the exterior siding and improving the landscaping would enhance the home's curb appeal and increase its value for both resale and rental.
Renovation cost estimate screening
| Repair item | Severity | Est. cost |
|---|---|---|
| Kitchen cabinets · The cabinets are outdated and in poor condition. | Major | $15,000–50,000 |
| Kitchen countertop · The countertop is worn and in poor condition. | Major | $15,000–50,000 |
| Kitchen backsplash · The backsplash is outdated and in poor condition. | Major | $15,000–50,000 |
| Bathroom fixtures · The fixtures are outdated and in poor condition. | Major | $15,000–50,000 |
| Bathroom flooring · The flooring is worn and in poor condition. | Major | $15,000–50,000 |
| Exterior siding · The siding is in fair condition but shows signs of wear and tear. | Moderate | $3,000–15,000 |
| Landscaping · The landscaping is sparse and in need of maintenance. | Major | $15,000–50,000 |
| Total estimated repair cost · 7 items | $93,000–315,000 |
Value-add ROI direction
- Both Kitchen renovation — A new kitchen with updated cabinetry, countertop, and backsplash would significantly increase the home's value for both resale and rental. ↑
- Both Bathroom renovation — Upgrading the bathrooms with new fixtures and flooring would significantly increase the home's value for both resale and rental. ↑
- Both Exterior siding and landscaping — Renovating the exterior siding and improving the landscaping would enhance the home's curb appeal and increase its value for both resale and rental. ↑
ⓘ Cost ranges are severity-bucket heuristics (US national rule-of-thumb). Get contractor quotes + a written scope before underwriting a rehab budget.
Schools (NCES district)
- District
- Detroit Public Schools Community District
- NCES district ID
- 2601103
- Math proficiency
- 10% ▼ -2.00%
- Reading proficiency
- 24% ▲ 6.00%
- Median HH income
- $25,815
- Composite
- 13.06/100
- National rank
- #9564
- State rank
- #499 of 540 in MI
Livability — Detroit
- Score
- 73/100
- State rank
- #218
- US rank
- #5427
Category grades
Schools grade is shown separately in the Schools card above.
Census & demographics
- Census place
- Detroit, MI
- County
- Wayne County · 1,562,939 people
- City population
- 572,865
- Metro
- Detroit-Warren-Dearborn, MI
- Population (ZIP)
- 40,302
- Household income
- $36,527
- Rent vs Own
- Severe rent burden
- 2371.0
Population outlook (Wayne County) Hauer SSP2
- Today (2025)
- 1,675,273 people
- By 2030
- 1,620,300 · -3.3%
- By 2040
- 1,502,341 · -10.3%
- By 2050
- 1,384,039 · -17.4%
- By 2075
- 1,124,592 · -32.9%
- By 2100
- 881,193 · -47.4%
Race, ethnicity, and origin ACS 2023
- Neighborhood character
- Predominantly Black (95%)
- Race & ethnicity
- Black 95% Two or more races 3% White 1%
- Foreign-born
- 1%
- Languages at home
- 98% English-only · Spanish 1% French/Haitian/Cajun 1%
Political lean MEDSL · Wayne
- 2024 margin
- Strong D (+29.0) · D 62.7% · R 33.7% · Other 3.6%
- 2008→2024 swing
- -20.5pp toward R · 2008: 49.5pp · 2024: 29.0pp
- All cycles
- 2024: D+29.0 2020: D+38.1 2016: D+37.3 2012: D+46.9 2008: D+49.5
Not yet ingested
- Civics
- —
Market trends
- HPI YoY
- ▼ -125.00%
- Current HPI
- 186.4158
- Rent YoY
- ▲ 5.59%
- Metro
- Detroit-Warren-Dearborn, MI
- State GDP YoY
- ▲ 1.37%
- F500 in state
- 28
Industry mix (Fortune 500 HQ in MI)
| Industry | F500 HQs | Revenue |
|---|---|---|
| Automotive Parts | 3 | $48B |
|
||
| Automotive | 2 | $372B |
|
||
| Chemicals | 1 | $45B |
|
||
| Automotive Retail | 1 | $29B |
|
||
| Healthcare / Medical Devices | 1 | $23B |
|
||
| Automotive Technology | 1 | $20B |
|
||
Price history
+9.5% since first listed15 events — show timeline
- 2026-05-04 Price Changed $104,000 MiRealSource-MiMLS
- 2026-05-04 Price Changed $104,000 REALCOMP
- 2026-02-23 Listed $105,000 REALCOMP
- 2026-02-23 Listed $105,000 MiRealSource-MiMLS
- 2026-02-12 Listing Removed — MiRealSource-MiMLS
- 2025-09-10 Relisted — MiRealSource-MiMLS
- 2025-09-10 Relisted — REALCOMP
- 2025-08-18 Listing Removed — REALCOMP
- 2025-08-18 Price Changed $105,000 REALCOMP
- 2025-08-18 Price Changed $105,000 MiRealSource-MiMLS
- 2025-08-18 Listing Removed — MiRealSource-MiMLS
- 2025-08-11 Listed $89,999 REALCOMP
- 2025-08-11 Listed $89,999 MiRealSource-MiMLS
- 2024-09-20 Listing Removed — MiRealSource-MiMLS
- 2024-05-03 Listed $95,000 MiRealSource-MiMLS
Cash-flow waterfall
monthlySold comps — $/sqft
last 12 mo · ≤1 miLoading sold comps…