 Multi-family
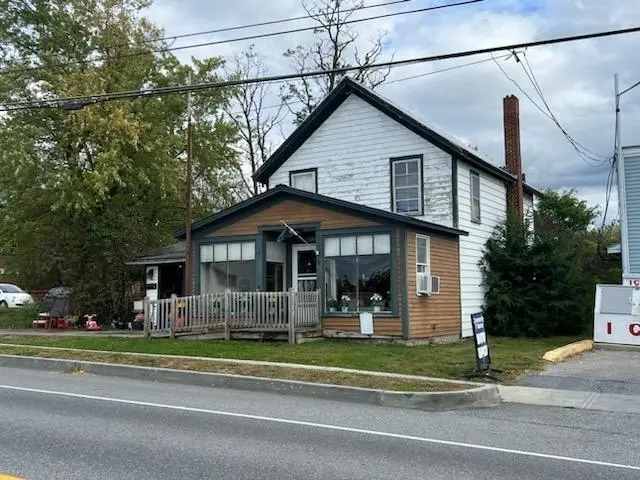
13 Main St · Vergennes, VT
Flood risk No data
- FEMA flood zone
- —
- Chance of flooding over 30 yrs
- —
- Est. flood insurance / yr
- —
Fire risk No data
- Est. fire insurance / yr
- —
Heat risk 3/10 · Minor
- Hot days now (above threshold)
- 7 days/yr
- Hot days in 30 yrs
- 15 days/yr
Wind risk No data
- Chance of severe wind over 30 yrs
- —
Air-quality risk 2/10 · Minimal
- Unhealthy air days now
- 1 days/yr
- Unhealthy air days in 30 yrs
- 1 days/yr
Risk factors via First Street. Map © Google.
Why this score? — see what drove the C grade
The composite is a weighted blend of 9 inputs, each scored 0–100. Each bar is that input's sub-score; the figure is the points it added to the 100-point composite (weight × sub-score).
- Cash flow +22.7/30.0
- ARV discount +7.5/15.0
- DSCR +7.3/10.0
- 1% rule +5.9/10.0
- Schools +5.0/10.0
- Livability +3.9/5.0
- Rent growth +2.5/5.0
- Condition / age +2.2/5.0
- Appreciation +0.0/10.0
$199,000
🖨 Deal sheet (PDF) 📄 Offer letter ✓ Due diligence
Multi-family units
County records classify this as Multi-Family (2-4 Unit). Listing-text estimate: 1 unit. estimate disagrees with records
Listing remarks MLS
Income-Producing Investment Opportunity! Mixed-use commercial/residential property located in the Northern Gateway area. The street-level commercial unit is currently leased to a hair salon, providing immediate cash flow. The four-bedroom residential apartment is vacant and ready for a complete remodel, offering an opportunity to significantly increase rental income upon completion. Property may support the addition of further units, subject to zoning and municipal approvals. Ideal for investors seeking a renovation property, improved rents, and long-term appreciation. Also listed as Commercial MLS# 5073389
Key facts
- Complete remodel
- 4,356 sq ft lot
- Built 1910
Tags
Neighborhood map
What this means for you Summary
Snapshot
- This is a 4-bed/1.0-bath multifamily listed at $199k. Condition is rated fair.
Deal economics
- At list price, monthly cash flow is $342 ($4k/yr) — positive.
- The deal already cash-flows at list — no discount required.
- Meets the 1% rule at list price ($2k rent vs $199k).
- Recommended offer: $175k (12.0% below list) — sets the bar for market timing.
Location & tenants
- Location reads 77/100 on livability (#13 in VT, #3,051 nationally) — a middle-class / working-renter tenant base. Strengths: crime A+, housing A+, health & safety A+; Watch: schools C-, amenities D+, commute F.
- Market conditions: 31 active listings in the ZIP; 104 units permitted in Addison County in 2024 (6 in 5+ unit buildings).
Forward outlook
- Local home prices are declining (-3.0%/yr); year-one equity from $1k of loan paydown is wiped out by about $6k of value loss. Plan a longer hold.
- Addison County population projected at -12% by 2050 — secular population decline; favor cash flow + early exit over multi-decade hold.
Negotiation context
- It's been on market 164 days — a 12% lower offer ($175k) is reasonable based on typical stale-listing flexibility.
Risks & watch-outs
- Watch-outs: built in 1910 — expect roof / HVAC / electrical / plumbing capex.
Questions for the listing agent
- It's been on market 164 days. Have you received any prior offers? Is the seller open to a 12% concession, seller financing, or rate buy-down credit?
- Have any recent inspections been done? Can we get a copy of the seller's disclosures and any deferred-maintenance estimates?
- Built in 1910 — when were the roof, HVAC, electrical panel, plumbing, and water heater last replaced?
- Why hasn't it sold? Are there any deal-killer items the seller is aware of (foundation, flood, title, zoning, code violations)?
- Is there a deadline driving the sale (1031 exchange, divorce, estate, relocation)? That informs how much negotiation room exists.
- What's the average days-on-market for RENTAL listings here right now (not sales)? A rising rental-DOM trend means longer vacancies and softer asking-rent achievability than the comps imply.
- What's the recent tenant-quality profile in this submarket — average credit score on applications, eviction rate, late-payment / NSF rate, and stable-employment percentage? A property-management company in the area should have these aggregated.
- How much new apartment / multifamily construction is in the pipeline within 1–3 miles? Heavy new supply (>2% of stock underway) typically softens rents 12–24 months out; light construction supports rent growth.
Investment metrics
- 1% rule
- 1.09% ✓
- Cap rate
- 8.36%
- Cash-on-cash
- 7.37%
- DSCR
- 1.33
- GRM
- 7.6
CMA / ARV
- ARV (median comp)
- $402,254
- List price
- $199,000
- Delta
- -50.53%
- Verdict
- UNDERPRICED
- Comps
- 6 within 1.0 mi
Show comp detail 1 sale within ~0.75 mi
| Address | Dist | Beds/Ba | Sqft | Sold | Price | $/sf | Match |
|---|---|---|---|---|---|---|---|
| 64 Main St | 0.35mi | 5/3.0 (+1) | 2,164 (+3%) | 23mo | $475,000 | $220 | 47 |
Match score weights: distance 35% · size 25% · config 20% · recency 20%. Top-matched comps best support the ARV.
Projected returns pro-forma
-3.0% appreciation · 3.0% rent growth · sell at horizon
- IRR
- -5.0%
- Equity multiple
- 0.81×
- Total profit
- $-10,415
- Equity at exit
- $29,672
- IRR
- 4.7%
- Equity multiple
- 1.34×
- Total profit
- $19,134
- Equity at exit
- $17,206
Cash invested: $55,720 (down + closing). Projections, not guarantees.
Landlord ↔ Tenant lean methodology
- Overall (STATE)
- 41 Moderately Tenant-Leaning
- State Vermont
- 41 Moderately Tenant-Leaning · D+15
- County
- — inherits STATE
- City
- — inherits STATE
ZIP-level market 05491
- Active inventory
- 31
- Price-to-rent
- 7.6×
Monthly cashflow live
- Estimated rent
- $2,174 medium interval (Pro) →
- Mortgage (P&I)
- −$1,044
- Tax est. 1.5%
- −$249 /mo · $2,985/yr
- Insurance
- −$83
- HOA
- −$0
- Vacancy / Maint / Mgmt
- −$457
- Net cashflow
- $342
Break-even live
Sensitivity live
| Price | -10% $480 | -5% $411 | +0% $342 | +5% $274 | +10% $205 |
|---|---|---|---|---|---|
| Rent | -10% $171 | -5% $256 | +0% $342 | +5% $428 | +10% $514 |
| Rate | -1.0pp $442 | -0.5pp $393 | base $342 | +0.5pp $291 | +1.0pp $238 |
UW: 25.0% down · 7.5% · 30yr · 1.5% tax · 5.0% vac · 8.0% maint · 8.0% mgmt
Financing live
Cash to close
- Down payment
- $49,750
- Closing costs
- $5,970
- Reserves months
- —
- Total cash needed
- —
Loan-product check · same deal, 3 products live
Conventional
25% down · 7.5% · 30yr
- Down + closing
- —
- Monthly P&I
- —
- Monthly cashflow
- —
- DSCR
- —
- Eligible?
- —
Personal DTI + credit; lowest rate.
DSCR
20% down · 8.5% · 30yr
- Down + closing
- —
- Monthly P&I
- —
- Monthly cashflow
- —
- DSCR
- —
- Eligible?
- —
No personal income docs; deal must DSCR.
Hard money
10% down · 12.0% · 12mo
- Down + closing
- —
- Monthly P&I
- —
- Monthly cashflow
- —
- DSCR
- —
- Eligible?
- —
Short-term bridge; refi at stabilization.
Listing history 21 events
-
2026-06-21days on market $199,000 Active 164 DOM
-
2026-06-18days on market $199,000 Active 162 DOM
-
2026-06-17days on market $199,000 Active 161 DOM
-
2026-06-16days on market $199,000 Active 160 DOM
-
2026-06-15days on market $199,000 Active 159 DOM
-
2026-06-15days on market $199,000 Active 158 DOM
-
2026-06-13days on market $199,000 Active 157 DOM
-
2026-06-12days on market $199,000 Active 156 DOM
-
2026-06-09days on market $199,000 Active 153 DOM
-
2026-06-08days on market $199,000 Active 152 DOM
-
2026-06-08days on market $199,000 Active 151 DOM
-
2026-06-07days on market $199,000 Active 150 DOM
-
2026-06-03days on market $199,000 Active 147 DOM
-
2026-06-02days on market $199,000 Active 146 DOM
-
2026-06-01days on market $199,000 Active 145 DOM
-
2026-05-31days on market $199,000 Active 144 DOM
-
2026-01-07$199,000 Active 614-char remark
Show marketing remark (614 chars)
Income-Producing Investment Opportunity! Mixed-use commercial/residential property located in the Northern Gateway area. The street-level commercial unit is currently leased to a hair salon, providing immediate cash flow. The four-bedroom residential apartment is vacant and ready for a complete remodel, offering an opportunity to significantly increase rental income upon completion. Property may support the addition of further units, subject to zoning and municipal approvals. Ideal for investors seeking a renovation property, improved rents, and long-term appreciation. Also listed as Commercial MLS# 5073389
-
2025-10-27price $199,000
-
2025-09-23price $229,000
-
2025-05-27price $237,000
-
2025-04-09price $244,000
ⓘ Source: listings_history table (triggers on properties + properties_extension) + one-shot
backfill from property_details.listing_events for pre-trigger history.
Climate risk First Street
- Heat 3/10 Moderate
- Air quality 2/10 Low 1 unhealthy d/yr today · 1 by 30 yrs out
Nearby sold comps map
Loading sold comps map…
Walkable amenities ~0.75 mi
Loading nearby amenities…
Taxation est. · year 1
- Rental income
- $26,089
- − Mortgage interest
- −$11,147
- − Property taxes
- −$2,985
- − Insurance
- −$995
- − Repairs & maintenance
- −$2,087
- − Management
- −$2,087
- − Depreciation
- −$5,789
- Taxable income
- $998
- Est. tax owed @ 24.0%
- −$240
- After-tax cash flow
- $3,868/yr
For passive investors: Depreciation is non-cash, so a rental often shows a tax loss while cash-flowing — sheltering income. Rental losses are passive: they offset passive income freely, and up to $25,000/yr can offset ordinary (W-2) income if you actively participate and your MAGI is under $100k (phasing out to $0 by $150k); unused losses carry forward. On sale, claimed depreciation is recaptured at up to 25%, and gains may owe capital-gains tax (a 1031 exchange can defer both). Figures are a year-1 estimate at your 24.0% rate — not tax advice; consult a CPA.
Condition & rehab AI · 5 photos
This multi-family property requires moderate renovations to its exterior and interior, with a focus on painting and flooring repairs. Immediate value can be added by addressing these issues, improving both its resale and rental potential.
Repairs flagged
- Major exterior siding — Severe weathering
- Major exterior paint — Peeling and faded
- Minor interior flooring — Worn but not damaged
- Minor interior walls — Painted but some wear
Value-add opportunities
- Both paint exterior — Enhances curb appeal and value
- Both repair flooring — Improves living space and rental appeal
- Both touch up interior walls — Enhances interior aesthetics and rental appeal
Renovation cost estimate screening
| Repair item | Severity | Est. cost |
|---|---|---|
| exterior siding · Severe weathering | Major | $15,000–50,000 |
| exterior paint · Peeling and faded | Major | $15,000–50,000 |
| interior flooring · Worn but not damaged | Minor | $500–3,000 |
| interior walls · Painted but some wear | Minor | $500–3,000 |
| Total estimated repair cost · 4 items | $31,000–106,000 |
Value-add ROI direction
- Both paint exterior — Enhances curb appeal and value ↑
- Both repair flooring — Improves living space and rental appeal ↑
- Both touch up interior walls — Enhances interior aesthetics and rental appeal ↑
ⓘ Cost ranges are severity-bucket heuristics (US national rule-of-thumb). Get contractor quotes + a written scope before underwriting a rehab budget.
Schools (NCES district)
No district data.
Livability — Vergennes
- Score
- 77/100
- State rank
- #13
- US rank
- #3051
Category grades
Schools grade is shown separately in the Schools card above.
Census & demographics
- Census place
- Vergennes, VT
- Population (ZIP)
- 5,750
Population outlook (Addison County) Hauer SSP2
- Today (2025)
- 37,078 people
- By 2030
- 36,688 · -1.1%
- By 2040
- 34,988 · -5.6%
- By 2050
- 32,561 · -12.2%
- By 2075
- 27,584 · -25.6%
- By 2100
- 22,720 · -38.7%
Race, ethnicity, and origin ACS 2023
- Neighborhood character
- Predominantly White (93%)
- Race & ethnicity
- White 93% Two or more races 4% Hispanic / Latino 3%
- Common ancestry
- Lithuanian 7% Iranian 6% Romanian 3%
- Foreign-born
- 2% · Canada
- Languages at home
- 97% English-only · Spanish 1%
Political lean MEDSL · Addison
- 2024 margin
- Solid D (+35.9) · D 66.4% · R 30.6% · Other 3.0%
- 2008→2024 swing
- -3.3pp toward R · 2008: 39.2pp · 2024: 35.9pp
- All cycles
- 2024: D+35.9 2020: D+39.4 2016: D+33.6 2012: D+39.7 2008: D+39.2
Not yet ingested
- Civics
- —
Market trends
- HPI YoY
- ▼ -148.49%
- Current HPI
- 266.2657
- Rent YoY
- —
- Metro
- —
- State GDP YoY
- —
- F500 in state
- 0
Price history
-18.4% since first listed5 events — show timeline
- 2026-01-07 Listed $199,000 PrimeMLS
- 2025-10-27 Price Changed $199,000 PrimeMLS
- 2025-09-23 Price Changed $229,000 PrimeMLS
- 2025-05-27 Price Changed $237,000 PrimeMLS
- 2025-04-09 Price Changed $244,000 PrimeMLS
Cash-flow waterfall
monthlySold comps — $/sqft
last 12 mo · ≤1 miLoading sold comps…