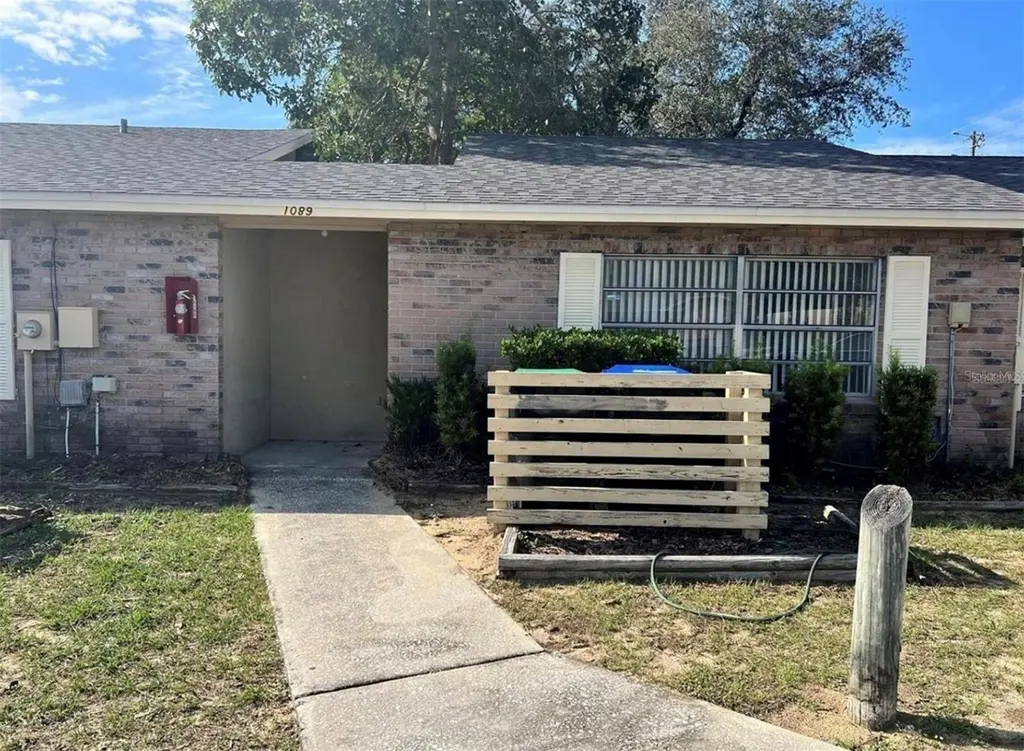
1089 Woodman Way · Pine Hills, FL
Flood risk 1/10 · Minimal
- FEMA flood zone
- X (unshaded)
- Chance of flooding over 30 yrs
- 0.0%
- Est. flood insurance / yr
- $507 – $1,088
Fire risk 1/10 · Minimal
- Est. fire insurance / yr
- $947 – $1,759
Heat risk 9/10 · Severe
- Hot days now (above 108°F)
- 7 days/yr
- Hot days in 30 yrs
- 23 days/yr
Wind risk 9/10 · Severe
- Chance of severe wind over 30 yrs
- 99.0%
Air-quality risk 1/10 · Minimal
- Unhealthy air days now
- 0 days/yr
- Unhealthy air days in 30 yrs
- 0 days/yr
Risk factors via First Street. Map © Google.
Why this score? — see what drove the D grade
The composite is a weighted blend of 9 inputs, each scored 0–100. Each bar is that input's sub-score; the figure is the points it added to the 100-point composite (weight × sub-score).
- Cash flow +15.3/30.0
- ARV discount +7.5/15.0
- DSCR +4.7/10.0
- 1% rule +4.2/10.0
- Schools +4.1/10.0
- Livability +3.7/5.0
- Condition / age +2.5/5.0
- Rent growth +1.8/5.0
- Appreciation +0.0/10.0
$185,000
🖨 Deal sheet (PDF) 📄 Offer letter ✓ Due diligence
Listing remarks
Priced to sell!! Great opportunity to own this remodeled townhouse in Lake Sherwood Hills. The property is located in a quiet neighborhood and features luxury vinyl plank, newly renovated bathrooms and kitchen with stainless steel appliances. Near major highways, shopping, park and restaurants. Call and schedule your showing today!
Key facts
- Luxury vinyl plank
- Remodeled townhouse
- Quiet neighborhood
Tags
Property features AI
Finance
- Other: Property zoned P-D; Property type: Residential - Townhouse; Lot approx. 0.1 acre (about 412 sq. meters)
- HOA & community: No association fee listed; No secondary association; No lease restrictions
Exterior
- Parking: Driveway
- Utilities: Public water; Public sewer; Electricity connected; Broadband/high-speed internet available
- Home design: Residential townhouse; One story; West-facing; Entry level: One
- Construction: Concrete and stucco construction; Shingle roof; Block foundation; Built as part of building number 1089
- Exterior features: Concrete road surface; Sidewalks (community)
Interior
- Kitchen: Built-in oven; Range; Dishwasher; Refrigerator
- Bedrooms: 2 bedrooms
- Flooring: Laminate; Tile
- Bathrooms: 2 full bathrooms
- Heating & cooling: Central heating (electric); Central air conditioning
- Interior features: Ceiling fans
- Laundry & utility: Inside laundry room; Washer; Dryer
Neighborhood map
What this means for you Summary
Snapshot
- This is a 2-bed/2.0-bath townhouse listed at $185k.
Deal economics
- At list price, monthly cash flow is $67 ($804/yr) — positive.
- The deal already cash-flows at list — no discount required.
- To meet the 1% rule (rent ≥ 1% of price), the offer needs to be $170k (8.1% below list).
- Recommended offer: $170k (8.1% below list) — sets the bar for 1% rule.
- Cap rate 6.7% vs local median 4.8% in Pine Hills — top-decile yield for the area; either an underpriced asset or a hidden risk that comps aren't pricing in. Stress-test before assuming the spread holds.
Location & tenants
- Location reads 73/100 on livability (#317 in FL) — a middle-class / working-renter tenant base. Strengths: commute A+, cost of living A+, housing A+; Watch: crime D+, employment D, amenities F.
- Orange (suburban): math 46% / reading 51% proficiency, ranked #43 of 73 in FL (top 59%) — families likely to look elsewhere, expect single-tenant / working-renter base with shorter leases.
- Zoned schools: William Frangus Elementary (math 32% / reading 42%, grade F, #1,609 of 2,144 statewide, top 77%, 418 students, 65% FRL); Robinswood Middle (math 25% / reading 29%, grade F, #497 of 571 statewide, top 88%, 1,080 students, 71% FRL); Ocoee High (math 17% / reading 38%, grade F, #470 of 667 statewide, top 71%, 2,536 students, 50% FRL).
- Zoned-school proficiency averages 30% at this address vs 48% district-wide (-18 pts) — the specific schools serving this property underperform the Orange average; the district grade overstates school quality for this exact location.
- Market conditions: Rents soft (-2.7%/yr); 181 active listings in the ZIP; 20 comparable units currently listed for rent nearby; rentals at typical pace (median 20d on market — plan ~3-4 weeks tenant-placement turnaround); 8,053 units permitted in Orange County in 2024 (3,133 in 5+ unit buildings).
- This rent runs 32% of the median local income ($63k/yr) — at the standard rent-burdened threshold; future hikes will face affordability resistance.
Forward outlook
- Local home prices are declining (-3.0%/yr); year-one equity from $1k of loan paydown is wiped out by about $6k of value loss. Plan a longer hold.
- Orange County population projected at +52% by 2050 — long-run rental-demand tailwind backs the buy-and-hold thesis.
Negotiation context
- It's been on market 44 days — a 3% lower offer ($179k) is reasonable based on typical stale-listing flexibility.
- 5 sale attempts; this cycle's ask has dropped $10k (5%) from the opening price — seller is motivated, your offer sets the floor, not the list.
- Current owner paid $150k; 23% above their basis — modest negotiation headroom, anchor on the comps not their cost.
Risks & watch-outs
- Climate carrying-cost: severe wind risk, 99% chance of damaging wind over 30y; extreme-heat days projected 7→23/yr by 2055 (HVAC capex compounding) — expect insurance premiums to compound above CPI over the hold.
Questions for the listing agent
- It's been on market 44 days. Have you received any prior offers? Is the seller open to a 8% concession, seller financing, or rate buy-down credit?
- Is there a deadline driving the sale (1031 exchange, divorce, estate, relocation)? That informs how much negotiation room exists.
- Schools are B-rated — typically a magnet for longer-tenancy family renters. What's the average tenant stay here, and is there a school-zone premium baked into asking?
- Crime grade is D in this area — have there been break-ins, vandalism, or insurance claims at this property in the last 3 years? What carrier currently insures it and at what premium?
- The area grade is low — what's the realistic commute time and amenity access for the typical tenant pool here? Any planned neighborhood developments (good or bad) we should know about?
- What's the average days-on-market for RENTAL listings here right now (not sales)? A rising rental-DOM trend means longer vacancies and softer asking-rent achievability than the comps imply.
- What's the recent tenant-quality profile in this submarket — average credit score on applications, eviction rate, late-payment / NSF rate, and stable-employment percentage? A property-management company in the area should have these aggregated.
- How much new for-sale + rental construction is in the pipeline within 1–3 miles? Heavy new supply typically softens prices + rents 12–24 months out; constrained supply supports both.
Investment metrics
- 1% rule
- 0.92% ✗
- Cap rate
- 6.73%
- Cash-on-cash
- 1.55%
- DSCR
- 1.07
- GRM
- 9.1
CMA / ARV
No comps found within radius.
Projected returns pro-forma
-3.0% appreciation · 0.0% rent growth · sell at horizon
- IRR
- -17.2%
- Equity multiple
- 0.41×
- Total profit
- $-30,672
- Equity at exit
- $27,584
- IRR
- -16.1%
- Equity multiple
- 0.22×
- Total profit
- $-40,379
- Equity at exit
- $15,995
Cash invested: $51,800 (down + closing). Projections, not guarantees.
Landlord ↔ Tenant lean methodology
- Overall (STATE)
- 87 Strongly Landlord-Friendly
- State Florida
- 87 Strongly Landlord-Friendly · R+3
- County
- — inherits STATE
- City
- — inherits STATE
ZIP-level market 32818
- Home prices YoY
- -22.5%
- Rents YoY
- -2.7%
- Active inventory
- 181
- Price-to-rent
- 9.1×
Monthly cashflow live
- Estimated rent
- $1,701 high interval (Pro) →
- Mortgage (P&I)
- −$970
- Tax from tax record
- −$230 /mo · $2,754/yr
- Insurance
- −$77
- HOA
- −$0
- Vacancy / Maint / Mgmt
- −$357
- Net cashflow
- $67
Break-even live
Sensitivity live
| Price | -10% $172 | -5% $119 | +0% $67 | +5% $15 | +10% $-38 |
|---|---|---|---|---|---|
| Rent | -10% $-67 | -5% $0 | +0% $67 | +5% $134 | +10% $201 |
| Rate | -1.0pp $160 | -0.5pp $114 | base $67 | +0.5pp $19 | +1.0pp $-30 |
UW: 25.0% down · 7.5% · 30yr · 1.5% tax · 5.0% vac · 8.0% maint · 8.0% mgmt
Financing live
Cash to close
- Down payment
- $46,250
- Closing costs
- $5,550
- Reserves months
- —
- Total cash needed
- —
Loan-product check · same deal, 3 products live
Conventional
25% down · 7.5% · 30yr
- Down + closing
- —
- Monthly P&I
- —
- Monthly cashflow
- —
- DSCR
- —
- Eligible?
- —
Personal DTI + credit; lowest rate.
DSCR
20% down · 8.5% · 30yr
- Down + closing
- —
- Monthly P&I
- —
- Monthly cashflow
- —
- DSCR
- —
- Eligible?
- —
No personal income docs; deal must DSCR.
Hard money
10% down · 12.0% · 12mo
- Down + closing
- —
- Monthly P&I
- —
- Monthly cashflow
- —
- DSCR
- —
- Eligible?
- —
Short-term bridge; refi at stabilization.
Rent comps 20 comps
| Address | Beds | Baths | Sqft | Rent | $/sqft | DOM | Units | Dist |
|---|---|---|---|---|---|---|---|---|
| 1109 Woodman Way Orlando, FL | 3.0 | 2.0 | 1124 | $1,750 | $1.56 | 23d | 1 | 0.04mi |
| 1275 Woodman Way Orlando, FL | 2.0 | 2.0 | 891 | $1,450 | $1.63 | 9d | 1 | 0.06mi |
| 7376 Balboa Dr #7376 Orlando, FL | 2.0 | 1.0 | 971 | $1,500 | $1.54 | 25d | 1 | 0.35mi |
| 7364 Balboa Dr #7364 Orlando, FL | 2.0 | 1.0 | 971 | $1,500 | $1.54 | 25d | 1 | 0.36mi |
| 7320 Balboa Dr #7320 Orlando, FL | 2.0 | 1.0 | 1000 | $1,600 | $1.60 | 25d | 1 | 0.41mi |
| 8008 Balasands Blvd Orlando, FL | 1.0–3.0 | 1.0–2.0 | 1140 | $1,875 | $1.64 | 0d | 16 | 0.55mi |
| 7097 Balboa Dr #7097 Orlando, FL | 2.0 | 1.0 | 1042 | $1,500 | $1.44 | 25d | 1 | 0.81mi |
| 2015 Erving Cir #102 Ocoee, FL | 2.0 | 2.0 | 1031 | $1,750 | $1.70 | 0d | 1 | 1.01mi |
| 2000 Erving Cir Ocoee, FL | 2.0–3.0 | 2.0 | 1161 | $1,700 | $1.46 | 25d | 2 | 1.01mi |
| 1995 Erving Cir #307 Ocoee, FL | 2.0 | 2.0 | 1109 | $1,800 | $1.62 | 13d | 1 | 1.04mi |
| 2025 Erving Cir Ocoee, FL | 2.0 | 1.0–2.0 | 976 | $1,650 | $1.69 | 0d | 2 | 1.04mi |
| 247 Grove St Orlando, FL | 3.0 | 2.0 | 1113 | $2,250 | $2.02 | 4d | 1 | 1.05mi |
| 247 Grove St Orlando, FL | 3.0 | 2.0 | 1113 | $2,250 | $2.02 | 25d | 1 | 1.05mi |
| 2025 Erving Cir #207 Ocoee, FL | 2.0 | 2.0 | 1031 | $1,800 | $1.75 | 23d | 1 | 1.05mi |
| 219 Ashbourne Dr Orlando, FL | 3.0 | 2.0 | 1080 | $2,205 | $2.04 | 9d | 1 | 1.13mi |
| 1101 Vintage Village Ln Ocoee, FL | 2.0 | 2.0 | 1100 | $1,725 | $1.57 | 5d | 2 | 1.16mi |
| 1024 Vizcaya Lake Rd Ocoee, FL | 1.0–2.0 | 1.0–2.0 | 776 | $1,820 | $2.35 | 0d | 27 | 1.20mi |
| 204 Hawthorne Groves Blvd Orlando, FL | 1.0–3.0 | 1.0–2.0 | 1126 | $1,738 | $1.54 | 0d | 29 | 1.23mi |
| 7350 Oak Meadows Cir Orlando, FL | 2.0 | 2.0 | 1012 | $2,350 | $2.32 | 25d | 1 | 1.41mi |
| 9426 Lake Lotta Cir Gotha, FL | 2.0 | 2.5 | 1112 | $1,975 | $1.78 | 19d | 1 | 1.47mi |
Listing history 16 events
-
2026-05-20status Active
-
2026-05-20price $185,000
-
2026-05-20price $1,400
-
2026-04-09$195,000 Active
-
2026-04-01price $1,500
-
2026-03-12$1,600
-
2026-03-03historical $1,700
-
2026-02-04$1,700
-
2025-02-05historical $1,600
-
2025-01-24price $1,600
-
2025-01-22price $1,700
-
2025-01-13$1,750
-
2022-12-05historical
-
2022-11-30soldstatus $149,900
-
2016-09-09soldstatus $109,800
-
2016-08-24soldstatus $78,500
ⓘ Source: listings_history table (triggers on properties + properties_extension) + one-shot
backfill from property_details.listing_events for pre-trigger history.
Tax reassessment forecast FL · Resets to sale price
- Current annual tax
- $2,754 · $230/mo
- Projected year-2 tax
- $2,754 · $230/mo
- Expected delta
- $0/yr ($0/mo · 0.0%)
ⓘ Screening estimate from a state-policy table — verify with the county assessor before closing.
Climate risk First Street
- Flood 1/10 Low FEMA zone X (unshaded) · 0% chance over 30 yrs
- Wildfire 1/10 Low
- Heat 9/10 Extreme 7 d/yr ≥108°F today · 23 d/yr by 30 yrs out
- Wind 9/10 Extreme 99% chance of damaging wind over 30 yrs
- Air quality 1/10 Low 0 unhealthy d/yr today · 0 by 30 yrs out
Nearby sold comps map
Loading sold comps map…
Walkable amenities ~0.75 mi
Loading nearby amenities…
Taxation est. · year 1
- Rental income
- $20,412
- − Mortgage interest
- −$10,363
- − Property taxes
- −$2,754
- − Insurance
- −$925
- − Repairs & maintenance
- −$1,633
- − Management
- −$1,633
- − Depreciation
- −$5,382
- Taxable loss
- −$2,278
- Est. tax savings @ 24.0%
- +$547
- After-tax cash flow
- $1,351/yr
For passive investors: Depreciation is non-cash, so a rental often shows a tax loss while cash-flowing — sheltering income. Rental losses are passive: they offset passive income freely, and up to $25,000/yr can offset ordinary (W-2) income if you actively participate and your MAGI is under $100k (phasing out to $0 by $150k); unused losses carry forward. On sale, claimed depreciation is recaptured at up to 25%, and gains may owe capital-gains tax (a 1031 exchange can defer both). Figures are a year-1 estimate at your 24.0% rate — not tax advice; consult a CPA.
Schools (NCES district)
- District
- Orange
- NCES district ID
- 1201440
- Math proficiency
- 46% ▼ -9.00%
- Reading proficiency
- 51% ▼ -2.00%
- Median HH income
- $49,350
- Composite
- 41.47/100
- National rank
- #3461
- State rank
- #43 of 73 in FL
Livability — Pine Hills
- Score
- 73/100
- State rank
- #317
- US rank
- #5362
Category grades
Schools grade is shown separately in the Schools card above.
Census & demographics
- County
- Orange County · 1,471,359 people
- City population
- 60,203
- Metro
- Orlando-Kissimmee-Sanford, FL
- Population (ZIP)
- 59,114
- Household income
- $63,061
- Rent vs Own
- Severe rent burden
- 2059.0
Population outlook (Orange County) Hauer SSP2
- Today (2025)
- 1,618,226 people
- By 2030
- 1,787,404 · +10.5%
- By 2040
- 2,125,621 · +31.4%
- By 2050
- 2,454,016 · +51.6%
- By 2075
- 3,173,711 · +96.1%
- By 2100
- 3,607,781 · +122.9%
Race, ethnicity, and origin ACS 2023
- Neighborhood character
- Predominantly Black (69%)
- Race & ethnicity
- Black 69% Hispanic / Latino 14% White 10% Two or more races 6% Asian 3%
- Hispanic origin (detail)
- Mexican 3% Puerto Rican 5% Cuban 1%
- Common ancestry
- Hispanic 21% Estonian 1% Romanian 1%
- Foreign-born
- 40% · Canada, Vietnam, China
- Languages at home
- 59% English-only · French/Haitian/Cajun 25% Spanish 11% Vietnamese 2%
Political lean MEDSL · Orange
- 2024 margin
- D (+13.6) · D 56.1% · R 42.5% · Other 1.3%
- 2008→2024 swing
- -5.0pp toward R · 2008: 18.6pp · 2024: 13.6pp
- All cycles
- 2024: D+13.6 2020: D+23.1 2016: D+24.6 2012: D+18.2 2008: D+18.6
Not yet ingested
- Civics
- —
Market trends
- HPI YoY
- ▼ -93.40%
- Current HPI
- 321.5821
- Rent YoY
- ▼ -2.66%
- Metro
- Orlando-Kissimmee-Sanford, FL
- State GDP YoY
- ▲ 3.28%
- F500 in state
- 36
Industry mix (Fortune 500 HQ in FL)
| Industry | F500 HQs | Revenue |
|---|---|---|
| Industrial Technology | 2 | $29B |
|
||
| Insurance | 2 | $17B |
|
||
| Retail | 1 | $60B |
|
||
| Technology Distribution | 1 | $58B |
|
||
| Homebuilding | 1 | $35B |
|
||
| Technology Manufacturing | 1 | $35B |
|
||
Price history
+135.7% since first listed16 events — show timeline
- 2026-05-20 Relisted — Stellar MLS as Distributed by MLS Grid
- 2026-05-20 Price Changed $185,000 Stellar MLS as Distributed by MLS Grid
- 2026-05-20 Price Changed $1,400 STELLARMLS
- 2026-04-09 Listed $195,000 Stellar MLS as Distributed by MLS Grid
- 2026-04-01 Price Changed $1,500 STELLARMLS
- 2026-03-12 Listed for Rent $1,600 STELLARMLS
- 2026-03-03 Rental Removed $1,700 STELLARMLS
- 2026-02-04 Listed for Rent $1,700 STELLARMLS
- 2025-02-05 Rental Removed $1,600 STELLARMLS
- 2025-01-24 Price Changed $1,600 STELLARMLS
- 2025-01-22 Price Changed $1,700 STELLARMLS
- 2025-01-13 Listed for Rent $1,750 STELLARMLS
- 2022-12-05 Rental Removed — STELLARMLS
- 2022-11-30 Sold (Public Records) $149,900 Public Records
- 2016-09-09 Sold (Public Records) $109,800 Public Records
- 2016-08-24 Sold (Public Records) $78,500 Public Records
Property tax history
+11.9%/yrLatest (2025): $2,754 · +19.8% YoY. Source: county tax records.
Cash-flow waterfall
monthlySold comps — $/sqft
last 12 mo · ≤1 miLoading sold comps…