21 Center Dr · Lumberton, MS
Flood risk 1/10 · Minimal
- FEMA flood zone
- X (unshaded)
- Chance of flooding over 30 yrs
- 0.0%
- Est. flood insurance / yr
- $507 – $1,088
Fire risk 6/10 · Moderate
- Est. fire insurance / yr
- $1,241 – $2,305
Heat risk 8/10 · Major
- Hot days now (above 108°F)
- 7 days/yr
- Hot days in 30 yrs
- 19 days/yr
Wind risk 9/10 · Severe
- Chance of severe wind over 30 yrs
- 99.0%
Air-quality risk 1/10 · Minimal
- Unhealthy air days now
- 0 days/yr
- Unhealthy air days in 30 yrs
- 0 days/yr
Risk factors via First Street. Map © Google.
Why this score? — see what drove the B+ grade
The composite is a weighted blend of 9 inputs, each scored 0–100. Each bar is that input's sub-score; the figure is the points it added to the 100-point composite (weight × sub-score).
- Cash flow +30.0/30.0
- 1% rule +10.0/10.0
- DSCR +10.0/10.0
- Appreciation +8.6/10.0
- ARV discount +7.5/15.0
- Schools +4.1/10.0
- Livability +3.5/5.0
- Rent growth +2.5/5.0
- Condition / age +2.5/5.0
$29,900
🖨 Deal sheet 📄 Offer letter ✓ Due diligence
Listing remarks
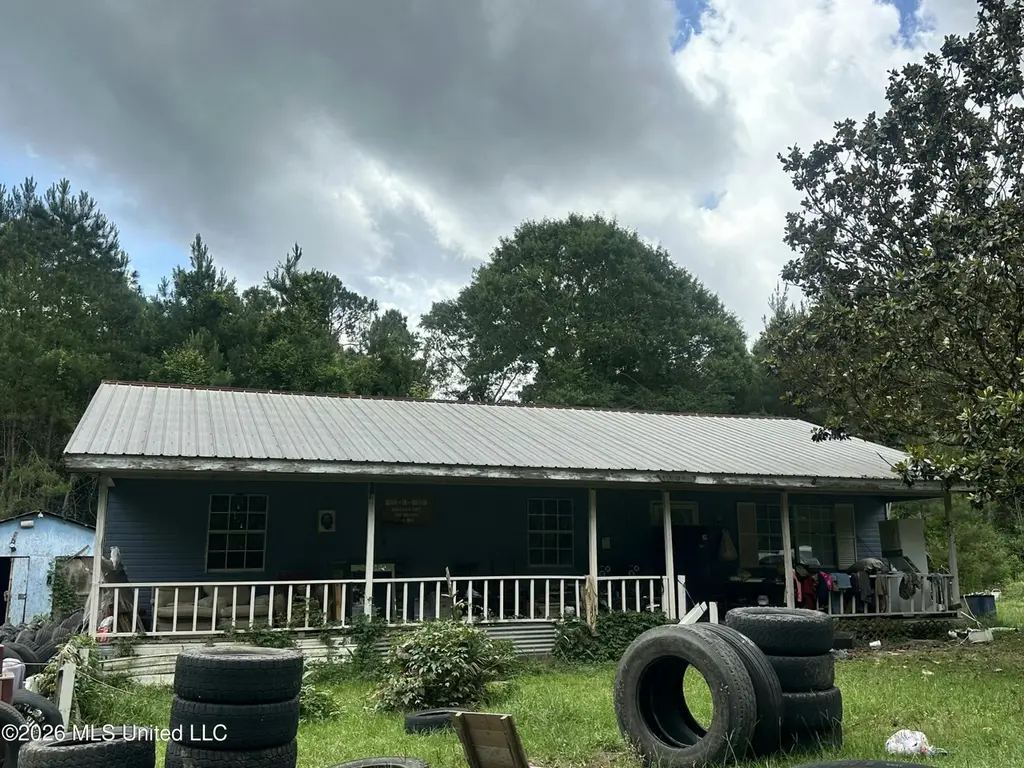
Investor opportunity with serious upside potential. Tucked away on a spacious rural lot surrounded by mature trees and open green space, this property is ready for a complete transformation. Whether you're looking for your next fix-and-flip project, rental investment, or a full renovation with room to add value, the possibilities here are endless. The home features a large yard, covered front porch, and peaceful country setting that offers privacy and flexibility for future improvements. With the right vision and updates, this property could become a standout investment in a quiet Mississippi community. Bring your contractor, your creativity, and your plans to make this one shine again. Buy
Key facts
- Covered front porch
- Open green space
- Large yard
Tags
Property features AI
Exterior
- Parking: Gravel parking
- Utilities: Sewer: see remarks; Water: see remarks; Utilities: see remarks
- Home design: Single family residence, one story; House; Entry level: One
- Construction: Metal roof; Siding (see remarks); Slab foundation; Built: public records
- Exterior features: See remarks
Interior
- Bathrooms: 1 full bathroom
- Heating & cooling: Heating: see remarks; Cooling: window unit(s)
- Interior features: Appliances: see remarks
Neighborhood map
What this means for you Summary
Snapshot
- This is a 3-bed/1.0-bath single-family listed at $30k.
Deal economics
- At list price, monthly cash flow is $709 ($9k/yr) — positive.
- The deal already cash-flows at list — no discount required.
- Meets the 1% rule at list price ($1k rent vs $30k).
- Recommended offer: $29k (1.5% below list) — sets the bar for market timing.
- Cap rate 34.7% vs local median 4.2% in Lumberton — top-decile yield for the area; either an underpriced asset or a hidden risk that comps aren't pricing in. Stress-test before assuming the spread holds.
Location & tenants
- Location reads 69/100 on livability (#53 in MS) — a middle-class / working-renter tenant base. Strengths: crime A+, cost of living A+, health & safety A+; Watch: schools D-, amenities F, commute F.
- Lamar County School District (rural): math 48% / reading 46% proficiency, ranked #18 of 130 in MS (top 14%) — families likely to look elsewhere, expect single-tenant / working-renter base with shorter leases.
- Market conditions: 300 active listings in the ZIP; 326 units permitted in Pearl River County in 2024 (0 in 5+ unit buildings).
Forward outlook
- In year one you build about $2k of equity ($207 loan paydown + $2k appreciation (7.2% local appreciation)).
- Pearl River County population projected at -19% by 2050 — secular population decline; favor cash flow + early exit over multi-decade hold.
- At projected returns (7.2% appreciation + 3.0% rent growth), your $8k cash investment doubles in ~1 year — after that, you're playing with house money.
Negotiation context
- It's been on market 19 days — a 2% lower offer ($29k) is reasonable based on typical stale-listing flexibility.
Risks & watch-outs
- Watch-outs: property tax is 3.9% of price.
- Climate carrying-cost: severe wind risk, 99% chance of damaging wind over 30y; major wildfire risk; extreme-heat days projected 7→19/yr by 2055 (HVAC capex compounding) — expect insurance premiums to compound above CPI over the hold.
Questions for the listing agent
- Property tax is high relative to price — has the assessment been appealed recently, and will the sale trigger a re-assessment?
- Is there a deadline driving the sale (1031 exchange, divorce, estate, relocation)? That informs how much negotiation room exists.
- Schools are D-rated, which usually means shorter tenancies and higher turnover. Who's the typical renter profile here, and what's been the actual vacancy rate?
- What's the average days-on-market for RENTAL listings here right now (not sales)? A rising rental-DOM trend means longer vacancies and softer asking-rent achievability than the comps imply.
- What's the recent tenant-quality profile in this submarket — average credit score on applications, eviction rate, late-payment / NSF rate, and stable-employment percentage? A property-management company in the area should have these aggregated.
- How much new for-sale + rental construction is in the pipeline within 1–3 miles? Heavy new supply typically softens prices + rents 12–24 months out; constrained supply supports both.
Investment metrics
- 1% rule
- 4.13% ✓
- Cap rate
- 34.75%
- Cash-on-cash
- 101.63%
- DSCR
- 5.52
- GRM
- 2.0
CMA / ARV
- ARV (on-the-fly)
- $123,648
- Comps found
- 1
Show comp detail 1 sale within ~0.75 mi
| Address | Dist | Beds/Ba | Sqft | Sold | Price | $/sf | Match |
|---|---|---|---|---|---|---|---|
| 10 N Lakeshore Dr | 0.28mi | 3/3.5 | 1,392 (+4%) | 12mo | $128,000 | $92 | 61 |
Match score weights: distance 35% · size 25% · config 20% · recency 20%. Top-matched comps best support the ARV.
Projected returns pro-forma
7.23% appreciation · 3.0% rent growth · sell at horizon
- IRR
- —
- Equity multiple
- 7.70×
- Total profit
- $56,081
- Equity at exit
- $21,173
- IRR
- —
- Equity multiple
- 16.44×
- Total profit
- $129,294
- Equity at exit
- $40,635
Cash invested: $8,372 (down + closing). Projections, not guarantees.
Landlord ↔ Tenant lean methodology
- Overall (STATE)
- 90 Strongly Landlord-Friendly
- State Mississippi
- 90 Strongly Landlord-Friendly · R+11
- County
- — inherits STATE
- City
- — inherits STATE
ZIP-level market 39455
- Home prices YoY
- 3.7%
- Active inventory
- 300
- Price-to-rent
- 2.0×
Monthly cashflow live
- Estimated rent
- $1,235 medium interval (Pro) →
- Mortgage (P&I)
- −$157
- Tax from tax record
- −$97 /mo · $1,164/yr
- Insurance
- −$12
- HOA
- −$0
- Vacancy / Maint / Mgmt
- −$259
- Net cashflow
- $709
Break-even live
UW: 25.0% down · 7.5% · 30yr · 1.5% tax · 5.0% vac · 8.0% maint · 8.0% mgmt
Financing live
Cash to close
- Down payment
- $7,475
- Closing costs
- $897
- Reserves months
- —
- Total cash needed
- —
Loan-product check · same deal, 3 products live
Conventional
25% down · 7.5% · 30yr
- Down + closing
- —
- Monthly P&I
- —
- Monthly cashflow
- —
- DSCR
- —
- Eligible?
- —
Personal DTI + credit; lowest rate.
DSCR
20% down · 8.5% · 30yr
- Down + closing
- —
- Monthly P&I
- —
- Monthly cashflow
- —
- DSCR
- —
- Eligible?
- —
No personal income docs; deal must DSCR.
Hard money
10% down · 12.0% · 12mo
- Down + closing
- —
- Monthly P&I
- —
- Monthly cashflow
- —
- DSCR
- —
- Eligible?
- —
Short-term bridge; refi at stabilization.
Listing history 9 events
-
2026-06-17status $29,900 Pending 19 DOM
-
2026-06-16days on market $29,900 Active 19 DOM
-
2026-06-15days on market $29,900 Active 18 DOM
-
2026-06-14days on market $29,900 Active 16 DOM
-
2026-06-13days on market $29,900 Active 15 DOM
-
2026-06-10days on market $29,900 Active 13 DOM
-
2026-06-09pricestatus $29,900 Active 12 DOM
-
2026-05-30statusdays on market $34,900 Pending 12 DOM
-
2026-05-18$34,900 Active
ⓘ Source: listings_history table (triggers on properties + properties_extension) + one-shot
backfill from property_details.listing_events for pre-trigger history.
Tax reassessment forecast MS · Resets to sale price
- Current annual tax
- $1,164 · $97/mo
- Projected year-2 tax
- $1,164 · $97/mo
- Expected delta
- $0/yr ($0/mo · 0.0%)
ⓘ Screening estimate from a state-policy table — verify with the county assessor before closing.
Climate risk First Street
- Flood 1/10 Low FEMA zone X (unshaded) · 0% chance over 30 yrs
- Wildfire 6/10 Major
- Heat 8/10 Severe 7 d/yr ≥108°F today · 19 d/yr by 30 yrs out
- Wind 9/10 Extreme 99% chance of damaging wind over 30 yrs
- Air quality 1/10 Low 0 unhealthy d/yr today · 0 by 30 yrs out
Nearby sold comps map
Loading sold comps map…
Walkable amenities ~0.75 mi
Loading nearby amenities…
Taxation est. · year 1
- Rental income
- $14,815
- − Mortgage interest
- −$1,675
- − Property taxes
- −$1,164
- − Insurance
- −$150
- − Repairs & maintenance
- −$1,185
- − Management
- −$1,185
- − Depreciation
- −$870
- Taxable income
- $8,586
- Est. tax owed @ 24.0%
- −$2,061
- After-tax cash flow
- $6,448/yr
For passive investors: Depreciation is non-cash, so a rental often shows a tax loss while cash-flowing — sheltering income. Rental losses are passive: they offset passive income freely, and up to $25,000/yr can offset ordinary (W-2) income if you actively participate and your MAGI is under $100k (phasing out to $0 by $150k); unused losses carry forward. On sale, claimed depreciation is recaptured at up to 25%, and gains may owe capital-gains tax (a 1031 exchange can defer both). Figures are a year-1 estimate at your 24.0% rate — not tax advice; consult a CPA.
Schools (NCES district)
- District
- Lamar County School District
- NCES district ID
- 2802400
- Math proficiency
- 48% ▼ -13.00%
- Reading proficiency
- 46% ▼ -7.00%
- Median HH income
- $54,742
- Composite
- 40.77/100
- National rank
- #3645
- State rank
- #18 of 130 in MS
Livability — Lumberton
- Score
- 69/100
- State rank
- #53
- US rank
- #8568
Category grades
Schools grade is shown separately in the Schools card above.
Census & demographics
- City population
- 9,030
- Population (ZIP)
- 9,030
Population outlook (Pearl River County) Hauer SSP2
- Today (2025)
- 53,426 people
- By 2030
- 51,663 · -3.3%
- By 2040
- 47,611 · -10.9%
- By 2050
- 43,286 · -19.0%
- By 2075
- 32,859 · -38.5%
- By 2100
- 22,476 · -57.9%
Race, ethnicity, and origin ACS 2023
- Neighborhood character
- Predominantly White (82%)
- Race & ethnicity
- White 82% Black 15% Two or more races 3%
- Common ancestry
- Lithuanian 5% Portuguese 2% Slovak 1%
- Foreign-born
- 0%
Political lean MEDSL · Pearl River
- 2024 margin
- Solid R (+66.7) · D 16.1% · R 82.8% · Other 1.0%
- 2008→2024 swing
- -6.3pp toward R · 2008: -60.4pp · 2024: -66.7pp
- All cycles
- 2024: R+66.7 2020: R+64.2 2016: R+66.8 2012: R+60.3 2008: R+60.4
Not yet ingested
- Civics
- —
Market trends
- HPI YoY
- ▲ 7.23%
- Current HPI
- 202.5728
- Rent YoY
- —
- Metro
- —
- State GDP YoY
- —
- F500 in state
- 0
Price history
1 event — show timeline
- 2026-05-18 Listed $34,900 MLSU
Property tax history
+2.3%/yrLatest (2025): $1,164 · +13.6% YoY. Source: county tax records.
Cash-flow waterfall
monthlySold comps — $/sqft
last 12 mo · ≤1 miLoading sold comps…