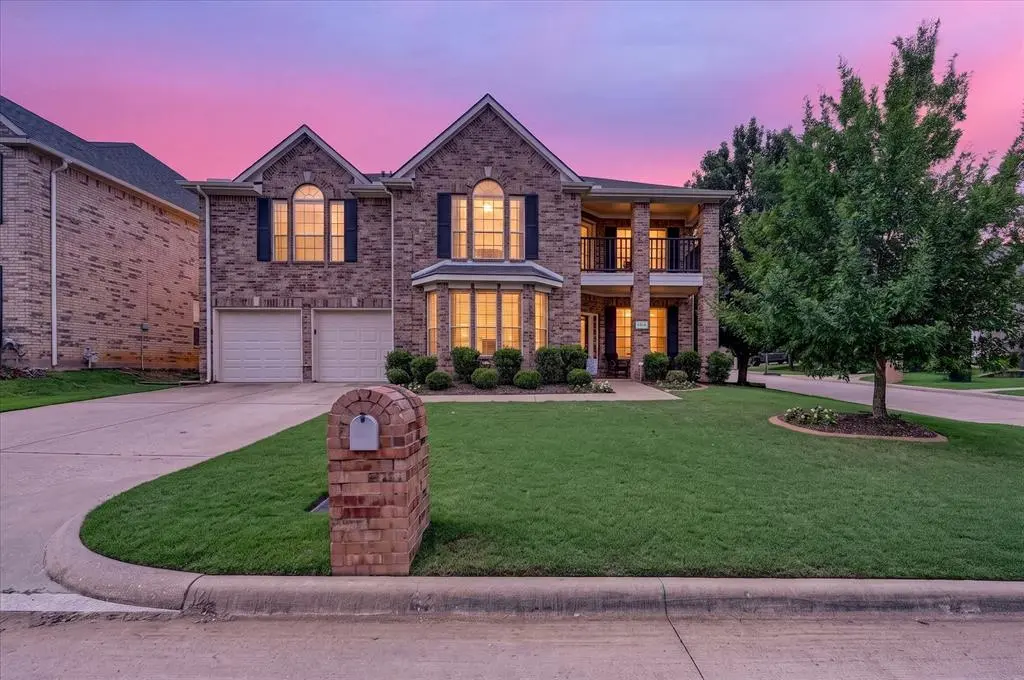
6514 Daisy Dr · Arlington, TX
Flood risk 4/10 · Minor
- FEMA flood zone
- X (unshaded)
- Chance of flooding over 30 yrs
- 0.24%
- Est. flood insurance / yr
- $507 – $1,088
Fire risk 4/10 · Minor
- Est. fire insurance / yr
- $1,222 – $2,270
Heat risk 7/10 · Major
- Hot days now (above 109°F)
- 7 days/yr
- Hot days in 30 yrs
- 23 days/yr
Wind risk 6/10 · Moderate
- Chance of severe wind over 30 yrs
- 27.0%
Air-quality risk 3/10 · Minor
- Unhealthy air days now
- 2 days/yr
- Unhealthy air days in 30 yrs
- 4 days/yr
Risk factors via First Street. Map © Google.
Why this score? — see what drove the C grade
The composite is a weighted blend of 9 inputs, each scored 0–100. Each bar is that input's sub-score; the figure is the points it added to the 100-point composite (weight × sub-score).
- Cash flow +17.9/30.0
- ARV discount +15.0/15.0
- 1% rule +5.6/10.0
- DSCR +5.6/10.0
- Livability +3.9/5.0
- Schools +3.0/10.0
- Condition / age +2.5/5.0
- Rent growth +2.3/5.0
- Appreciation +0.0/10.0
$485,000
🖨 Deal sheet (PDF) 📄 Offer letter ✓ Due diligence
Listing remarks MLS
Lovely home with great features, upstairs media room and game room. Large backyard, enough space for family gathering. One upstairs bedroom leads to outdoors balcony with sitting area. Gated Community!
Key facts
- Gated community
- Open floor plan
- Large family room
Tags
Property features AI
Finance
- Other: Easements for utilities on the property
- Financial info: Accepts Cash, Conventional, FHA, and VA financing
- HOA & community: Mandatory HOA; HOA management provided (Pennsylvania Gardens HOA); HOA fee $400 annually (includes management fees)
Exterior
- Parking: Attached 2-car garage with a single 2-car door and garage door opener; 2 covered parking spaces; Driveway
- Security: Security system; Smoke detectors
- Utilities: City water; City sewer; Electricity available and connected; Natural gas available; Cable available; Asphalt streets; Sidewalks
- Home design: Single family residence; Two levels; Residential property; Built in 2003; Brick construction
- Construction: Composition roof; Brick exterior; Slab foundation
- Exterior features: Covered porch(es); Gutters; Landscaped yard; Sprinkler system; Few trees; Corner lot; Subdivision setting; Fenced backyard (wood)
Interior
- Kitchen: Gas cooktop; Gas oven; Microwave; Disposal; Plumbed for gas in kitchen; Pantry; Solid-surface/non-natural countertops
- Bedrooms: 5 bedrooms total; Primary bedroom on level 1 with dual sinks, garden tub, separate shower, separate vanities, ensuite bath, and walk-in closet; Additional bedrooms on level 2 (multiple with walk-in closets)
- Flooring: Carpet; Ceramic tile
- Bathrooms: 3 full bathrooms; 1 half bathroom; Jack and Jill bathroom(s) on level 2
- Heating & cooling: Central heating (electric); Central air (electric); Ceiling fans
- Interior features: Open floorplan; Vaulted ceilings; Decorative lighting; Pantry; Walk-in closets; Three living areas; Two dining areas; 15 total rooms
- Laundry & utility: Laundry room with drip/dry area; Gas water heater
Neighborhood map
What this means for you Summary
Snapshot
- This is a 4-bed/2.0-bath single-family listed at $485k.
Deal economics
- At list price, monthly cash flow is $412 ($5k/yr) — positive.
- The deal already cash-flows at list — no discount required.
- Meets the 1% rule at list price ($5k rent vs $485k).
- Recommended offer: $478k (1.5% below list) — sets the bar for market timing.
- Cap rate 7.3% vs local median 3.7% in Arlington — top-decile yield for the area; either an underpriced asset or a hidden risk that comps aren't pricing in. Stress-test before assuming the spread holds.
Location & tenants
- Location reads 78/100 on livability (#75 in TX, #2,697 nationally) — a middle-class / working-renter tenant base. Strengths: amenities A+, cost of living A+, housing A+; Watch: crime F, commute F.
- Kennedale ISD (suburban): math 27% / reading 37% proficiency, ranked #522 of 826 in TX (top 63%) — families likely to look elsewhere, expect single-tenant / working-renter base with shorter leases.
- Zoned schools: James F Delaney El (math 32% / reading 37%, grade F, #1,995 of 4,322 statewide, top 50%, 661 students, 64% FRL) — zoned schools average 64% FRL vs 38% district-wide (26 pts higher); higher-poverty schools than district average — tighter screening recommended.
- Market conditions: Rents soft (-0.8%/yr); 203 active listings in the ZIP; 3 comparable units currently listed for rent nearby; rentals at typical pace (median 23d on market — plan ~3-4 weeks tenant-placement turnaround); solid renter incomes; 18,938 units permitted in Tarrant County in 2024 (8,336 in 5+ unit buildings).
- At $5,147/mo this rent would consume 69% of the median local household income ($90k/yr) (locally 1311% of renters already pay >50% of income on rent) — very limited rent-growth headroom before tenants either downsize or default.
Forward outlook
- Local home prices are declining (-3.0%/yr); year-one equity from $3k of loan paydown is wiped out by about $15k of value loss. Plan a longer hold.
- Tarrant County population projected at +41% by 2050 — long-run rental-demand tailwind backs the buy-and-hold thesis.
Negotiation context
- It's been on market 25 days — a 2% lower offer ($478k) is reasonable based on typical stale-listing flexibility.
- 4 sale attempts since 11y ago with the ask held roughly flat each time — persistent listings suggest the price (not the market) is what's stuck; bring a comps-based counter.
Risks & watch-outs
- Climate carrying-cost: major wind risk, 27% chance of damaging wind over 30y; extreme-heat days projected 7→23/yr by 2055 (HVAC capex compounding) — expect insurance premiums to compound above CPI over the hold.
Questions for the listing agent
- What does the HOA fee cover, when was the last increase, and are there any pending special assessments or reserve-fund shortfalls?
- Is there a deadline driving the sale (1031 exchange, divorce, estate, relocation)? That informs how much negotiation room exists.
- Schools are D-rated, which usually means shorter tenancies and higher turnover. Who's the typical renter profile here, and what's been the actual vacancy rate?
- Crime grade is F in this area — have there been break-ins, vandalism, or insurance claims at this property in the last 3 years? What carrier currently insures it and at what premium?
- What's the average days-on-market for RENTAL listings here right now (not sales)? A rising rental-DOM trend means longer vacancies and softer asking-rent achievability than the comps imply.
- What's the recent tenant-quality profile in this submarket — average credit score on applications, eviction rate, late-payment / NSF rate, and stable-employment percentage? A property-management company in the area should have these aggregated.
- How much new for-sale + rental construction is in the pipeline within 1–3 miles? Heavy new supply typically softens prices + rents 12–24 months out; constrained supply supports both.
Investment metrics
- 1% rule
- 1.06% ✓
- Cap rate
- 7.31%
- Cash-on-cash
- 3.64%
- DSCR
- 1.16
- GRM
- 7.9
CMA / ARV
- ARV (on-the-fly)
- $692,274
- Comps found
- 12
Show comp detail 12 sales within ~0.75 mi
| Address | Dist | Beds/Ba | Sqft | Sold | Price | $/sf | Match |
|---|---|---|---|---|---|---|---|
| 1009 Oak Ridge Ct | 0.09mi | 4/3.0 | 3,551 (-4%) | 2mo | $635,000 | $179 | 84 |
| 1008 Ohio Ct | 0.20mi | 4/3.5 | 3,389 (-8%) | 3mo | $639,000 | $189 | 68 |
| 5211 Vicksburg Dr | 0.23mi | 4/3.0 | 3,303 (-11%) | 1mo | $699,000 | $212 | 66 |
| 1008 Bell Oak Dr | 0.32mi | 5/4.0 (+1) | 3,627 (-2%) | 4mo | $499,000 | $138 | 66 |
| 5207 Leesburg Ct | 0.30mi | 4/3.5 | 3,237 (-13%) | 2mo | $698,000 | $216 | 57 |
| 5507 Independence Ave | 0.16mi | 5/3.5 (+1) | 4,031 (+9%) | 13mo | $489,995 | $122 | 56 |
| 604 Oak Leaf Dr | 0.23mi | 4/3.0 | 3,290 (-11%) | 14mo | $560,000 | $170 | 55 |
| 1001 Bell Oak Dr | 0.36mi | 4/4.0 | 3,253 (-12%) | 5mo | $495,000 | $152 | 51 |
| 504 Oak Forest Ct | 0.32mi | 5/4.0 (+1) | 3,314 (-10%) | 8mo | $535,000 | $161 | 48 |
| 7011 Gunston Ln | 0.39mi | 5/3.5 (+1) | 3,186 (-14%) | 2mo | $595,000 | $187 | 46 |
| 6601 Treepoint Dr Unit 6634 | 0.62mi | 4/3.5 | 3,494 (-6%) | 12mo | $725,000 | $207 | 46 |
| 918 Shady Creek Dr | 0.56mi | 4/3.0 | 3,195 (-14%) | 10mo | $749,900 | $235 | 39 |
Match score weights: distance 35% · size 25% · config 20% · recency 20%. Top-matched comps best support the ARV.
Projected returns pro-forma
-3.0% appreciation · 0.0% rent growth · sell at horizon
- IRR
- -14.3%
- Equity multiple
- 0.51×
- Total profit
- $-67,196
- Equity at exit
- $72,315
- IRR
- -11.9%
- Equity multiple
- 0.40×
- Total profit
- $-81,982
- Equity at exit
- $41,934
Cash invested: $135,800 (down + closing). Projections, not guarantees.
Landlord ↔ Tenant lean methodology
- Overall (STATE)
- 87 Strongly Landlord-Friendly
- State Texas
- 87 Strongly Landlord-Friendly · R+5
- County
- — inherits STATE
- City
- — inherits STATE
ZIP-level market 76017
- Rents YoY
- -0.8%
- Active inventory
- 203
- Price-to-rent
- 7.9×
Monthly cashflow live
- Estimated rent
- $5,147 medium interval (Pro) →
- Mortgage (P&I)
- −$2,543
- Tax from tax record
- −$876 /mo · $10,516/yr
- Insurance
- −$202
- HOA
- −$33
- Vacancy / Maint / Mgmt
- −$1,081
- Net cashflow
- $412
Break-even live
Sensitivity live
| Price | -10% $686 | -5% $549 | +0% $412 | +5% $274 | +10% $137 |
|---|---|---|---|---|---|
| Rent | -10% $5 | -5% $208 | +0% $412 | +5% $615 | +10% $818 |
| Rate | -1.0pp $656 | -0.5pp $535 | base $412 | +0.5pp $286 | +1.0pp $158 |
UW: 25.0% down · 7.5% · 30yr · 1.5% tax · 5.0% vac · 8.0% maint · 8.0% mgmt
Financing live
Cash to close
- Down payment
- $121,250
- Closing costs
- $14,550
- Reserves months
- —
- Total cash needed
- —
Loan-product check · same deal, 3 products live
Conventional
25% down · 7.5% · 30yr
- Down + closing
- —
- Monthly P&I
- —
- Monthly cashflow
- —
- DSCR
- —
- Eligible?
- —
Personal DTI + credit; lowest rate.
DSCR
20% down · 8.5% · 30yr
- Down + closing
- —
- Monthly P&I
- —
- Monthly cashflow
- —
- DSCR
- —
- Eligible?
- —
No personal income docs; deal must DSCR.
Hard money
10% down · 12.0% · 12mo
- Down + closing
- —
- Monthly P&I
- —
- Monthly cashflow
- —
- DSCR
- —
- Eligible?
- —
Short-term bridge; refi at stabilization.
Rent comps 3 comps
| Address | Beds | Baths | Sqft | Rent | $/sqft | DOM | Units | Dist |
|---|---|---|---|---|---|---|---|---|
| 6504 Josephine Dr Arlington, TX | 4.0 | 3.5 | 3650 | $3,499 | $0.96 | 2d | 1 | 0.11mi |
| 621 Wildcat Way Kennedale, TX | 5.0 | 5.0 | 3911 | $11,950 | $3.06 | 23d | 1 | 0.99mi |
| 621 Wildcat Way Unit 1019530P Kennedale, TX | 5.0 | 4.5 | 3907 | $23,534 | $6.02 | 25d | 1 | 0.99mi |
HOA detail
- Monthly dues
- $33 · $396/yr
- Likely covers
- security
Listing history 29 events
-
2026-06-21days on market $485,000 Active 25 DOM
-
2026-06-18days on market $485,000 Active 22 DOM
-
2026-06-17days on market $485,000 Active 21 DOM
-
2026-06-16days on market $485,000 Active 20 DOM
-
2026-06-15days on market $485,000 Active 19 DOM
-
2026-06-13days on market $485,000 Active 17 DOM
-
2026-06-09days on market $485,000 Active 13 DOM
-
2026-06-08days on market $485,000 Active 12 DOM
-
2026-06-07days on market $485,000 Active 11 DOM
-
2026-06-04days on market $485,000 Active 8 DOM
-
2026-06-03days on market $485,000 Active 7 DOM
-
2026-06-02days on market $485,000 Active 6 DOM
-
2026-06-01days on market $485,000 Active 5 DOM
-
2026-05-31days on market $485,000 Active 4 DOM
-
2026-05-27$485,000 Active
-
2016-11-21soldstatus
-
2016-11-18soldstatus Sold 201-char remark
Show marketing remark (201 chars)
Lovely home with great features, upstairs media room and game room. Large backyard, enough space for family gathering. One upstairs bedroom leads to outdoors balcony with sitting area. Gated Community!
-
2016-10-17status Pending 201-char remark
Show marketing remark (201 chars)
Lovely home with great features, upstairs media room and game room. Large backyard, enough space for family gathering. One upstairs bedroom leads to outdoors balcony with sitting area. Gated Community!
-
2016-10-01historical Active Contingent 201-char remark
Show marketing remark (201 chars)
Lovely home with great features, upstairs media room and game room. Large backyard, enough space for family gathering. One upstairs bedroom leads to outdoors balcony with sitting area. Gated Community!
-
2016-08-18$270,000 Active 201-char remark
Show marketing remark (201 chars)
Lovely home with great features, upstairs media room and game room. Large backyard, enough space for family gathering. One upstairs bedroom leads to outdoors balcony with sitting area. Gated Community!
-
2016-01-06status Pending
-
2015-11-23status Pending
-
2015-11-12historical Active Option Contract
-
2015-11-12historical
-
2015-10-15status Active
-
2015-10-12status Pending
-
2015-10-05historical Active Option Contract
-
2015-08-25$250,000 Active
-
2015-08-25historical
ⓘ Source: listings_history table (triggers on properties + properties_extension) + one-shot
backfill from property_details.listing_events for pre-trigger history.
Tax reassessment forecast TX · Resets to sale price
- Current annual tax
- $10,516 · $876/mo
- Projected year-2 tax
- $10,516 · $876/mo
- Expected delta
- $0/yr ($0/mo · 0.0%)
ⓘ Screening estimate from a state-policy table — verify with the county assessor before closing.
Climate risk First Street
- Flood 4/10 Moderate FEMA zone X (unshaded) · 24% chance over 30 yrs
- Wildfire 4/10 Moderate
- Heat 7/10 Severe 7 d/yr ≥109°F today · 23 d/yr by 30 yrs out
- Wind 6/10 Major 27% chance of damaging wind over 30 yrs
- Air quality 3/10 Moderate 2 unhealthy d/yr today · 4 by 30 yrs out
Nearby sold comps map
Loading sold comps map…
Walkable amenities ~0.75 mi
Loading nearby amenities…
Taxation est. · year 1
- Rental income
- $61,768
- − Mortgage interest
- −$27,168
- − Property taxes
- −$10,516
- − Insurance
- −$2,425
- − Repairs & maintenance
- −$4,941
- − Management
- −$4,941
- − HOA
- −$396
- − Depreciation
- −$14,109
- Taxable loss
- −$2,728
- Est. tax savings @ 24.0%
- +$655
- After-tax cash flow
- $5,594/yr
For passive investors: Depreciation is non-cash, so a rental often shows a tax loss while cash-flowing — sheltering income. Rental losses are passive: they offset passive income freely, and up to $25,000/yr can offset ordinary (W-2) income if you actively participate and your MAGI is under $100k (phasing out to $0 by $150k); unused losses carry forward. On sale, claimed depreciation is recaptured at up to 25%, and gains may owe capital-gains tax (a 1031 exchange can defer both). Figures are a year-1 estimate at your 24.0% rate — not tax advice; consult a CPA.
Schools (NCES district)
- District
- Kennedale ISD
- NCES district ID
- 4825500
- Math proficiency
- 27% ▼ -25.00%
- Reading proficiency
- 37% ▼ -13.00%
- Median HH income
- $70,497
- Composite
- 29.79/100
- National rank
- #6427
- State rank
- #522 of 826 in TX
Livability — Arlington
- Score
- 78/100
- State rank
- #75
- US rank
- #2697
Category grades
Schools grade is shown separately in the Schools card above.
Census & demographics
- Census place
- Arlington, TX
- County
- Tarrant County · 2,033,669 people
- City population
- 366,588
- Metro
- Dallas-Fort Worth-Arlington, TX
- Population (ZIP)
- 47,074
- Household income
- $90,083
- Rent vs Own
- Severe rent burden
- 1311.0
Population outlook (Tarrant County) Hauer SSP2
- Today (2025)
- 2,380,417 people
- By 2030
- 2,578,900 · +8.3%
- By 2040
- 2,974,995 · +25.0%
- By 2050
- 3,350,489 · +40.8%
- By 2075
- 4,216,909 · +77.2%
- By 2100
- 4,741,527 · +99.2%
Race, ethnicity, and origin ACS 2023
- Neighborhood character
- Diverse neighborhood (Simpson 0.68)
- Race & ethnicity
- White 48% Black 21% Hispanic / Latino 20% Two or more races 11% Asian 6%
- Hispanic origin (detail)
- Mexican 15% Puerto Rican 2%
- Common ancestry
- Italian 2% Slovak 2% Romanian 1%
- Foreign-born
- 13% · Canada, Vietnam, China
- Languages at home
- 78% English-only · Spanish 12% Vietnamese 2% Other Indo-European 2%
Political lean MEDSL · Tarrant
- 2024 margin
- Lean R (+5.1) · D 46.7% · R 51.9% · Other 1.4%
- 2008→2024 swing
- +6.6pp toward D · 2008: -11.7pp · 2024: -5.1pp
- All cycles
- 2024: R+5.1 2020: D+0.2 2016: R+8.7 2012: R+15.7 2008: R+11.7
Not yet ingested
- Civics
- —
Market trends
- HPI YoY
- ▼ -184.11%
- Current HPI
- 268.3139
- Rent YoY
- ▼ -0.80%
- Metro
- Dallas-Fort Worth-Arlington, TX
- State GDP YoY
- ▲ 3.95%
- F500 in state
- 110
Industry mix (Fortune 500 HQ in TX)
| Industry | F500 HQs | Revenue |
|---|---|---|
| Energy | 16 | $1,198B |
|
||
| Technology | 5 | $198B |
|
||
| Engineering / Construction | 4 | $72B |
|
||
| Energy Services | 3 | $60B |
|
||
| Utilities | 3 | $41B |
|
||
| Healthcare | 2 | $330B |
|
||
Price history
+94.0% since first listed15 events — show timeline
- 2026-05-27 Listed $485,000 NTREIS
- 2016-11-21 Sold (Public Records) — Public Records
- 2016-11-18 Sold (MLS) — NTREIS
- 2016-10-17 Pending — NTREIS
- 2016-10-01 Contingent — NTREIS
- 2016-08-18 Listed $270,000 NTREIS
- 2016-01-06 Pending — NTREIS
- 2015-11-23 Pending — NTREIS
- 2015-11-12 Contingent — NTREIS
- 2015-11-12 Listing Removed — NTREIS
- 2015-10-15 Relisted — NTREIS
- 2015-10-12 Pending — NTREIS
- 2015-10-05 Contingent — NTREIS
- 2015-08-25 Listed $250,000 NTREIS
- 2015-08-25 Listing Removed — NTREIS
Property tax history
+4.2%/yrLatest (2025): $10,516 · +10.1% YoY. Source: county tax records.
Cash-flow waterfall
monthlySold comps — $/sqft
last 12 mo · ≤1 miLoading sold comps…