 Duplex
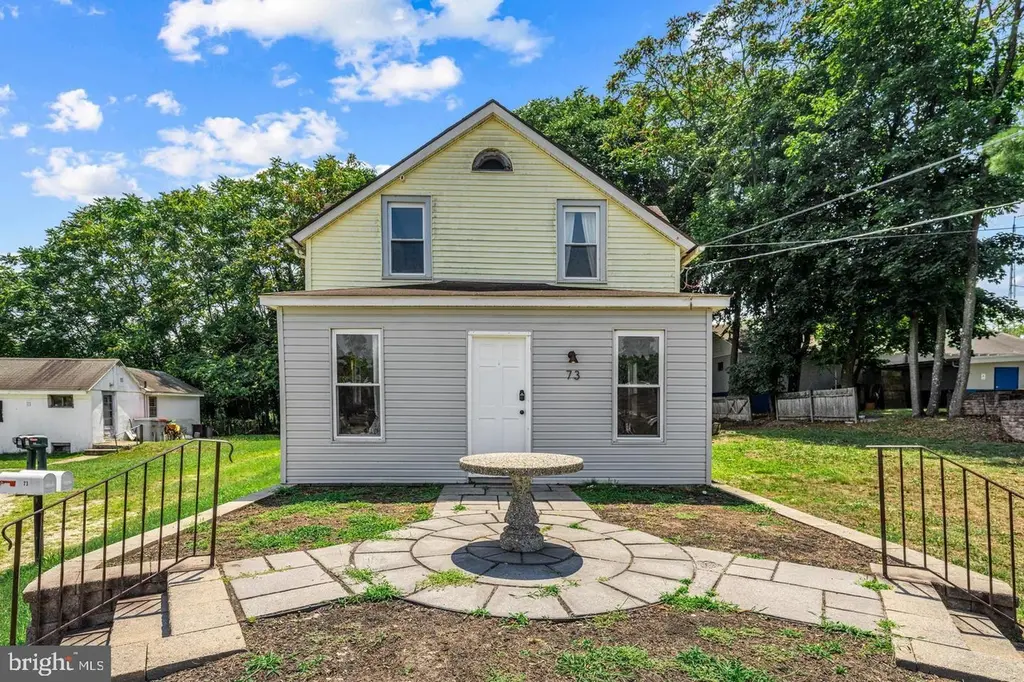
73 W Chestnut Ave · Vineland, NJ
Flood risk 1/10 · Minimal
- FEMA flood zone
- X (unshaded)
- Chance of flooding over 30 yrs
- 0.0%
- Est. flood insurance / yr
- $507 – $1,088
Fire risk 2/10 · Minimal
- Est. fire insurance / yr
- $526 – $976
Heat risk 7/10 · Major
- Hot days now (above 103°F)
- 7 days/yr
- Hot days in 30 yrs
- 15 days/yr
Wind risk 6/10 · Moderate
- Chance of severe wind over 30 yrs
- 67.0%
Air-quality risk 3/10 · Minor
- Unhealthy air days now
- 3 days/yr
- Unhealthy air days in 30 yrs
- 5 days/yr
Risk factors via First Street. Map © Google.
Why this score? — see what drove the C+ grade
The composite is a weighted blend of 9 inputs, each scored 0–100. Each bar is that input's sub-score; the figure is the points it added to the 100-point composite (weight × sub-score).
- Cash flow +26.5/30.0
- DSCR +9.1/10.0
- ARV discount +7.5/15.0
- 1% rule +7.1/10.0
- Condition / age +4.0/5.0
- Livability +3.3/5.0
- Rent growth +2.5/5.0
- Schools +1.9/10.0
- Appreciation +0.0/10.0
$289,900
🖨 Deal sheet (PDF) 📄 Offer letter ✓ Due diligence
Multi-family units
County records classify this as Multi-Family (2-4 Unit). Listing-text estimate: 2 units. confirmed
Listing remarks
🔥 Don’t Miss This Incredible 2-Unit Opportunity! 🔥Located just off Route 55, this versatile multi-unit property offers convenience, value, and amazingly low taxes—a rare find! 🏡 Unit 1 Features: 3 spacious bedrooms 1 full bathroom Dedicated laundry room Large kitchen with ample counter space Brand new range & refrigerator 🏡 Unit 2 Includes: 1 bedroom Bonus room (perfect for office or guest space) 1 full bathroom ✨ Additional Highlights: Two storage sheds (one for each unit) 1-car garage Ideal for extended family living or rental income Whether you're an investor or looking for a multi-generational home, this property checks all the boxes! 📅 Open House: 5-9 from 12-3pm FYI
Key facts
- 0.39 acre lot
- Built 1880
- Listed 47 days
Neighborhood map
What this means for you Summary
Snapshot
- This is a 2 × 2-bed/1.0-bath units multifamily listed at $290k. Condition is rated good.
Deal economics
- At list price, monthly cash flow is $769 ($9k/yr) — positive. Per door: $385/mo.
- The deal already cash-flows at list — no discount required.
- Meets the 1% rule at list price ($4k rent vs $290k).
- Recommended offer: $281k (3.0% below list) — sets the bar for market timing.
- Cap rate 9.5% vs local median 4.5% in Vineland — top-decile yield for the area; either an underpriced asset or a hidden risk that comps aren't pricing in. Stress-test before assuming the spread holds.
Location & tenants
- Location reads 66/100 on livability (#363 in NJ) — a middle-class / working-renter tenant base. Strengths: housing A+, health & safety A+; Watch: employment D+, crime F, amenities F.
- Vineland Public School District (urban): math 9% / reading 34% proficiency, ranked #418 of 472 in NJ (top 89%) — low school quality limits family demand, transient renter base, plan for 1-2y turnover.
- Zoned schools: Dane Barse Elementary School (math 8% / reading 37%, grade F, #944 of 1,303 statewide, top 73%, 219 students, 0% FRL); Thomas W. Wallace Jr. Middle School (math 5% / reading 29%, grade F, #409 of 431 statewide, top 95%, 778 students, 0% FRL); Vineland Senior High School (math 10% / reading 34%, grade F, #346 of 399 statewide, top 88%, 2,780 students, 0% FRL) — zoned schools average 0% FRL vs 53% district-wide (53 pts lower); this property's tenant base skews higher-income than the district average.
- Market conditions: 176 active listings in the ZIP; 216 units permitted in Cumberland County in 2024 (73 in 5+ unit buildings).
- At $3,510/mo this rent would consume 64% of the median local household income ($65k/yr) (locally 1328% of renters already pay >50% of income on rent) — very limited rent-growth headroom before tenants either downsize or default.
Forward outlook
- Local home prices are declining (-3.0%/yr); year-one equity from $2k of loan paydown is wiped out by about $9k of value loss. Plan a longer hold.
- Cumberland County population projected to shrink 7% by 2050 — rents likely to lag national; underwrite the cash flow, not the appreciation.
- At projected returns (-3.0% appreciation + 3.0% rent growth), your $81k cash investment doubles in ~10 years — after that, you're playing with house money.
Negotiation context
- It's been on market 47 days — a 3% lower offer ($281k) is reasonable based on typical stale-listing flexibility.
Risks & watch-outs
- Watch-outs: built in 1880 — expect roof / HVAC / electrical / plumbing capex.
- Climate carrying-cost: major wind risk, 67% chance of damaging wind over 30y; extreme-heat days projected 7→15/yr by 2055 (HVAC capex compounding) — expect insurance premiums to compound above CPI over the hold.
Questions for the listing agent
- It's been on market 47 days. Have you received any prior offers? Is the seller open to a 3% concession, seller financing, or rate buy-down credit?
- Can we see the unit-by-unit rent roll, current vacancy, and any below-market leases? What's the average tenancy length?
- What capital expenditures (roof, boiler, parking lot, exteriors) have been made in the last 5 years, and what's planned in the next 2?
- Built in 1880 — when were the roof, HVAC, electrical panel, plumbing, and water heater last replaced?
- Is there a deadline driving the sale (1031 exchange, divorce, estate, relocation)? That informs how much negotiation room exists.
- Schools are D-rated, which usually means shorter tenancies and higher turnover. Who's the typical renter profile here, and what's been the actual vacancy rate?
- Crime grade is F in this area — have there been break-ins, vandalism, or insurance claims at this property in the last 3 years? What carrier currently insures it and at what premium?
- What's the average days-on-market for RENTAL listings here right now (not sales)? A rising rental-DOM trend means longer vacancies and softer asking-rent achievability than the comps imply.
- What's the recent tenant-quality profile in this submarket — average credit score on applications, eviction rate, late-payment / NSF rate, and stable-employment percentage? A property-management company in the area should have these aggregated.
- How much new apartment / multifamily construction is in the pipeline within 1–3 miles? Heavy new supply (>2% of stock underway) typically softens rents 12–24 months out; light construction supports rent growth.
Investment metrics
- 1% rule
- 1.21% ✓
- Cap rate
- 9.48%
- Cash-on-cash
- 11.38%
- DSCR
- 1.51
- GRM
- 6.9
CMA / ARV
No comps found within radius.
Projected returns pro-forma
-3.0% appreciation · 3.0% rent growth · sell at horizon
- IRR
- 0.7%
- Equity multiple
- 1.03×
- Total profit
- $2,084
- Equity at exit
- $43,225
- IRR
- 10.3%
- Equity multiple
- 1.80×
- Total profit
- $65,136
- Equity at exit
- $25,065
Cash invested: $81,172 (down + closing). Projections, not guarantees.
Landlord ↔ Tenant lean methodology
- Overall (STATE)
- 21 Tenant-Leaning
- State New Jersey
- 21 Tenant-Leaning · D+6
- County
- — inherits STATE
- City
- — inherits STATE
ZIP-level market 08360
- Active inventory
- 176
- Price-to-rent
- 13.8×
Monthly cashflow live
- Estimated rent
- $3,510 medium interval (Pro) →
- Mortgage (P&I)
- −$1,520
- Tax est. 1.5%
- −$362 /mo · $4,348/yr
- Insurance
- −$121
- HOA
- −$0
- Vacancy / Maint / Mgmt
- −$737
- Net cashflow
- $769
Break-even live
Sensitivity live
| Price | -10% $970 | -5% $870 | +0% $769 | +5% $669 | +10% $569 |
|---|---|---|---|---|---|
| Rent | -10% $492 | -5% $631 | +0% $769 | +5% $908 | +10% $1,047 |
| Rate | -1.0pp $915 | -0.5pp $843 | base $769 | +0.5pp $694 | +1.0pp $618 |
2-unit breakdown (identical units grouped — click to expand)
| Units | Beds | Baths | Est. rent |
|---|---|---|---|
| 2× units | 2 | 1 | $3,510 |
| #1 | 2 | 1 | $1,755 |
| #2 | 2 | 1 | $1,755 |
| Total (2 units) | $3,510 | ||
UW: 25.0% down · 7.5% · 30yr · 1.5% tax · 5.0% vac · 8.0% maint · 8.0% mgmt
Financing live
Cash to close
- Down payment
- $72,475
- Closing costs
- $8,697
- Reserves months
- —
- Total cash needed
- —
Loan-product check · same deal, 3 products live
Conventional
25% down · 7.5% · 30yr
- Down + closing
- —
- Monthly P&I
- —
- Monthly cashflow
- —
- DSCR
- —
- Eligible?
- —
Personal DTI + credit; lowest rate.
DSCR
20% down · 8.5% · 30yr
- Down + closing
- —
- Monthly P&I
- —
- Monthly cashflow
- —
- DSCR
- —
- Eligible?
- —
No personal income docs; deal must DSCR.
Hard money
10% down · 12.0% · 12mo
- Down + closing
- —
- Monthly P&I
- —
- Monthly cashflow
- —
- DSCR
- —
- Eligible?
- —
Short-term bridge; refi at stabilization.
Listing history 5 events
-
2026-06-02status $289,900 Pending 47 DOM
-
2026-05-23historical Active Under Contract
-
2026-05-08price $289,900
-
2026-04-06$299,900 Active
-
2026-03-30historical $299,900
ⓘ Source: listings_history table (triggers on properties + properties_extension) + one-shot
backfill from property_details.listing_events for pre-trigger history.
Climate risk First Street
- Flood 1/10 Low FEMA zone X (unshaded) · 0% chance over 30 yrs
- Wildfire 2/10 Low
- Heat 7/10 Severe 7 d/yr ≥103°F today · 15 d/yr by 30 yrs out
- Wind 6/10 Major 67% chance of damaging wind over 30 yrs
- Air quality 3/10 Moderate 3 unhealthy d/yr today · 5 by 30 yrs out
Nearby sold comps map
Loading sold comps map…
Walkable amenities ~0.75 mi
Loading nearby amenities…
Taxation est. · year 1
- Rental income
- $42,120
- − Mortgage interest
- −$16,239
- − Property taxes
- −$4,348
- − Insurance
- −$1,450
- − Repairs & maintenance
- −$3,370
- − Management
- −$3,370
- − Depreciation
- −$8,433
- Taxable income
- $4,910
- Est. tax owed @ 24.0%
- −$1,179
- After-tax cash flow
- $8,055/yr
For passive investors: Depreciation is non-cash, so a rental often shows a tax loss while cash-flowing — sheltering income. Rental losses are passive: they offset passive income freely, and up to $25,000/yr can offset ordinary (W-2) income if you actively participate and your MAGI is under $100k (phasing out to $0 by $150k); unused losses carry forward. On sale, claimed depreciation is recaptured at up to 25%, and gains may owe capital-gains tax (a 1031 exchange can defer both). Figures are a year-1 estimate at your 24.0% rate — not tax advice; consult a CPA.
Condition & rehab AI · 13 photos
This multi-family property is in good condition with recent updates, making it a solid investment opportunity. The exterior could benefit from a fresh coat of paint to enhance its curb appeal.
Value-add opportunities
- Resale Painting the exterior — Enhances curb appeal and can increase the home's value
- Rental Landscaping and trimming the bushes — Improves the property's aesthetic and can attract renters
- Both Inspecting and cleaning the gutters — Prevents water damage and ensures proper drainage, which is beneficial for both resale and rental
Renovation cost estimate screening
Value-add ROI direction
- Resale Painting the exterior — Enhances curb appeal and can increase the home's value ↑
- Rental Landscaping and trimming the bushes — Improves the property's aesthetic and can attract renters ↑
- Both Inspecting and cleaning the gutters — Prevents water damage and ensures proper drainage, which is beneficial for both resale and rental ↑
ⓘ Cost ranges are severity-bucket heuristics (US national rule-of-thumb). Get contractor quotes + a written scope before underwriting a rehab budget.
Schools (NCES district)
- District
- Vineland Public School District
- NCES district ID
- 3416800
- Math proficiency
- 9% ▼ -17.00%
- Reading proficiency
- 34% ▬ 0.00%
- Median HH income
- $51,168
- Composite
- 19.17/100
- National rank
- #8819
- State rank
- #418 of 472 in NJ
Livability — Vineland
- Score
- 66/100
- State rank
- #363
- US rank
- #12180
Category grades
Schools grade is shown separately in the Schools card above.
Census & demographics
- Census place
- Vineland, NJ
- County
- Cumberland County · 80,266 people
- City population
- 45,038
- Metro
- Vineland-Bridgeton, NJ
- Population (ZIP)
- 45,038
- Household income
- $65,359
- Rent vs Own
- Severe rent burden
- 1328.0
Population outlook (Cumberland County) Hauer SSP2
- Today (2025)
- 152,743 people
- By 2030
- 150,373 · -1.6%
- By 2040
- 146,881 · -3.8%
- By 2050
- 142,653 · -6.6%
- By 2075
- 129,468 · -15.2%
- By 2100
- 107,456 · -29.6%
Race, ethnicity, and origin ACS 2023
- Neighborhood character
- Diverse neighborhood (Simpson 0.62)
- Race & ethnicity
- Hispanic / Latino 51% White 32% Two or more races 17% Black 11% Asian 1%
- Hispanic origin (detail)
- Mexican 11% Puerto Rican 33% Dominican 2%
- Common ancestry
- Romanian 2% Subsaharan African 1% Scotch-Irish 1%
- Foreign-born
- 14% · Canada, Jamaica
- Languages at home
- 59% English-only · Spanish 37% Russian/Polish/Slavic 2% Other Indo-European 1%
Political lean MEDSL · Cumberland
- 2024 margin
- Toss-up / Even · D 47.6% · R 51.3% · Other 1.1%
- 2008→2024 swing
- -25.4pp toward R · 2008: 21.6pp · 2024: -3.8pp
- All cycles
- 2024: R+3.8 2020: D+6.0 2016: D+5.3 2012: D+23.1 2008: D+21.6
Not yet ingested
- Civics
- —
Market trends
- HPI YoY
- ▼ -320.06%
- Current HPI
- 278.786
- Rent YoY
- —
- Metro
- Vineland-Bridgeton, NJ
- State GDP YoY
- ▲ 2.05%
- F500 in state
- 34
Industry mix (Fortune 500 HQ in NJ)
| Industry | F500 HQs | Revenue |
|---|---|---|
| Consumer Goods | 3 | $31B |
|
||
| Pharmaceuticals | 2 | $153B |
|
||
| Technology | 2 | $21B |
|
||
| Insurance | 2 | $20B |
|
||
| Healthcare | 2 | $19B |
|
||
| Financial Services | 1 | $70B |
|
||
Price history
-3.3% since first listed4 events — show timeline
- 2026-05-23 Contingent — BRIGHT MLS
- 2026-05-08 Price Changed $289,900 BRIGHT MLS
- 2026-04-06 Listed $299,900 BRIGHT MLS
- 2026-03-30 Coming Soon $299,900 BRIGHT MLS
Cash-flow waterfall
monthlySold comps — $/sqft
last 12 mo · ≤1 miLoading sold comps…