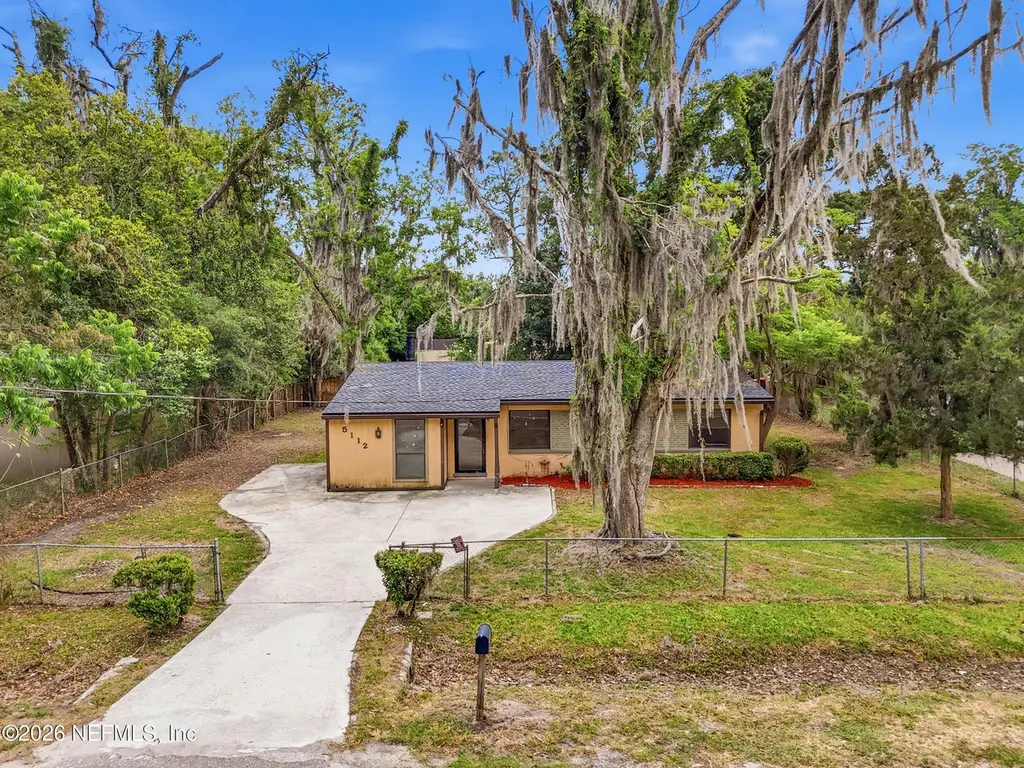
5112 110th St · Jacksonville, FL
Flood risk 3/10 · Minor
- FEMA flood zone
- X (unshaded)
- Chance of flooding over 30 yrs
- 0.12%
- Est. flood insurance / yr
- $507 – $1,088
Fire risk 3/10 · Minor
- Est. fire insurance / yr
- $947 – $1,759
Heat risk 8/10 · Major
- Hot days now (above 107°F)
- 7 days/yr
- Hot days in 30 yrs
- 20 days/yr
Wind risk 10/10 · Severe
- Chance of severe wind over 30 yrs
- 99.0%
Air-quality risk 3/10 · Minor
- Unhealthy air days now
- 3 days/yr
- Unhealthy air days in 30 yrs
- 3 days/yr
Risk factors via First Street. Map © Google.
Why this score? — see what drove the C grade
The composite is a weighted blend of 9 inputs, each scored 0–100. Each bar is that input's sub-score; the figure is the points it added to the 100-point composite (weight × sub-score).
- Cash flow +18.4/30.0
- ARV discount +15.0/15.0
- DSCR +5.8/10.0
- 1% rule +5.2/10.0
- Livability +4.2/5.0
- Schools +3.9/10.0
- Rent growth +3.1/5.0
- Condition / age +2.5/5.0
- Appreciation +0.0/10.0
$164,900
🖨 Deal sheet 📄 Offer letter ✓ Due diligence
Listing remarks MLS
Concrete block affordable 3 bedroom 1 bath home in the heart of Venetia! Featuring a fenced yard and covered patio this home is located close to parks, public boating access and shopping! Take a close look at this home before its too late.
Key facts
- Practical kitchen
- Functional layout
- Covered patio area
Tags
Property features AI
Finance
- Other: Property currently used as residential
- HOA & community: Not a senior community
Exterior
- Parking: Off-street parking
- Utilities: Public sewer; Electricity connected; Sewer connected; Water connected
- Home design: Single family residence; Entry level: 1
- Construction: Block construction; Shingle roof
- Exterior features: Fenced yard with chain link fencing; Few trees and wooded lot; City street frontage; Asphalt road surface
Interior
- Kitchen: Electric range; Refrigerator
- Bedrooms: 4 bedrooms
- Flooring: Tile
- Bathrooms: 1 full bathroom
- Heating & cooling: Central heating; Electric heating; Heat pump; Central air conditioning; Electric cooling
- Interior features: One fireplace; Tile flooring; Rear porch
- Laundry & utility: Washer hookup; Electric dryer hookup
Neighborhood map
What this means for you Summary
Snapshot
- This is a 3-bed/1.0-bath single-family listed at $165k.
Deal economics
- At list price, monthly cash flow is $153 ($2k/yr) — positive.
- The deal already cash-flows at list — no discount required.
- Meets the 1% rule at list price ($2k rent vs $165k).
- Cap rate 7.4% vs local median 4.0% in Jacksonville — top-decile yield for the area; either an underpriced asset or a hidden risk that comps aren't pricing in. Stress-test before assuming the spread holds.
Location & tenants
- Location reads 83/100 on livability (#50 in FL, #911 nationally) — a professional / high-income tenant draw. Strengths: amenities A+, commute A+, housing A+.
- Duval (urban): math 46% / reading 45% proficiency, ranked #48 of 73 in FL (top 66%) — families likely to look elsewhere, expect single-tenant / working-renter base with shorter leases.
- Zoned schools: Timucuan Elementary School (math 34% / reading 22%, grade F, #1,951 of 2,144 statewide, top 91%, 491 students, 77% FRL); Lake Shore Middle School (math 25% / reading 22%, grade F, #536 of 571 statewide, top 95%, 972 students, 75% FRL); Westside High School (math 26% / reading 19%, grade F, #539 of 667 statewide, top 81%, 1,583 students, 63% FRL) — zoned schools average 72% FRL vs 49% district-wide (23 pts higher); higher-poverty schools than district average — tighter screening recommended.
- Zoned-school proficiency averages 25% at this address vs 46% district-wide (-21 pts) — the specific schools serving this property underperform the Duval average; the district grade overstates school quality for this exact location.
- Market conditions: Rents rising (+2.2%/yr); 349 active listings in the ZIP; 20 comparable units currently listed for rent nearby; rentals leasing fast (median 10d on market — plan ~1-2 weeks tenant-placement turnaround); 6,503 units permitted in Duval County in 2024 (1,131 in 5+ unit buildings).
- This rent runs 32% of the median local income ($62k/yr) — at the standard rent-burdened threshold; future hikes will face affordability resistance.
Forward outlook
- Local home prices are declining (-3.0%/yr); year-one equity from $1k of loan paydown is wiped out by about $5k of value loss. Plan a longer hold.
- Duval County population projected at +19% by 2050 — long-run rental-demand tailwind backs the buy-and-hold thesis.
Negotiation context
- Only 4 days on market — expect competitive offers; lowballing is unlikely to land.
- 6 sale attempts since 25y ago with the ask held roughly flat each time — persistent listings suggest the price (not the market) is what's stuck; bring a comps-based counter.
- Current owner paid $40k; list at $165k implies a 307% gain — meaningful room to come down on a strong offer.
Risks & watch-outs
- Watch-outs: built in 1952 — expect roof / HVAC / electrical / plumbing capex.
- Climate carrying-cost: severe wind risk, 99% chance of damaging wind over 30y; extreme-heat days projected 7→20/yr by 2055 (HVAC capex compounding) — expect insurance premiums to compound above CPI over the hold.
Questions for the listing agent
- Built in 1952 — when were the roof, HVAC, electrical panel, plumbing, and water heater last replaced?
- Is there a deadline driving the sale (1031 exchange, divorce, estate, relocation)? That informs how much negotiation room exists.
- Schools are B-rated — typically a magnet for longer-tenancy family renters. What's the average tenant stay here, and is there a school-zone premium baked into asking?
- What's the average days-on-market for RENTAL listings here right now (not sales)? A rising rental-DOM trend means longer vacancies and softer asking-rent achievability than the comps imply.
- What's the recent tenant-quality profile in this submarket — average credit score on applications, eviction rate, late-payment / NSF rate, and stable-employment percentage? A property-management company in the area should have these aggregated.
- How much new for-sale + rental construction is in the pipeline within 1–3 miles? Heavy new supply typically softens prices + rents 12–24 months out; constrained supply supports both.
Investment metrics
- 1% rule
- 1.02% ✓
- Cap rate
- 7.41%
- Cash-on-cash
- 3.99%
- DSCR
- 1.18
- GRM
- 8.2
CMA / ARV
- ARV (on-the-fly)
- $273,402
- Comps found
- 12
Show comp detail 12 sales within ~0.75 mi
| Address | Dist | Beds/Ba | Sqft | Sold | Price | $/sf | Match |
|---|---|---|---|---|---|---|---|
| 5112 110th St | 0.00mi | 4/1.0 (+1) | 1,494 (0%) | 1mo | $140,000 | $94 | 94 |
| 5942 Broken Arrow Dr W | 0.21mi | 4/2.0 (+1) | 1,530 (+2%) | 2mo | $280,000 | $183 | 75 |
| 5917 Ortega River Ct | 0.13mi | 3/2.0 | 1,636 (+10%) | 1mo | $300,000 | $183 | 74 |
| 5242 Helm Ave | 0.42mi | 3/2.0 | 1,455 (-3%) | 0mo | $214,000 | $147 | 72 |
| 5302 Tequesta Ct | 0.39mi | 4/2.0 (+1) | 1,519 (+2%) | 1mo | $200,000 | $132 | 69 |
| 6343 Alfredo Ct | 0.45mi | 3/2.0 | 1,510 (+1%) | 5mo | $240,000 | $159 | 69 |
| 5416 Rosedale Ln | 0.54mi | 3/2.0 | 1,499 (+0%) | 1mo | $287,000 | $191 | 69 |
| 5904 Ortega Farms Blvd | 0.13mi | 4/3.0 (+1) | 1,560 (+4%) | 9mo | $270,000 | $173 | 67 |
| 6226 W Pennant Dr W | 0.41mi | 4/2.0 (+1) | 1,437 (-4%) | 5mo | $272,000 | $189 | 61 |
| 5456 Timuquana Rd | 0.75mi | 3/1.5 | 1,529 (+2%) | 2mo | $170,000 | $111 | 58 |
| 5864 Calvary Dr | 0.66mi | 3/2.0 | 1,395 (-7%) | 2mo | $260,000 | $186 | 52 |
| 6254 Alfredo Dr W | 0.37mi | 3/2.0 | 1,278 (-14%) | 9mo | $235,000 | $184 | 47 |
Match score weights: distance 35% · size 25% · config 20% · recency 20%. Top-matched comps best support the ARV.
Projected returns pro-forma
-3.0% appreciation · 2.25% rent growth · sell at horizon
- IRR
- -10.9%
- Equity multiple
- 0.61×
- Total profit
- $-18,163
- Equity at exit
- $24,587
- IRR
- -2.7%
- Equity multiple
- 0.82×
- Total profit
- $-8,132
- Equity at exit
- $14,258
Cash invested: $46,172 (down + closing). Projections, not guarantees.
Landlord ↔ Tenant lean methodology
- Overall (STATE)
- 87 Strongly Landlord-Friendly
- State Florida
- 87 Strongly Landlord-Friendly · R+3
- County
- — inherits STATE
- City
- — inherits STATE
ZIP-level market 32244
- Home prices YoY
- -17.8%
- Rents YoY
- 2.2%
- Active inventory
- 349
- Price-to-rent
- 8.2×
Monthly cashflow live
- Estimated rent
- $1,678 high interval (Pro) →
- Mortgage (P&I)
- −$865
- Tax from tax record
- −$239 /mo · $2,869/yr
- Insurance
- −$69
- HOA
- −$0
- Vacancy / Maint / Mgmt
- −$352
- Net cashflow
- $153
Break-even live
UW: 25.0% down · 7.5% · 30yr · 1.5% tax · 5.0% vac · 8.0% maint · 8.0% mgmt
Financing live
Cash to close
- Down payment
- $41,225
- Closing costs
- $4,947
- Reserves months
- —
- Total cash needed
- —
Loan-product check · same deal, 3 products live
Conventional
25% down · 7.5% · 30yr
- Down + closing
- —
- Monthly P&I
- —
- Monthly cashflow
- —
- DSCR
- —
- Eligible?
- —
Personal DTI + credit; lowest rate.
DSCR
20% down · 8.5% · 30yr
- Down + closing
- —
- Monthly P&I
- —
- Monthly cashflow
- —
- DSCR
- —
- Eligible?
- —
No personal income docs; deal must DSCR.
Hard money
10% down · 12.0% · 12mo
- Down + closing
- —
- Monthly P&I
- —
- Monthly cashflow
- —
- DSCR
- —
- Eligible?
- —
Short-term bridge; refi at stabilization.
Rent comps 20 comps
| Address | Beds | Baths | Sqft | Rent | $/sqft | DOM | Units | Dist |
|---|---|---|---|---|---|---|---|---|
| 5939 Pueblo Ct Jacksonville, FL | 4.0 | 2.0 | 1288 | $1,495 | $1.16 | 7d | 1 | 0.05mi |
| 6221 Alfredo Dr W Jacksonville, FL | 3.0 | 2.0 | 1133 | $1,710 | $1.51 | 3d | 1 | 0.33mi |
| 5375 Ortega Farms Blvd #715 Jacksonville, FL | 2.0 | 2.0 | 1016 | $1,700 | $1.67 | 23d | 1 | 0.51mi |
| 5327 Timuquana Rd Jacksonville, FL | 1.0–3.0 | 1.0–2.0 | 950 | $1,599 | $1.68 | 1d | 27 | 0.66mi |
| 5685 Marathon Pkwy Jacksonville, FL | 2.0 | 2.0 | 1015 | $1,000 | $0.99 | 19d | 1 | 0.78mi |
| 5558 Bennington Dr Jacksonville, FL | 2.0 | 2.0 | 988 | $1,275 | $1.29 | 4d | 1 | 0.82mi |
| 5626 Bryner Dr Jacksonville, FL | 2.0 | 3.0 | 1404 | $1,320 | $0.94 | 21d | 1 | 0.91mi |
| 5058 Acre Estates Dr W Jacksonville, FL | 3.0 | 2.0 | 1402 | $1,825 | $1.30 | 2d | 1 | 0.92mi |
| 5640 Bryner Dr Jacksonville, FL | 2.0 | 2.0 | 1000 | $1,260 | $1.26 | 23d | 1 | 0.94mi |
| 5642 Bryner Dr Jacksonville, FL | 2.0 | 1.5 | 1406 | $1,290 | $0.92 | 21d | 1 | 0.94mi |
| 4800 Ortega Farms Blvd Jacksonville, FL | 1.0–3.0 | 1.0 | 880 | $1,465 | $1.66 | 10d | 9 | 1.04mi |
| 4800 Ortega Farms Blvd Jacksonville, FL | 1.0–3.0 | 1.0 | 880 | $1,435 | $1.63 | 2d | 10 | 1.04mi |
| 5664 Minocqua St Jacksonville, FL | 4.0 | 1.5 | 1023 | $1,545 | $1.51 | 3d | 1 | 1.09mi |
| 6017 Roosevelt Blvd Jacksonville, FL | 1.0–3.0 | 1.0–2.0 | 897 | $1,599 | $1.78 | 3d | 24 | 1.17mi |
| 5639 Bullseye Cir Jacksonville, FL | 3.0 | 2.0 | 1574 | $1,825 | $1.16 | 23d | 1 | 1.33mi |
| 5054 Pirates Cove Rd Jacksonville, FL | 3.0 | 2.5 | 1754 | $2,600 | $1.48 | 2d | 1 | 1.41mi |
| 4690 Homestead Rd Jacksonville, FL | 2.0 | 2.0 | 1641 | $2,200 | $1.34 | 11d | 1 | 1.49mi |
| 5958 Creekside Crossing Dr Jacksonville, FL | 3.0 | 2.5 | 1404 | $1,895 | $1.35 | 10d | 1 | 1.49mi |
| 5988 Creekside Crossing Dr Jacksonville, FL | 3.0 | 2.5 | 1404 | $1,850 | $1.32 | 14d | 1 | 1.50mi |
| 5984 Creekside Crossing Dr Jacksonville, FL | 3.0 | 2.5 | 1404 | $1,695 | $1.21 | 14d | 1 | 1.50mi |
Listing history 19 events
-
2026-05-05status Pending
-
2026-04-30$164,900 Active
-
2024-04-18historical $1,400
-
2024-04-10$1,400
-
2024-04-10historical $1,400
-
2024-03-26price $1,400
-
2024-03-13$1,500
-
2015-05-29soldstatus $40,500 Sold 240-char remark
Show marketing remark (240 chars)
Concrete block affordable 3 bedroom 1 bath home in the heart of Venetia! Featuring a fenced yard and covered patio this home is located close to parks, public boating access and shopping! Take a close look at this home before its too late.
-
2015-05-08status Pending 240-char remark
Show marketing remark (240 chars)
Concrete block affordable 3 bedroom 1 bath home in the heart of Venetia! Featuring a fenced yard and covered patio this home is located close to parks, public boating access and shopping! Take a close look at this home before its too late.
-
2015-04-22$57,300 Active - Auction 240-char remark
Show marketing remark (240 chars)
Concrete block affordable 3 bedroom 1 bath home in the heart of Venetia! Featuring a fenced yard and covered patio this home is located close to parks, public boating access and shopping! Take a close look at this home before its too late.
-
2015-04-22price $40,700 240-char remark
Show marketing remark (240 chars)
Concrete block affordable 3 bedroom 1 bath home in the heart of Venetia! Featuring a fenced yard and covered patio this home is located close to parks, public boating access and shopping! Take a close look at this home before its too late.
-
2006-07-12soldstatus $120,000
-
2004-02-01historical
-
2003-10-16$63,000
-
2001-10-01soldstatus $77,000
-
2001-09-24soldstatus $77,000
-
2001-07-12$77,000
-
1990-08-01soldstatus $41,500
-
1983-11-01soldstatus $40,000
ⓘ Source: listings_history table (triggers on properties + properties_extension) + one-shot
backfill from property_details.listing_events for pre-trigger history.
Tax reassessment forecast FL · Resets to sale price
- Current annual tax
- $2,869 · $239/mo
- Projected year-2 tax
- $2,869 · $239/mo
- Expected delta
- $0/yr ($0/mo · 0.0%)
ⓘ Screening estimate from a state-policy table — verify with the county assessor before closing.
Climate risk First Street
- Flood 3/10 Moderate FEMA zone X (unshaded) · 12% chance over 30 yrs
- Wildfire 3/10 Moderate
- Heat 8/10 Severe 7 d/yr ≥107°F today · 20 d/yr by 30 yrs out
- Wind 10/10 Extreme 99% chance of damaging wind over 30 yrs
- Air quality 3/10 Moderate 3 unhealthy d/yr today · 3 by 30 yrs out
Nearby sold comps map
Loading sold comps map…
Walkable amenities ~0.75 mi
Loading nearby amenities…
Taxation est. · year 1
- Rental income
- $20,141
- − Mortgage interest
- −$9,237
- − Property taxes
- −$2,869
- − Insurance
- −$824
- − Repairs & maintenance
- −$1,611
- − Management
- −$1,611
- − Depreciation
- −$4,797
- Taxable loss
- −$809
- Est. tax savings @ 24.0%
- +$194
- After-tax cash flow
- $2,035/yr
For passive investors: Depreciation is non-cash, so a rental often shows a tax loss while cash-flowing — sheltering income. Rental losses are passive: they offset passive income freely, and up to $25,000/yr can offset ordinary (W-2) income if you actively participate and your MAGI is under $100k (phasing out to $0 by $150k); unused losses carry forward. On sale, claimed depreciation is recaptured at up to 25%, and gains may owe capital-gains tax (a 1031 exchange can defer both). Figures are a year-1 estimate at your 24.0% rate — not tax advice; consult a CPA.
Schools (NCES district)
- District
- Duval
- NCES district ID
- 1200480
- Math proficiency
- 46% ▼ -11.00%
- Reading proficiency
- 45% ▼ -4.00%
- Median HH income
- $48,987
- Composite
- 38.97/100
- National rank
- #4076
- State rank
- #48 of 73 in FL
Livability — Jacksonville
- Score
- 83/100
- State rank
- #50
- US rank
- #911
Category grades
Schools grade is shown separately in the Schools card above.
Census & demographics
- Census place
- Jacksonville, FL
- County
- Duval County · 1,015,274 people
- City population
- 979,034
- Metro
- Jacksonville, FL
- Population (ZIP)
- 63,592
- Household income
- $62,204
- Rent vs Own
- Severe rent burden
- 2799.0
Population outlook (Duval County) Hauer SSP2
- Today (2025)
- 1,013,010 people
- By 2030
- 1,059,228 · +4.6%
- By 2040
- 1,141,439 · +12.7%
- By 2050
- 1,205,258 · +19.0%
- By 2075
- 1,324,282 · +30.7%
- By 2100
- 1,319,620 · +30.3%
Race, ethnicity, and origin ACS 2023
- Neighborhood character
- Highly diverse neighborhood (Simpson 0.70)
- Race & ethnicity
- White 39% Black 35% Hispanic / Latino 15% Two or more races 10% Asian 6%
- Hispanic origin (detail)
- Mexican 3% Puerto Rican 6% Cuban 3%
- Common ancestry
- Hispanic 1% Lithuanian 1% Romanian 1%
- Foreign-born
- 12% · Canada, Vietnam, China
- Languages at home
- 83% English-only · Spanish 9% Tagalog/Filipino 3% French/Haitian/Cajun 2%
Political lean MEDSL · Duval
- 2024 margin
- Toss-up / Even · D 48.7% · R 50.1% · Other 1.2%
- 2008→2024 swing
- +0.4pp no change · 2008: -1.9pp · 2024: -1.5pp
- All cycles
- 2024: R+1.5 2020: D+3.8 2016: R+1.5 2012: R+3.6 2008: R+1.9
Not yet ingested
- Civics
- —
Market trends
- HPI YoY
- ▼ -64.22%
- Current HPI
- 296.5375
- Rent YoY
- ▲ 2.25%
- Metro
- Jacksonville, FL
- State GDP YoY
- ▲ 3.28%
- F500 in state
- 36
Industry mix (Fortune 500 HQ in FL)
| Industry | F500 HQs | Revenue |
|---|---|---|
| Industrial Technology | 2 | $29B |
|
||
| Insurance | 2 | $17B |
|
||
| Retail | 1 | $60B |
|
||
| Technology Distribution | 1 | $58B |
|
||
| Homebuilding | 1 | $35B |
|
||
| Technology Manufacturing | 1 | $35B |
|
||
Price history
+312.2% since first listed19 events — show timeline
- 2026-05-05 Pending — realMLS
- 2026-04-30 Listed $164,900 realMLS
- 2024-04-18 Rental Removed $1,400 APPFOLIO
- 2024-04-10 Listed for Rent $1,400 APPFOLIO
- 2024-04-10 Rental Removed $1,400 APPFOLIO
- 2024-03-26 Price Changed $1,400 APPFOLIO
- 2024-03-13 Listed for Rent $1,500 APPFOLIO
- 2015-05-29 Sold (MLS) $40,500 realMLS
- 2015-05-08 Pending — realMLS
- 2015-04-22 Listed $57,300 realMLS
- 2015-04-22 Price Changed $40,700 realMLS
- 2006-07-12 Sold (Public Records) $120,000 Public Records
- 2004-02-01 Listing Removed — realMLS
- 2003-10-16 Listed $63,000 realMLS
- 2001-10-01 Sold (Public Records) $77,000 Public Records
- 2001-09-24 Sold (MLS) $77,000 realMLS
- 2001-07-12 Listed $77,000 realMLS
- 1990-08-01 Sold (Public Records) $41,500 Public Records
- 1983-11-01 Sold (Public Records) $40,000 Public Records
Property tax history
+15.8%/yrLatest (2025): $2,869 · +12.4% YoY. Source: county tax records.
Cash-flow waterfall
monthlySold comps — $/sqft
last 12 mo · ≤1 miLoading sold comps…