9151 Us-60 · Salt Lick, KY
Flood risk 9/10 · Severe
- FEMA flood zone
- A
- Chance of flooding over 30 yrs
- 0.99%
- Est. flood insurance / yr
- $1,009 – $1,996
Fire risk 4/10 · Minor
- Est. fire insurance / yr
- $839 – $1,559
Heat risk 4/10 · Minor
- Hot days now (above 102°F)
- 7 days/yr
- Hot days in 30 yrs
- 19 days/yr
Wind risk 4/10 · Minor
- Chance of severe wind over 30 yrs
- 5.0%
Air-quality risk 2/10 · Minimal
- Unhealthy air days now
- 0 days/yr
- Unhealthy air days in 30 yrs
- 1 days/yr
Risk factors via First Street. Map © Google.
Why this score? — see what drove the D+ grade
The composite is a weighted blend of 9 inputs, each scored 0–100. Each bar is that input's sub-score; the figure is the points it added to the 100-point composite (weight × sub-score).
- Cash flow +15.0/30.0
- ARV discount +7.5/15.0
- 1% rule +5.0/10.0
- DSCR +5.0/10.0
- Appreciation +3.7/10.0
- Livability +2.8/5.0
- Rent growth +2.5/5.0
- Condition / age +2.5/5.0
- Schools +2.2/10.0
$19,900
🖨 Deal sheet (PDF) 📄 Offer letter ✓ Due diligence
Listing remarks
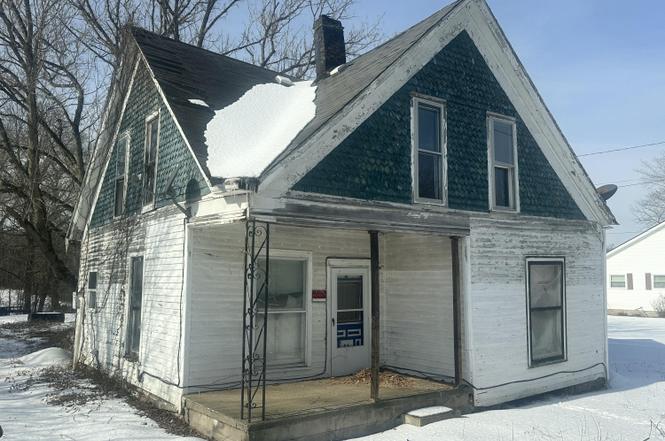
Unlivable house on a 0.2 acre +- lot located within the city limits of Salt Lick.
Key facts
- 8,712 sq ft lot
- Built 1915
- Listed 136 days
Property features AI
Exterior
- Parking: Off-street parking
- Utilities: Public sewer; Electricity available; Sewer available; Water available
- Home design: One and one-half stories
- Construction: Vinyl siding; Wood siding; Stone foundation; 1,484 total building area
- Exterior features: Shed(s) on property; Public water available; Not on waterfront
Interior
- Flooring: Wood
- Bathrooms: 1 full bathroom; 1 half bathroom
- Interior features: Wood flooring; 8 total rooms; No fireplace
Neighborhood map
What this means for you Summary
Snapshot
- This is a 3-bed/1.0-bath single-family listed at $20k.
Deal economics
- At list price, monthly cash flow is $638 ($8k/yr) — positive.
- The deal already cash-flows at list — no discount required.
- Meets the 1% rule at list price ($1k rent vs $20k).
- Recommended offer: $18k (12.0% below list) — sets the bar for market timing.
Location & tenants
- Location reads 56/100 on livability (#453 in KY) — a working-class tenant base; expect higher turnover. Strengths: cost of living A+, housing B+; Watch: health & safety D+, amenities F, commute F.
- Bath County (rural): math 19% / reading 34% proficiency, ranked #139 of 165 in KY (top 84%) — low school quality limits family demand, transient renter base, plan for 1-2y turnover.
- Zoned schools: Crossroads Elementary School (math 27% / reading 37%, grade F, #348 of 676 statewide, top 55%, 395 students, 80% FRL); Bath County Middle School (math 16% / reading 33%, grade F, #189 of 217 statewide, top 89%, 416 students, 78% FRL); Bath County High School (math 32% / reading 37%, grade F, #76 of 254 statewide, top 34%, 618 students, 77% FRL) — zoned schools average 78% FRL vs 60% district-wide (19 pts higher); higher-poverty schools than district average — tighter screening recommended.
- Market conditions: 17 active listings in the ZIP.
Forward outlook
- Local home prices are declining (-2.6%/yr); year-one equity from $138 of loan paydown is wiped out by about $522 of value loss. Plan a longer hold.
- Bath County population projected at +21% by 2050 — long-run rental-demand tailwind backs the buy-and-hold thesis.
- At projected returns (-2.6% appreciation + 3.0% rent growth), your $6k cash investment doubles in ~1 year — after that, you're playing with house money.
Negotiation context
- It's been on market 137 days — a 12% lower offer ($18k) is reasonable based on typical stale-listing flexibility.
Risks & watch-outs
- Watch-outs: property tax is 2.8% of price; flood insurance adds $125/mo; built in 1915 — expect roof / HVAC / electrical / plumbing capex.
- Climate carrying-cost: in FEMA flood zone A (mandatory federal flood insurance) — expect insurance premiums to compound above CPI over the hold.
Questions for the listing agent
- It's been on market 137 days. Have you received any prior offers? Is the seller open to a 12% concession, seller financing, or rate buy-down credit?
- Built in 1915 — when were the roof, HVAC, electrical panel, plumbing, and water heater last replaced?
- Property tax is high relative to price — has the assessment been appealed recently, and will the sale trigger a re-assessment?
- What's the actual annual flood-insurance premium (NFIP or private), and is the property in a SFHA with mandatory coverage?
- Why hasn't it sold? Are there any deal-killer items the seller is aware of (foundation, flood, title, zoning, code violations)?
- Is there a deadline driving the sale (1031 exchange, divorce, estate, relocation)? That informs how much negotiation room exists.
- Schools are F-rated, which usually means shorter tenancies and higher turnover. Who's the typical renter profile here, and what's been the actual vacancy rate?
- The area grade is low — what's the realistic commute time and amenity access for the typical tenant pool here? Any planned neighborhood developments (good or bad) we should know about?
- What's the average days-on-market for RENTAL listings here right now (not sales)? A rising rental-DOM trend means longer vacancies and softer asking-rent achievability than the comps imply.
- What's the recent tenant-quality profile in this submarket — average credit score on applications, eviction rate, late-payment / NSF rate, and stable-employment percentage? A property-management company in the area should have these aggregated.
- How much new for-sale + rental construction is in the pipeline within 1–3 miles? Heavy new supply typically softens prices + rents 12–24 months out; constrained supply supports both.
Investment metrics
- 1% rule
- 5.87% ✓
- Cap rate
- 52.29%
- Cash-on-cash
- 164.29%
- DSCR
- 8.31
- GRM
- 1.4
CMA / ARV
- ARV (on-the-fly)
- $81,620
- Comps found
- 2
Show comp detail 2 sales within ~0.75 mi
| Address | Dist | Beds/Ba | Sqft | Sold | Price | $/sf | Match |
|---|---|---|---|---|---|---|---|
| 57 Maple St | 0.22mi | 3/1.0 | 1,700 (+15%) | 11mo | $90,000 | $53 | 56 |
| 18 Moores Ferry Rd | 0.54mi | 3/2.0 | 1,624 (+9%) | 21mo | $90,000 | $55 | 37 |
Match score weights: distance 35% · size 25% · config 20% · recency 20%. Top-matched comps best support the ARV.
Projected returns pro-forma
-2.62% appreciation · 3.0% rent growth · sell at horizon
- IRR
- —
- Equity multiple
- 7.79×
- Total profit
- $37,808
- Equity at exit
- $3,301
- IRR
- —
- Equity multiple
- 16.42×
- Total profit
- $85,926
- Equity at exit
- $2,300
Cash invested: $5,572 (down + closing). Projections, not guarantees.
Landlord ↔ Tenant lean methodology
- Overall (STATE)
- 83 Strongly Landlord-Friendly
- State Kentucky
- 83 Strongly Landlord-Friendly · R+16
- County
- — inherits STATE
- City
- — inherits STATE
ZIP-level market 40371
- Home prices YoY
- -0.9%
- Active inventory
- 17
- Price-to-rent
- 1.4×
Monthly cashflow live
- Estimated rent
- $1,167 medium interval (Pro) →
- Mortgage (P&I)
- −$104
- Tax from tax record
- −$47 /mo · $560/yr
- Insurance
- −$8
- Flood insurance flood zone
- −$125 /mo · $1,502/yr
- HOA
- −$0
- Vacancy / Maint / Mgmt
- −$245
- Net cashflow
- $638
Break-even live
Sensitivity live
| Price | -10% $649 | -5% $643 | +0% $638 | +5% $632 | +10% $626 |
|---|---|---|---|---|---|
| Rent | -10% $545 | -5% $592 | +0% $638 | +5% $684 | +10% $730 |
| Rate | -1.0pp $648 | -0.5pp $643 | base $638 | +0.5pp $632 | +1.0pp $627 |
UW: 25.0% down · 7.5% · 30yr · 1.5% tax · 5.0% vac · 8.0% maint · 8.0% mgmt
Financing live
Cash to close
- Down payment
- $4,975
- Closing costs
- $597
- Reserves months
- —
- Total cash needed
- —
Loan-product check · same deal, 3 products live
Conventional
25% down · 7.5% · 30yr
- Down + closing
- —
- Monthly P&I
- —
- Monthly cashflow
- —
- DSCR
- —
- Eligible?
- —
Personal DTI + credit; lowest rate.
DSCR
20% down · 8.5% · 30yr
- Down + closing
- —
- Monthly P&I
- —
- Monthly cashflow
- —
- DSCR
- —
- Eligible?
- —
No personal income docs; deal must DSCR.
Hard money
10% down · 12.0% · 12mo
- Down + closing
- —
- Monthly P&I
- —
- Monthly cashflow
- —
- DSCR
- —
- Eligible?
- —
Short-term bridge; refi at stabilization.
Listing history 18 events
-
2026-06-22days on market $19,900 Active 137 DOM
-
2026-06-19days on market $19,900 Active 134 DOM
-
2026-06-18days on market $19,900 Active 133 DOM
-
2026-06-17days on market $19,900 Active 132 DOM
-
2026-06-16days on market $19,900 Active 131 DOM
-
2026-06-15days on market $19,900 Active 130 DOM
-
2026-06-14days on market $19,900 Active 128 DOM
-
2026-06-12days on market $19,900 Active 127 DOM
-
2026-06-09days on market $19,900 Active 124 DOM
-
2026-06-08days on market $19,900 Active 123 DOM
-
2026-06-07days on market $19,900 Active 122 DOM
-
2026-06-07days on market $19,900 Active 121 DOM
-
2026-06-04days on market $19,900 Active 118 DOM
-
2026-06-02days on market $19,900 Active 117 DOM
-
2026-06-01days on market $19,900 Active 116 DOM
-
2026-05-31days on market $19,900 Active 115 DOM
-
2026-05-31days on market $19,900 Active 114 DOM
-
2026-02-05$19,900 Active
ⓘ Source: listings_history table (triggers on properties + properties_extension) + one-shot
backfill from property_details.listing_events for pre-trigger history.
Tax reassessment forecast KY · Resets to sale price
- Current annual tax
- $560 · $47/mo
- Projected year-2 tax
- $560 · $47/mo
- Expected delta
- $0/yr ($0/mo · 0.0%)
ⓘ Screening estimate from a state-policy table — verify with the county assessor before closing.
Climate risk First Street
- Flood 9/10 Extreme FEMA zone A · 99% chance over 30 yrs
- Wildfire 4/10 Moderate
- Heat 4/10 Moderate 7 d/yr ≥102°F today · 19 d/yr by 30 yrs out
- Wind 4/10 Moderate 5% chance of damaging wind over 30 yrs
- Air quality 2/10 Low 0 unhealthy d/yr today · 1 by 30 yrs out
Nearby sold comps map
Loading sold comps map…
Walkable amenities ~0.75 mi
Loading nearby amenities…
Taxation est. · year 1
- Rental income
- $14,007
- − Mortgage interest
- −$1,115
- − Property taxes
- −$560
- − Insurance
- −$1,602
- − Repairs & maintenance
- −$1,121
- − Management
- −$1,121
- − Depreciation
- −$579
- Taxable income
- $7,911
- Est. tax owed @ 24.0%
- −$1,899
- After-tax cash flow
- $5,753/yr
For passive investors: Depreciation is non-cash, so a rental often shows a tax loss while cash-flowing — sheltering income. Rental losses are passive: they offset passive income freely, and up to $25,000/yr can offset ordinary (W-2) income if you actively participate and your MAGI is under $100k (phasing out to $0 by $150k); unused losses carry forward. On sale, claimed depreciation is recaptured at up to 25%, and gains may owe capital-gains tax (a 1031 exchange can defer both). Figures are a year-1 estimate at your 24.0% rate — not tax advice; consult a CPA.
Schools (NCES district)
- District
- Bath County
- NCES district ID
- 2100330
- Math proficiency
- 19% ▼ -22.00%
- Reading proficiency
- 34% ▼ -21.00%
- Median HH income
- $33,531
- Composite
- 21.67/100
- National rank
- #8278
- State rank
- #139 of 165 in KY
Livability — Salt Lick
- Score
- 56/100
- State rank
- #453
- US rank
- #22411
Category grades
Schools grade is shown separately in the Schools card above.
Census & demographics
- Census place
- Salt Lick, KY
- Population (ZIP)
- 2,587
Population outlook (Bath County) Hauer SSP2
- Today (2025)
- 13,605 people
- By 2030
- 14,240 · +4.7%
- By 2040
- 15,454 · +13.6%
- By 2050
- 16,499 · +21.3%
- By 2075
- 18,706 · +37.5%
- By 2100
- 19,022 · +39.8%
Race, ethnicity, and origin ACS 2023
- Neighborhood character
- Predominantly White (99%)
- Race & ethnicity
- White 99%
- Common ancestry
- Serbian 3%
- Foreign-born
- 0%
Political lean MEDSL · Bath
- 2024 margin
- Solid R (+51.3) · D 23.7% · R 75.0% · Other 1.3%
- 2008→2024 swing
- -50.8pp toward R · 2008: -0.5pp · 2024: -51.3pp
- All cycles
- 2024: R+51.3 2020: R+42.9 2016: R+37.6 2012: R+12.2 2008: R+0.5
Not yet ingested
- Civics
- —
Market trends
- HPI YoY
- ▼ -2.62%
- Current HPI
- 290.6709
- Rent YoY
- —
- Metro
- —
- State GDP YoY
- ▲ 1.81%
- F500 in state
- 4
Industry mix (Fortune 500 HQ in KY)
| Industry | F500 HQs | Revenue |
|---|---|---|
| Healthcare | 1 | $118B |
|
||
| Food / Beverage | 1 | $7B |
|
||
Price history
1 event — show timeline
- 2026-02-05 Listed $19,900 ImagineMLS
Property tax history
+1.4%/yrLatest (2022): $560 · +1.4% YoY. Source: county tax records.
Cash-flow waterfall
monthlySold comps — $/sqft
last 12 mo · ≤1 miLoading sold comps…