11129 Carp Lake Rd · Richwoods, MO
Flood risk 1/10 · Minimal
- FEMA flood zone
- X (unshaded)
- Chance of flooding over 30 yrs
- 0.0%
- Est. flood insurance / yr
- $507 – $1,088
Fire risk 3/10 · Minor
- Est. fire insurance / yr
- $1,054 – $1,958
Heat risk 4/10 · Minor
- Hot days now (above 105°F)
- 7 days/yr
- Hot days in 30 yrs
- 18 days/yr
Wind risk 2/10 · Minimal
- Chance of severe wind over 30 yrs
- 1.0%
Air-quality risk 2/10 · Minimal
- Unhealthy air days now
- 0 days/yr
- Unhealthy air days in 30 yrs
- 1 days/yr
Risk factors via First Street. Map © Google.
Why this score? — see what drove the D grade
The composite is a weighted blend of 9 inputs, each scored 0–100. Each bar is that input's sub-score; the figure is the points it added to the 100-point composite (weight × sub-score).
- Cash flow +13.1/30.0
- ARV discount +7.5/15.0
- Appreciation +6.1/10.0
- DSCR +3.9/10.0
- Schools +3.0/10.0
- Rent growth +2.5/5.0
- Livability +2.5/5.0
- Condition / age +2.5/5.0
- 1% rule +2.3/10.0
$149,900
🖨 Deal sheet (PDF) 📄 Offer letter ✓ Due diligence
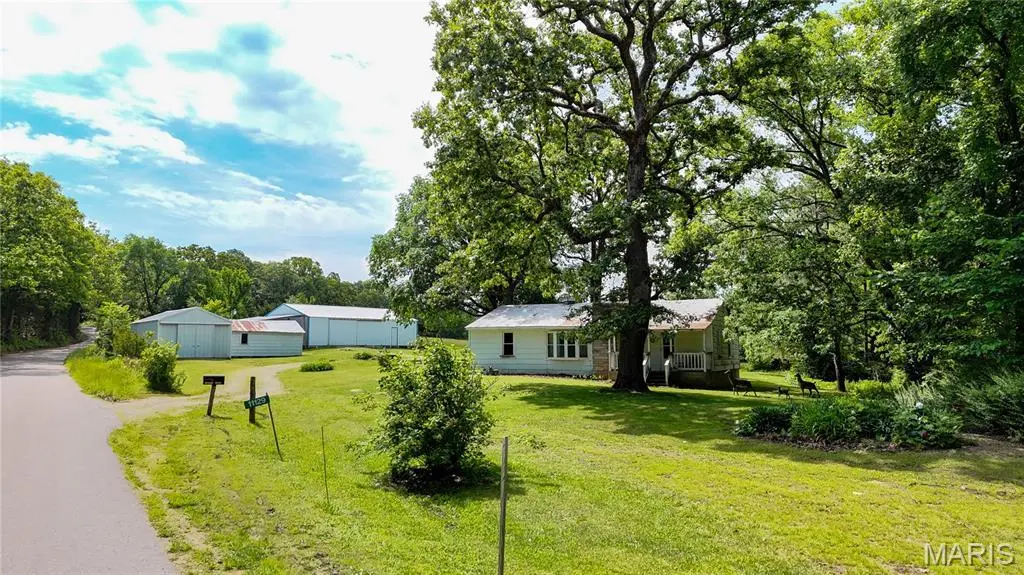
Listing remarks
This peaceful country property offers endless potential on 3 +/- acres, the private property is approx. 5 minutes from Hwy 47 and approx. 12 minutes from Hwy 21. Situated on a quiet asphalt country road, the property features beautiful mature trees, a small field area, and scenic views of the larger acreage behind the home. Built around 1950, the home is full of character and is livable while offering the opportunity to update and make it your own. Perfect for a mini farm, garden, or small animals, this property includes several useful outbuildings, a large approximately 30x50 shop with lean-tos on both sides, plus an additional 18x24 garage with concrete floor, electric, and automatic gara
Key facts
- Scenic views
- Small field area
- 3 acres
Tags
Property features AI
Finance
- Other: Approximately 3 acres of land; Above-grade finished living area reported as 1,462 (per public records)
- Financial info: Lease not considered
Exterior
- Parking: Detached 2-car garage (garage size approx. 30 x 50); Total parking for 2 vehicles
- Utilities: Well water; Septic tank sewer; Electric service available; Water connected
- Home design: Single-family residence; One story; Private ownership; Fixer condition
- Construction: Metal roof; Construction materials: unknown; Combination foundation; House structure; Year built source: public records
- Exterior features: Back yard; Adjoins open ground; Adjoins wooded area; Pasture; Some trees; Private setting; Asphalt road access; County road frontage
Interior
- Kitchen: No kitchen appliance list provided
- Bedrooms: 2 bedrooms (both on the main level)
- Bathrooms: 1 full bathroom (main level)
- Heating & cooling: Baseboard heating; No central cooling
- Interior features: Built-in storage
- Laundry & utility: Laundry on the main level; Dryer included
Neighborhood map
What this means for you Summary
Snapshot
- This is a 2-bed/1.0-bath other listed at $150k.
Deal economics
- At list price, monthly cash flow is $-4 ($-53/yr) — negative.
- To cash-flow at today's rent, offer at most $149k (0.5% below list).
- To meet the 1% rule (rent ≥ 1% of price), the offer needs to be $110k (26.6% below list).
- Recommended offer: $110k (26.6% below list) — sets the bar for 1% rule.
Location & tenants
- Location reads: area grade D — affects rentability + tenant quality, not the cash-flow math above.
- Richwoods R-VII (rural): math 30% / reading 35% proficiency, ranked #432 of 535 in MO (top 81%) — families likely to look elsewhere, expect single-tenant / working-renter base with shorter leases; 74% free/reduced lunch — lower-income household profile, screen leases tightly.
- Zoned schools: Richwoods Elem. (math 17% / reading 37%, grade F, #850 of 1,115 statewide, top 78%, 151 students, 99% FRL) — zoned schools average 99% FRL vs 74% district-wide (25 pts higher); higher-poverty schools than district average — tighter screening recommended.
- Market conditions: 8 active listings in the ZIP.
Forward outlook
- In year one you build about $4k of equity ($1k loan paydown + $3k appreciation (2.1% local appreciation)).
- Washington County population projected at -21% by 2050 — secular population decline; favor cash flow + early exit over multi-decade hold.
- At projected returns (2.1% appreciation + 3.0% rent growth), your $42k cash investment doubles in ~8 years — after that, you're playing with house money.
- By year 8, paydown + projected appreciation supports a ~$32k cash-out refi (75% LTV) — recoverable capital for the next deal without selling this one.
Negotiation context
- Only 10 days on market — expect competitive offers; lowballing is unlikely to land.
Risks & watch-outs
- Watch-outs: built in 1950 — expect roof / HVAC / electrical / plumbing capex.
Questions for the listing agent
- What do current leases actually rent for vs. the listed asking? Can we see a recent rent roll and the last 12 months of T-12 income?
- Built in 1950 — when were the roof, HVAC, electrical panel, plumbing, and water heater last replaced?
- Is there a deadline driving the sale (1031 exchange, divorce, estate, relocation)? That informs how much negotiation room exists.
- The area grade is low — what's the realistic commute time and amenity access for the typical tenant pool here? Any planned neighborhood developments (good or bad) we should know about?
- What's the average days-on-market for RENTAL listings here right now (not sales)? A rising rental-DOM trend means longer vacancies and softer asking-rent achievability than the comps imply.
- What's the recent tenant-quality profile in this submarket — average credit score on applications, eviction rate, late-payment / NSF rate, and stable-employment percentage? A property-management company in the area should have these aggregated.
- How much new for-sale + rental construction is in the pipeline within 1–3 miles? Heavy new supply typically softens prices + rents 12–24 months out; constrained supply supports both.
Investment metrics
- 1% rule
- 0.73% ✗
- Cap rate
- 6.26%
- Cash-on-cash
- -0.13%
- DSCR
- 0.99
- GRM
- 11.4
CMA / ARV
No comps found within radius.
Projected returns pro-forma
2.15% appreciation · 3.0% rent growth · sell at horizon
- IRR
- 4.8%
- Equity multiple
- 1.26×
- Total profit
- $11,047
- Equity at exit
- $60,334
- IRR
- 8.3%
- Equity multiple
- 2.15×
- Total profit
- $48,195
- Equity at exit
- $87,820
Cash invested: $41,972 (down + closing). Projections, not guarantees.
Landlord ↔ Tenant lean methodology
- Overall (STATE)
- 81 Strongly Landlord-Friendly
- State Missouri
- 81 Strongly Landlord-Friendly · R+10
- County
- — inherits STATE
- City
- — inherits STATE
ZIP-level market 63071
- Home prices YoY
- 1.8%
- Active inventory
- 8
- Price-to-rent
- 11.4×
Monthly cashflow live
- Estimated rent
- $1,100 medium interval (Pro) →
- Mortgage (P&I)
- −$786
- Tax from tax record
- −$25 /mo · $301/yr
- Insurance
- −$62
- HOA
- −$0
- Vacancy / Maint / Mgmt
- −$231
- Net cashflow
- $-4
Break-even live
Sensitivity live
| Price | -10% $80 | -5% $38 | +0% $-4 | +5% $-219 | +10% $-270 |
|---|---|---|---|---|---|
| Rent | -10% $-91 | -5% $-48 | +0% $-4 | +5% $39 | +10% $82 |
| Rate | -1.0pp $71 | -0.5pp $34 | base $-4 | +0.5pp $-43 | +1.0pp $-83 |
UW: 25.0% down · 7.5% · 30yr · 1.5% tax · 5.0% vac · 8.0% maint · 8.0% mgmt
Financing live
Cash to close
- Down payment
- $37,475
- Closing costs
- $4,497
- Reserves months
- —
- Total cash needed
- —
Loan-product check · same deal, 3 products live
Conventional
25% down · 7.5% · 30yr
- Down + closing
- —
- Monthly P&I
- —
- Monthly cashflow
- —
- DSCR
- —
- Eligible?
- —
Personal DTI + credit; lowest rate.
DSCR
20% down · 8.5% · 30yr
- Down + closing
- —
- Monthly P&I
- —
- Monthly cashflow
- —
- DSCR
- —
- Eligible?
- —
No personal income docs; deal must DSCR.
Hard money
10% down · 12.0% · 12mo
- Down + closing
- —
- Monthly P&I
- —
- Monthly cashflow
- —
- DSCR
- —
- Eligible?
- —
Short-term bridge; refi at stabilization.
Listing history 1 events
-
2026-05-18$149,900 Active
ⓘ Source: listings_history table (triggers on properties + properties_extension) + one-shot
backfill from property_details.listing_events for pre-trigger history.
Tax reassessment forecast MO · Resets to sale price
- Current annual tax
- $301 · $25/mo
- Projected year-2 tax
- $1,454 · $121/mo
- Expected delta
- +$1,153/yr (+$96/mo · 382.8%)
ⓘ Screening estimate from a state-policy table — verify with the county assessor before closing.
Climate risk First Street
- Flood 1/10 Low FEMA zone X (unshaded) · 0% chance over 30 yrs
- Wildfire 3/10 Moderate
- Heat 4/10 Moderate 7 d/yr ≥105°F today · 18 d/yr by 30 yrs out
- Wind 2/10 Low 100% chance of damaging wind over 30 yrs
- Air quality 2/10 Low 0 unhealthy d/yr today · 1 by 30 yrs out
Nearby sold comps map
Loading sold comps map…
Walkable amenities ~0.75 mi
Loading nearby amenities…
Taxation est. · year 1
- Rental income
- $13,203
- − Mortgage interest
- −$8,397
- − Property taxes
- −$301
- − Insurance
- −$750
- − Repairs & maintenance
- −$1,056
- − Management
- −$1,056
- − Depreciation
- −$4,361
- Taxable loss
- −$2,718
- Est. tax savings @ 24.0%
- +$652
- After-tax cash flow
- $599/yr
For passive investors: Depreciation is non-cash, so a rental often shows a tax loss while cash-flowing — sheltering income. Rental losses are passive: they offset passive income freely, and up to $25,000/yr can offset ordinary (W-2) income if you actively participate and your MAGI is under $100k (phasing out to $0 by $150k); unused losses carry forward. On sale, claimed depreciation is recaptured at up to 25%, and gains may owe capital-gains tax (a 1031 exchange can defer both). Figures are a year-1 estimate at your 24.0% rate — not tax advice; consult a CPA.
Schools (NCES district)
- District
- Richwoods R-VII
- NCES district ID
- 2931230
- Math proficiency
- 30% ▼ -5.00%
- Reading proficiency
- 35% ▬ 0.00%
- Median HH income
- $38,200
- Composite
- 29.87/100
- National rank
- #11689
- State rank
- #432 of 535 in MO
Livability — Richwoods
No livability data for this city. (Only ~50 U.S. cities are tracked.)
Census & demographics
- Population (ZIP)
- 1,315
Population outlook (Washington County) Hauer SSP2
- Today (2025)
- 23,761 people
- By 2030
- 22,923 · -3.5%
- By 2040
- 20,992 · -11.7%
- By 2050
- 18,849 · -20.7%
- By 2075
- 13,749 · -42.1%
- By 2100
- 9,016 · -62.1%
Race, ethnicity, and origin ACS 2023
- Neighborhood character
- Predominantly White (91%)
- Race & ethnicity
- White 91% Two or more races 9% Hispanic / Latino 1%
- Common ancestry
- Lithuanian 12% Serbian 3% Slovak 1%
- Foreign-born
- 1%
- Languages at home
- 99% English-only · Spanish 1% German/W. Germanic 1%
Political lean MEDSL · Washington
- 2024 margin
- Solid R (+65.2) · D 17.1% · R 82.3%
- 2008→2024 swing
- -65.3pp toward R · 2008: 0.1pp · 2024: -65.2pp
- All cycles
- 2024: R+65.2 2020: R+62.6 2016: R+55.2 2012: R+18.6 2008: D+0.1
Not yet ingested
- Civics
- —
Market trends
- HPI YoY
- ▲ 2.15%
- Current HPI
- 120.1192
- Rent YoY
- —
- Metro
- —
- State GDP YoY
- ▲ 1.84%
- F500 in state
- 20
Industry mix (Fortune 500 HQ in MO)
| Industry | F500 HQs | Revenue |
|---|---|---|
| Healthcare | 1 | $163B |
|
||
| Insurance | 1 | $21B |
|
||
| Industrial Technology | 1 | $17B |
|
||
| Retail | 1 | $16B |
|
||
| Industrial Distribution | 1 | $10B |
|
||
| Utilities | 1 | $9B |
|
||
Price history
1 event — show timeline
- 2026-05-18 Listed $149,900 MARIS as Distributed by MLS Grid
Property tax history
+1.2%/yrLatest (2025): $301 · +9.5% YoY. Source: county tax records.
Cash-flow waterfall
monthlySold comps — $/sqft
last 12 mo · ≤1 miLoading sold comps…