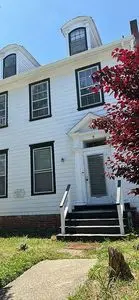
9 Chestnut St · Salem, NJ
Flood risk 4/10 · Minor
- FEMA flood zone
- X (unshaded)
- Chance of flooding over 30 yrs
- 0.2%
- Est. flood insurance / yr
- $507 – $1,088
Fire risk 2/10 · Minimal
- Est. fire insurance / yr
- $526 – $976
Heat risk 8/10 · Major
- Hot days now (above 103°F)
- 7 days/yr
- Hot days in 30 yrs
- 15 days/yr
Wind risk 6/10 · Moderate
- Chance of severe wind over 30 yrs
- 27.0%
Air-quality risk 3/10 · Minor
- Unhealthy air days now
- 2 days/yr
- Unhealthy air days in 30 yrs
- 4 days/yr
Risk factors via First Street. Map © Google.
Why this score? — see what drove the D grade
The composite is a weighted blend of 9 inputs, each scored 0–100. Each bar is that input's sub-score; the figure is the points it added to the 100-point composite (weight × sub-score).
- Cash flow +13.1/30.0
- ARV discount +7.5/15.0
- Appreciation +4.8/10.0
- 1% rule +4.4/10.0
- DSCR +3.9/10.0
- Livability +3.1/5.0
- Rent growth +2.5/5.0
- Condition / age +2.5/5.0
- Schools +1.2/10.0
$249,999
🖨 Deal sheet 📄 Offer letter ✓ Due diligence
Listing remarks MLS
Don't miss out on this 7 bedroom, 3.5 bath Federal Style Colonial (circa-1769) with approximately 3,100 SqFt of living space in a nice area of Salem. The property is in need of a total renovation and is being sold in its AS-IS condition. You will love the Old Charm that came with homes of this time. Step into the 31 ft. long welcoming entry foyer with 9 ft. ceilings, original crown molding, wood trim work, plank flooring, and the open front staircase to the 2nd floor. The foyer also features a convenient powder room and basement access. This area opens to the spacious living room area with wood flooring, crown molding, 9 ft. ceiling, and pocket doors into the adjoining family room. The spacious family room measures 19 x 18 in size. These two rooms with the pocket doors really open up the front half of this home. The adjoining dining room area features a side door to the enclosed mud room. The kitchen is totally gutted, and it features a door out to the side screened porch, and a door leading out to another 15 x 9 enclosed mudroom area with exposed beamed ceiling. The kitchen also features a 2nd rear staircase to the basement as well as the 2nd rear staircase to the basement. The 2nd floor features 5 of the 7 spacious bedrooms and 2 of the 3.5 baths. This level has the front & rear staircases from the 1st floor, with a connecting hallway for easy access to all the bedrooms and baths on this level. The larger bedrooms have connecting doors similar to the connecting rooms just below them on the 1st floor. There is an open staircase to the 3rd floor that features the 6th and 7th bedrooms, a walk-thru den area, as well as the 3rd full bath, which is a princess suite bathroom in one of the bedrooms. The other bedroom features steps that lead up to the attic area above. The brick basement has two interior sets of steps from the 1st floor down to the basement that features brick walls and floors. This area houses the 2 separate hot water heaters, and a Weil & McClain gas hot water boiler. This area also features what appears to be a 200-amp electric service panel box. Outside you will find a 2-car driveway leading to the covered car port as well as the enclosed screened porch. Perfect spot to relax with the morning cup of coffee. The rear yard leads back to a rear alley access that comes in from Carpenter St. This home is so conveniently located to the center of town, right next door to the Police station, the Bank , Post office, local schools, nearby shopping, restaurants, Rt 49, Rt 45 and Rt 295 to be in Delaware, the City or the Jersey Shore all within minutes. Hurry before this fixer upper in gone!
Key facts
- Circa 1769 colonial
- Exterior painted
- Roof replaced
Tags
Neighborhood map
What this means for you Summary
Snapshot
- This is a 8-bed/4.0-bath single-family listed at $250k.
Deal economics
- At list price, monthly cash flow is $-10 ($-119/yr) — negative.
- To cash-flow at today's rent, offer at most $248k (0.7% below list).
- To meet the 1% rule (rent ≥ 1% of price), the offer needs to be $235k (6.0% below list).
- Recommended offer: $235k (6.0% below list) — sets the bar for 1% rule.
- Cap rate 6.2% vs local median 8.4% in Salem — below-typical yield; the buyer is paying a premium for something (appreciation thesis, condition, location) that the cap rate doesn't capture.
Location & tenants
- Location reads 61/100 on livability (#462 in NJ) — a middle-class / working-renter tenant base. Strengths: cost of living A+, health & safety A+, crime B; Watch: schools D, amenities F, commute F.
- Salem City School District (town): math 6% / reading 24% proficiency, ranked #464 of 472 in NJ (top 98%) — low school quality limits family demand, transient renter base, plan for 1-2y turnover; 85% free/reduced lunch — lower-income household profile, screen leases tightly.
- Market conditions: 100 active listings in the ZIP; 95 units permitted in Salem County in 2024 (0 in 5+ unit buildings).
- At $2,350/mo this rent would consume 52% of the median local household income ($55k/yr) (locally 663% of renters already pay >50% of income on rent) — very limited rent-growth headroom before tenants either downsize or default.
Forward outlook
- In year one you build about $778 of equity ($2k loan paydown + $-950 appreciation (-0.4% local appreciation)).
- Salem County population projected at -23% by 2050 — secular population decline; favor cash flow + early exit over multi-decade hold.
Negotiation context
- It's been on market 15 days — a 2% lower offer ($246k) is reasonable based on typical stale-listing flexibility.
- 5 sale attempts since 8y ago with the ask held roughly flat each time — persistent listings suggest the price (not the market) is what's stuck; bring a comps-based counter.
- Current owner paid $70k; list at $250k implies a 257% gain — meaningful room to come down on a strong offer.
Risks & watch-outs
- Watch-outs: built in 1769 — expect roof / HVAC / electrical / plumbing capex.
- Climate carrying-cost: major wind risk, 27% chance of damaging wind over 30y; extreme-heat days projected 7→15/yr by 2055 (HVAC capex compounding) — expect insurance premiums to compound above CPI over the hold.
Questions for the listing agent
- What do current leases actually rent for vs. the listed asking? Can we see a recent rent roll and the last 12 months of T-12 income?
- Built in 1769 — when were the roof, HVAC, electrical panel, plumbing, and water heater last replaced?
- Is there a deadline driving the sale (1031 exchange, divorce, estate, relocation)? That informs how much negotiation room exists.
- Schools are D-rated, which usually means shorter tenancies and higher turnover. Who's the typical renter profile here, and what's been the actual vacancy rate?
- The area grade is low — what's the realistic commute time and amenity access for the typical tenant pool here? Any planned neighborhood developments (good or bad) we should know about?
- What's the average days-on-market for RENTAL listings here right now (not sales)? A rising rental-DOM trend means longer vacancies and softer asking-rent achievability than the comps imply.
- What's the recent tenant-quality profile in this submarket — average credit score on applications, eviction rate, late-payment / NSF rate, and stable-employment percentage? A property-management company in the area should have these aggregated.
- How much new for-sale + rental construction is in the pipeline within 1–3 miles? Heavy new supply typically softens prices + rents 12–24 months out; constrained supply supports both.
Investment metrics
- 1% rule
- 0.94% ✗
- Cap rate
- 6.25%
- Cash-on-cash
- -0.17%
- DSCR
- 0.99
- GRM
- 8.9
CMA / ARV
- ARV (on-the-fly)
- $148,992
- Comps found
- 1
Show comp detail 1 sale within ~0.75 mi
| Address | Dist | Beds/Ba | Sqft | Sold | Price | $/sf | Match |
|---|---|---|---|---|---|---|---|
| 52 Market St | 0.34mi | 7/2.5 (-1) | 3,135 (+1%) | 5mo | $150,000 | $48 | 68 |
Match score weights: distance 35% · size 25% · config 20% · recency 20%. Top-matched comps best support the ARV.
Projected returns pro-forma
-0.38% appreciation · 3.0% rent growth · sell at horizon
- IRR
- -3.8%
- Equity multiple
- 0.82×
- Total profit
- $-12,256
- Equity at exit
- $67,876
- IRR
- 2.4%
- Equity multiple
- 1.24×
- Total profit
- $16,881
- Equity at exit
- $77,915
Cash invested: $70,000 (down + closing). Projections, not guarantees.
Landlord ↔ Tenant lean methodology
- Overall (STATE)
- 21 Tenant-Leaning
- State New Jersey
- 21 Tenant-Leaning · D+6
- County
- — inherits STATE
- City
- — inherits STATE
ZIP-level market 08079
- Home prices YoY
- -0.1%
- Active inventory
- 100
- Price-to-rent
- 8.9×
Monthly cashflow live
- Estimated rent
- $2,350 medium interval (Pro) →
- Mortgage (P&I)
- −$1,311
- Tax from tax record
- −$451 /mo · $5,410/yr
- Insurance
- −$104
- HOA
- −$0
- Vacancy / Maint / Mgmt
- −$493
- Net cashflow
- $-10
Break-even live
UW: 25.0% down · 7.5% · 30yr · 1.5% tax · 5.0% vac · 8.0% maint · 8.0% mgmt
Financing live
Cash to close
- Down payment
- $62,500
- Closing costs
- $7,500
- Reserves months
- —
- Total cash needed
- —
Loan-product check · same deal, 3 products live
Conventional
25% down · 7.5% · 30yr
- Down + closing
- —
- Monthly P&I
- —
- Monthly cashflow
- —
- DSCR
- —
- Eligible?
- —
Personal DTI + credit; lowest rate.
DSCR
20% down · 8.5% · 30yr
- Down + closing
- —
- Monthly P&I
- —
- Monthly cashflow
- —
- DSCR
- —
- Eligible?
- —
No personal income docs; deal must DSCR.
Hard money
10% down · 12.0% · 12mo
- Down + closing
- —
- Monthly P&I
- —
- Monthly cashflow
- —
- DSCR
- —
- Eligible?
- —
Short-term bridge; refi at stabilization.
Listing history 11 events
-
2026-06-18days on market $249,999 Active 15 DOM
-
2026-06-17days on market $249,999 Active 14 DOM
-
2026-06-16days on market $249,999 Active 13 DOM
-
2026-06-15days on market $249,999 Active 12 DOM
-
2026-06-13days on market $249,999 Active 10 DOM
-
2026-06-13days on market $249,999 Active 9 DOM
-
2026-06-09days on market $249,999 Active 6 DOM
-
2026-06-08days on market $249,999 Active 5 DOM
-
2026-06-07days on market $249,999 Active 4 DOM
-
2026-06-04remarks 687-char remark
-
2026-06-04$249,999 Active 1 DOM
ⓘ Source: listings_history table (triggers on properties + properties_extension) + one-shot
backfill from property_details.listing_events for pre-trigger history.
Tax reassessment forecast NJ · Partial reset (capped growth)
- Current annual tax
- $5,410 · $451/mo
- Projected year-2 tax
- $5,817 · $485/mo
- Expected delta
- +$408/yr (+$34/mo · 7.5%)
ⓘ Screening estimate from a state-policy table — verify with the county assessor before closing.
Climate risk First Street
- Flood 4/10 Moderate FEMA zone X (unshaded) · 20% chance over 30 yrs
- Wildfire 2/10 Low
- Heat 8/10 Severe 7 d/yr ≥103°F today · 15 d/yr by 30 yrs out
- Wind 6/10 Major 27% chance of damaging wind over 30 yrs
- Air quality 3/10 Moderate 2 unhealthy d/yr today · 4 by 30 yrs out
Nearby sold comps map
Loading sold comps map…
Walkable amenities ~0.75 mi
Loading nearby amenities…
Taxation est. · year 1
- Rental income
- $28,194
- − Mortgage interest
- −$14,004
- − Property taxes
- −$5,410
- − Insurance
- −$1,250
- − Repairs & maintenance
- −$2,256
- − Management
- −$2,256
- − Depreciation
- −$7,273
- Taxable loss
- −$4,253
- Est. tax savings @ 24.0%
- +$1,021
- After-tax cash flow
- $902/yr
For passive investors: Depreciation is non-cash, so a rental often shows a tax loss while cash-flowing — sheltering income. Rental losses are passive: they offset passive income freely, and up to $25,000/yr can offset ordinary (W-2) income if you actively participate and your MAGI is under $100k (phasing out to $0 by $150k); unused losses carry forward. On sale, claimed depreciation is recaptured at up to 25%, and gains may owe capital-gains tax (a 1031 exchange can defer both). Figures are a year-1 estimate at your 24.0% rate — not tax advice; consult a CPA.
Schools (NCES district)
- District
- Salem City School District
- NCES district ID
- 3414550
- Math proficiency
- 6% ▼ -1.00%
- Reading proficiency
- 24% ▲ 2.00%
- Median HH income
- $27,118
- Composite
- 11.51/100
- National rank
- #9702
- State rank
- #464 of 472 in NJ
Livability — Salem
- Score
- 61/100
- State rank
- #462
- US rank
- #17533
Category grades
Schools grade is shown separately in the Schools card above.
Census & demographics
- Census place
- Salem, NJ
- County
- Salem County · 24,175 people
- City population
- 10,762
- Metro
- Philadelphia-Camden-Wilmington, PA-NJ-DE-MD
- Population (ZIP)
- 10,762
- Household income
- $54,641
- Rent vs Own
- Severe rent burden
- 663.0
Population outlook (Salem County) Hauer SSP2
- Today (2025)
- 59,905 people
- By 2030
- 57,351 · -4.3%
- By 2040
- 51,837 · -13.5%
- By 2050
- 46,356 · -22.6%
- By 2075
- 36,452 · -39.2%
- By 2100
- 28,907 · -51.7%
Race, ethnicity, and origin ACS 2023
- Neighborhood character
- Diverse neighborhood (Simpson 0.55)
- Race & ethnicity
- White 59% Black 31% Hispanic / Latino 6% Two or more races 5% Asian 1%
- Hispanic origin (detail)
- Puerto Rican 5%
- Common ancestry
- Romanian 3% Lithuanian 2% Italian 1%
- Foreign-born
- 2% · Canada
- Languages at home
- 94% English-only · Spanish 4% Tagalog/Filipino 1%
Political lean MEDSL · Salem
- 2024 margin
- R (+19.2) · D 39.6% · R 58.8% · Other 1.6%
- 2008→2024 swing
- -23.1pp toward R · 2008: 3.9pp · 2024: -19.2pp
- All cycles
- 2024: R+19.2 2020: R+12.8 2016: R+15.4 2012: D+0.8 2008: D+3.9
Not yet ingested
- Civics
- —
Market trends
- HPI YoY
- ▼ -0.38%
- Current HPI
- 258.0047
- Rent YoY
- —
- Metro
- Philadelphia-Camden-Wilmington, PA-NJ-DE-MD
- State GDP YoY
- ▲ 2.05%
- F500 in state
- 34
Industry mix (Fortune 500 HQ in NJ)
| Industry | F500 HQs | Revenue |
|---|---|---|
| Consumer Goods | 3 | $31B |
|
||
| Pharmaceuticals | 2 | $153B |
|
||
| Technology | 2 | $21B |
|
||
| Insurance | 2 | $20B |
|
||
| Healthcare | 2 | $19B |
|
||
| Financial Services | 1 | $70B |
|
||
Price history
+323.7% since first listed16 events — show timeline
- 2026-06-04 Listed $249,999 FSBO.com
- 2023-08-08 Sold (Public Records) $70,000 Public Records
- 2023-07-31 Sold (MLS) $70,000 BRIGHT MLS
- 2023-07-21 Pending — BRIGHT MLS
- 2023-07-19 Contingent — BRIGHT MLS
- 2023-05-31 Relisted — BRIGHT MLS
- 2023-05-17 Pending — BRIGHT MLS
- 2023-04-27 Price Changed $83,500 BRIGHT MLS
- 2023-04-11 Price Changed $90,000 BRIGHT MLS
- 2023-04-04 Listed $100,000 BRIGHT MLS
- 2019-05-23 Sold (MLS) $25,000 BRIGHT MLS
- 2019-05-06 Pending — BRIGHT MLS
- 2019-05-01 Relisted — BRIGHT MLS
- 2019-04-30 Listing Removed — BRIGHT MLS
- 2018-12-29 Price Changed $50,000 BRIGHT MLS
- 2018-10-29 Listed $59,000 BRIGHT MLS
Property tax history
-0.8%/yrLatest (2025): $5,410 · +4.9% YoY. Source: county tax records.
Cash-flow waterfall
monthlySold comps — $/sqft
last 12 mo · ≤1 miLoading sold comps…