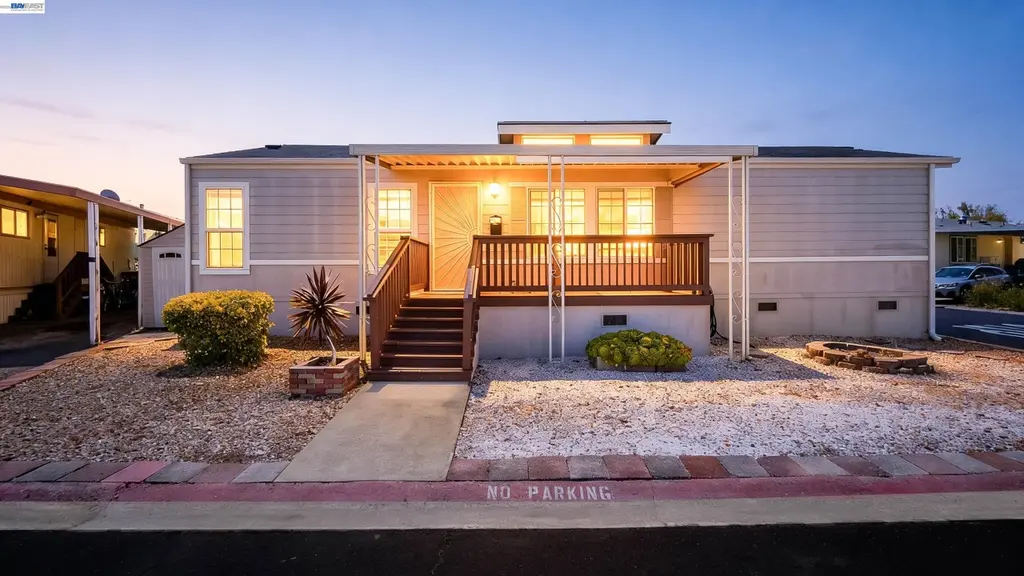
28680 Mercury St · Hayward, CA
Flood risk 1/10 · Minimal
- FEMA flood zone
- X (unshaded)
- Chance of flooding over 30 yrs
- 0.0%
- Est. flood insurance / yr
- $507 – $1,088
Fire risk 4/10 · Minor
- Est. fire insurance / yr
- $659 – $1,223
Heat risk 4/10 · Minor
- Hot days now (above 89°F)
- 7 days/yr
- Hot days in 30 yrs
- 14 days/yr
Wind risk 1/10 · Minimal
- Chance of severe wind over 30 yrs
- —
Air-quality risk 7/10 · Major
- Unhealthy air days now
- 12 days/yr
- Unhealthy air days in 30 yrs
- 12 days/yr
Risk factors via First Street. Map © Google.
Why this score? — see what drove the F grade
The composite is a weighted blend of 9 inputs, each scored 0–100. Each bar is that input's sub-score; the figure is the points it added to the 100-point composite (weight × sub-score).
- Cash flow +12.9/30.0
- DSCR +3.8/10.0
- Livability +3.8/5.0
- Rent growth +3.1/5.0
- Schools +3.1/10.0
- Condition / age +2.5/5.0
- 1% rule +2.3/10.0
- ARV discount +0.0/15.0
- Appreciation +0.0/10.0
$349,950
🖨 Deal sheet (PDF) 📄 Offer letter ✓ Due diligence
Listing remarks
Welcome to this beautifully updated 3-bedroom, 2-bath manufactured home located in a desirable family park. Built in 2005, this spacious residence features an open-concept floor plan that creates a bright and inviting living environment, ideal for both everyday living and entertaining. Recent upgrades include brand-new interior paint and luxury vinyl plank flooring throughout, giving the home a fresh, modern feel. The kitchen has been updated with a new stove, dishwasher, and sink faucet, adding both style and functionality. Dual-pane windows enhance energy efficiency and comfort year-round. Additional highlights include a convenient indoor laundry room and generous front and back yard spac
Key facts
- Recent upgrades
- Indoor laundry room
- Community pool
Tags
Property features AI
Finance
- HOA & community: Pets allowed; Community clubhouse
Exterior
- Parking: Carport; Guest parking; Private parking
- Utilities: Public water; Public sewer
- Home design: Manufactured in park (mobile home); Single wide model (Westwood)
- Construction: Wood siding
- Exterior features: Front porch; Front yard; Back yard; Community pool
Interior
- Kitchen: Disposal; Microwave; Free‑standing range; Refrigerator
- Bedrooms: 3 bedrooms; Primary bedroom suite on main level
- Flooring: Vinyl
- Bathrooms: 2 total bathrooms (2 full)
- Heating & cooling: Central heating; Ceiling fan(s)
- Interior features: No additional rooms; Main entry
- Laundry & utility: Laundry inside
Neighborhood map
What this means for you Summary
Snapshot
- This is a 3-bed/2.0-bath manufactured listed at $350k.
Deal economics
- At list price, monthly cash flow is $-28 ($-336/yr) — negative.
- To cash-flow at today's rent, offer at most $345k (1.4% below list).
- To meet the 1% rule (rent ≥ 1% of price), the offer needs to be $255k (27.2% below list).
- Recommended offer: $255k (27.2% below list) — sets the bar for 1% rule.
- Cap rate 6.2% vs local median 2.1% in Hayward — top-decile yield for the area; either an underpriced asset or a hidden risk that comps aren't pricing in. Stress-test before assuming the spread holds.
Location & tenants
- Location reads 75/100 on livability (#124 in CA, #4,294 nationally) — a middle-class / working-renter tenant base. Strengths: commute A+, employment A+, health & safety A+; Watch: crime F, cost of living F.
- Hayward Unified (urban): math 25% / reading 37% proficiency, ranked #935 of 1,400 in CA (top 67%) — families likely to look elsewhere, expect single-tenant / working-renter base with shorter leases; 61% free/reduced lunch — lower-income household profile, screen leases tightly.
- Zoned schools: Ruus Elementary (379 students, 74% FRL); Cesar Chavez Middle (482 students, 69% FRL); Tennyson High (1,551 students, 65% FRL).
- Market conditions: Rents rising (+2.6%/yr); 173 active listings in the ZIP; 33 comparable units currently listed for rent nearby; rentals at typical pace (median 15d on market — plan ~3-4 weeks tenant-placement turnaround); solid renter incomes; 1,742 units permitted in Alameda County in 2024 (856 in 5+ unit buildings).
Forward outlook
- Local home prices are declining (-3.0%/yr); year-one equity from $2k of loan paydown is wiped out by about $10k of value loss. Plan a longer hold.
- Alameda County population projected at +34% by 2050 — long-run rental-demand tailwind backs the buy-and-hold thesis.
Negotiation context
- It's been on market 17 days — a 2% lower offer ($345k) is reasonable based on typical stale-listing flexibility.
Questions for the listing agent
- What do current leases actually rent for vs. the listed asking? Can we see a recent rent roll and the last 12 months of T-12 income?
- Is there a deadline driving the sale (1031 exchange, divorce, estate, relocation)? That informs how much negotiation room exists.
- Schools are D-rated, which usually means shorter tenancies and higher turnover. Who's the typical renter profile here, and what's been the actual vacancy rate?
- Crime grade is F in this area — have there been break-ins, vandalism, or insurance claims at this property in the last 3 years? What carrier currently insures it and at what premium?
- The area grade is low — what's the realistic commute time and amenity access for the typical tenant pool here? Any planned neighborhood developments (good or bad) we should know about?
- What's the average days-on-market for RENTAL listings here right now (not sales)? A rising rental-DOM trend means longer vacancies and softer asking-rent achievability than the comps imply.
- What's the recent tenant-quality profile in this submarket — average credit score on applications, eviction rate, late-payment / NSF rate, and stable-employment percentage? A property-management company in the area should have these aggregated.
- How much new for-sale + rental construction is in the pipeline within 1–3 miles? Heavy new supply typically softens prices + rents 12–24 months out; constrained supply supports both.
Investment metrics
- 1% rule
- 0.73% ✗
- Cap rate
- 6.20%
- Cash-on-cash
- -0.34%
- DSCR
- 0.98
- GRM
- 11.5
CMA / ARV
- ARV (on-the-fly)
- $258,464
- Comps found
- 12
Show comp detail 12 sales within ~0.75 mi
| Address | Dist | Beds/Ba | Sqft | Sold | Price | $/sf | Match |
|---|---|---|---|---|---|---|---|
| 28816 Jupiter St Unit - | 0.10mi | 3/2.0 | 1,248 (-5%) | 9mo | $325,000 | $260 | 80 |
| 29133 De La Cruz Rd | 0.25mi | 2/2.0 (-1) | 1,344 (+2%) | 3mo | $231,900 | $173 | 77 |
| 29131 Delgado Rd | 0.21mi | 2/2.0 (-1) | 1,440 (+10%) | 3mo | $258,000 | $179 | 66 |
| 29138 Delgado Rd | 0.22mi | 2/2.0 (-1) | 1,440 (+10%) | 4mo | $284,000 | $197 | 65 |
| 29315 Harpoon Way | 0.60mi | 2/2.0 (-1) | 1,334 (+2%) | 1mo | $255,000 | $191 | 64 |
| 29060 Aztec Rd #79 | 0.24mi | 2/2.0 (-1) | 1,440 (+10%) | 8mo | $297,500 | $207 | 61 |
| 29043 Windemere | 0.71mi | 3/2.0 | 1,260 (-4%) | 3mo | $319,000 | $253 | 58 |
| 29255 Harpoon Way | 0.44mi | 2/2.0 (-1) | 1,440 (+10%) | 1mo | $265,000 | $184 | 57 |
| 29424 Providence Way | 0.74mi | 3/2.0 | 1,404 (+7%) | 2mo | $399,800 | $285 | 52 |
| 29413 Sandburg Way | 0.70mi | 2/2.0 (-1) | 1,380 (+5%) | 5mo | $327,000 | $237 | 49 |
| 29050 S Westminster | 0.67mi | 2/2.0 (-1) | 1,440 (+10%) | 5mo | $259,000 | $180 | 43 |
| 935 Fall River Dr | 0.53mi | 2/2.0 (-1) | 1,494 (+14%) | 9mo | $229,900 | $154 | 40 |
Match score weights: distance 35% · size 25% · config 20% · recency 20%. Top-matched comps best support the ARV.
Projected returns pro-forma
-3.0% appreciation · 2.58% rent growth · sell at horizon
- IRR
- -17.3%
- Equity multiple
- 0.39×
- Total profit
- $-59,759
- Equity at exit
- $52,179
- IRR
- -10.1%
- Equity multiple
- 0.39×
- Total profit
- $-59,486
- Equity at exit
- $30,257
Cash invested: $97,986 (down + closing). Projections, not guarantees.
Landlord ↔ Tenant lean methodology
- Overall (STATE)
- 18 Strongly Tenant-Friendly
- State California
- 18 Strongly Tenant-Friendly · D+13
- County
- — inherits STATE
- City
- — inherits STATE
ZIP-level market 94544
- Rents YoY
- 2.6%
- Active inventory
- 173
- Price-to-rent
- 11.5×
Monthly cashflow live
- Estimated rent
- $2,546 high interval (Pro) →
- Mortgage (P&I)
- −$1,835
- Tax from tax record
- −$59 /mo · $705/yr
- Insurance
- −$146
- HOA
- −$0
- Lot rent leased land?
- −$0
- Vacancy / Maint / Mgmt
- −$535
- Net cashflow
- $-28
Break-even live
Sensitivity live
| Price | -10% $170 | -5% $71 | +0% $-28 | +5% $-528 | +10% $-649 |
|---|---|---|---|---|---|
| Rent | -10% $-229 | -5% $-129 | +0% $-28 | +5% $73 | +10% $173 |
| Rate | -1.0pp $148 | -0.5pp $61 | base $-28 | +0.5pp $-119 | +1.0pp $-211 |
UW: 25.0% down · 7.5% · 30yr · 1.5% tax · 5.0% vac · 8.0% maint · 8.0% mgmt
Financing live
Cash to close
- Down payment
- $87,488
- Closing costs
- $10,498
- Reserves months
- —
- Total cash needed
- —
Loan-product check · same deal, 3 products live
Conventional
25% down · 7.5% · 30yr
- Down + closing
- —
- Monthly P&I
- —
- Monthly cashflow
- —
- DSCR
- —
- Eligible?
- —
Personal DTI + credit; lowest rate.
DSCR
20% down · 8.5% · 30yr
- Down + closing
- —
- Monthly P&I
- —
- Monthly cashflow
- —
- DSCR
- —
- Eligible?
- —
No personal income docs; deal must DSCR.
Hard money
10% down · 12.0% · 12mo
- Down + closing
- —
- Monthly P&I
- —
- Monthly cashflow
- —
- DSCR
- —
- Eligible?
- —
Short-term bridge; refi at stabilization.
Rent comps 33 comps
| Address | Beds | Baths | Sqft | Rent | $/sqft | DOM | Units | Dist |
|---|---|---|---|---|---|---|---|---|
| 34 Ballard Ct Hayward, CA | 2.0 | 1.0 | 1000 | $2,400 | $2.40 | 46d | 1 | 0.10mi |
| 75 Quist Ave Hayward, CA | 4.0 | 2.5 | 1866 | $3,895 | $2.09 | 15d | 1 | 0.22mi |
| 29189 Lassen St Hayward, CA | 3.0 | 2.0 | 1180 | $3,500 | $2.97 | 46d | 1 | 0.27mi |
| 685 Carmar St Hayward, CA | 4.0 | 2.0 | 1569 | $3,900 | $2.49 | 24d | 1 | 0.29mi |
| 317 Tennyson Rd Hayward, CA | 3.0 | 1.0 | 1050 | $3,395 | $3.23 | 15d | 1 | 0.29mi |
| 720 W Tennyson Rd Hayward, CA | 3.0 | 1.0–2.0 | 630 | $3,134 | $4.97 | 0d | 1 | 0.40mi |
| 29163 Dixon St Hayward, CA | 2.0–3.0 | 1.0–1.5 | 1100 | $3,595 | $3.27 | 0d | 5 | 0.41mi |
| 29289 Dixon St Hayward, CA | 2.0 | 1.0–2.0 | 990 | $2,285 | $2.31 | 26d | 2 | 0.47mi |
| 28850 Dixon St Hayward, CA | 1.0–2.0 | 1.0–2.0 | 906 | $3,406 | $3.76 | 0d | 9 | 0.48mi |
| 655 Tennyson Rd Hayward, CA | 1.0–2.0 | 1.0–2.0 | 857 | $3,139 | $3.66 | 1d | 4 | 0.50mi |
| 27703 Persimmon Dr Hayward, CA | 3.0 | 3.0 | 1549 | $3,695 | $2.39 | 46d | 1 | 0.51mi |
| 28187 Karn Dr Hayward, CA | 3.0 | 2.5 | 1335 | $3,300 | $2.47 | 7d | 1 | 0.53mi |
| 27427 Stoneridge Ct Hayward, CA | 2.0 | 1.5 | 1008 | $2,500 | $2.48 | 46d | 1 | 0.60mi |
| 376 Line St Hayward, CA | 2.0 | 2.0 | 1286 | $3,500 | $2.72 | 0d | 1 | 0.61mi |
| 376 Line St Hayward, CA | 2.0 | 2.0 | 1286 | $3,500 | $2.72 | 4d | 1 | 0.61mi |
| 28168 Mission Blvd Hayward, CA | 1.0–3.0 | 1.0–2.0 | 1196 | $4,799 | $4.01 | 0d | 14 | 0.62mi |
| 29384 Hub Ln Hayward, CA | 3.0 | 2.5 | 1684 | $3,950 | $2.35 | 4d | 1 | 0.62mi |
| 29384 Hub Ln Hayward, CA | 3.0 | 2.5 | 1684 | $3,950 | $2.35 | 6d | 1 | 0.62mi |
| 111 Notion Way Hayward, CA | 3.0 | 2.5 | 1718 | $4,250 | $2.47 | 46d | 1 | 0.64mi |
| 837 Hancock St Hayward, CA | 1.0–3.0 | 1.0–2.0 | 955 | $4,044 | $4.23 | 0d | 14 | 0.69mi |
| 27500 Tampa Ave Unit 85 Hayward, CA | 2.0 | 1.5 | 950 | $2,275 | $2.39 | 17d | 1 | 0.75mi |
| 27070 Manon Ave Unit 6A Hayward, CA | 2.0 | 1.0 | 900 | $2,200 | $2.44 | 46d | 1 | 0.83mi |
| 27162 Tampa Ave #70 Hayward, CA | 2.0 | 1.0 | 977 | $2,550 | $2.61 | 6d | 1 | 0.83mi |
| 27033 Belvedere Ct Apt 8 Hayward, CA | 2.0 | 2.0 | 900 | $2,400 | $2.67 | 26d | 1 | 0.85mi |
| 981 Cheryl Ann Cir #40 Hayward, CA | 3.0 | 2.0 | 1245 | $3,800 | $3.05 | 46d | 1 | 0.89mi |
| 695 Bristol Dr #178 Hayward, CA | 2.0 | 2.0 | 894 | $2,750 | $3.08 | 4d | 1 | 0.97mi |
| 287 Ebony Way Hayward, CA | 4.0 | 2.5 | 1600 | $3,450 | $2.16 | 26d | 1 | 0.99mi |
| 26730 Tyrrell Ave Hayward, CA | 4.0 | 2.0 | 1250 | $3,650 | $2.92 | 46d | 1 | 1.04mi |
| 530 Cottage Park Dr Hayward, CA | 4.0 | 3.0 | 1806 | $4,500 | $2.49 | 7d | 1 | 1.14mi |
| 26379 Whitman St Hayward, CA | 1.0–2.0 | 1.0–2.0 | 898 | $2,870 | $3.19 | 1d | 11 | 1.24mi |
| 1234 McFarlane Ln Hayward, CA | 3.0 | 2.0 | 1311 | $3,660 | $2.79 | 15d | 1 | 1.32mi |
| 26525 Gading Rd Hayward, CA | 2.0 | 1.0 | 950 | $2,350 | $2.47 | 46d | 1 | 1.34mi |
| 25937 Dollar St Hayward, CA | 3.0 | 2.5 | 1707 | $3,700 | $2.17 | 26d | 1 | 1.43mi |
Listing history 13 events
-
2026-06-21statusdays on market $349,950 Pending 17 DOM
-
2026-06-18days on market $349,950 Active 16 DOM
-
2026-06-17days on market $349,950 Active 15 DOM
-
2026-06-16days on market $349,950 Active 14 DOM
-
2026-06-15days on market $349,950 Active 13 DOM
-
2026-06-13days on market $349,950 Active 11 DOM
-
2026-06-13days on market $349,950 Active 10 DOM
-
2026-06-09days on market $349,950 Active 7 DOM
-
2026-06-08days on market $349,950 Active 6 DOM
-
2026-06-07days on market $349,950 Active 5 DOM
-
2026-06-04days on market $349,950 Active 2 DOM
-
2026-06-03remarks 699-char remark
-
2026-06-03$349,950 Active 1 DOM
ⓘ Source: listings_history table (triggers on properties + properties_extension) + one-shot
backfill from property_details.listing_events for pre-trigger history.
Tax reassessment forecast CA · Resets to sale price
- Current annual tax
- $705 · $59/mo
- Projected year-2 tax
- $2,660 · $222/mo
- Expected delta
- +$1,954/yr (+$163/mo · 277.2%)
ⓘ Screening estimate from a state-policy table — verify with the county assessor before closing.
Climate risk First Street
- Flood 1/10 Low FEMA zone X (unshaded) · 0% chance over 30 yrs
- Wildfire 4/10 Moderate
- Heat 4/10 Moderate 7 d/yr ≥89°F today · 14 d/yr by 30 yrs out
- Wind 1/10 Low
- Air quality 7/10 Severe 12 unhealthy d/yr today · 12 by 30 yrs out
Nearby sold comps map
Loading sold comps map…
Walkable amenities ~0.75 mi
Loading nearby amenities…
Taxation est. · year 1
- Rental income
- $30,558
- − Mortgage interest
- −$19,603
- − Property taxes
- −$705
- − Insurance
- −$1,750
- − Repairs & maintenance
- −$2,445
- − Management
- −$2,445
- − Depreciation
- −$10,180
- Taxable loss
- −$6,569
- Est. tax savings @ 24.0%
- +$1,577
- After-tax cash flow
- $1,240/yr
For passive investors: Depreciation is non-cash, so a rental often shows a tax loss while cash-flowing — sheltering income. Rental losses are passive: they offset passive income freely, and up to $25,000/yr can offset ordinary (W-2) income if you actively participate and your MAGI is under $100k (phasing out to $0 by $150k); unused losses carry forward. On sale, claimed depreciation is recaptured at up to 25%, and gains may owe capital-gains tax (a 1031 exchange can defer both). Figures are a year-1 estimate at your 24.0% rate — not tax advice; consult a CPA.
Schools (NCES district)
- District
- Hayward Unified
- NCES district ID
- 0616740
- Math proficiency
- 25% ▼ -1.00%
- Reading proficiency
- 37% ▬ 0.00%
- Median HH income
- $65,326
- Composite
- 31.27/100
- National rank
- #11241
- State rank
- #935 of 1400 in CA
Livability — Hayward
- Score
- 75/100
- State rank
- #124
- US rank
- #4294
Category grades
Schools grade is shown separately in the Schools card above.
Census & demographics
- Census place
- Hayward, CA
- County
- Alameda County · 1,614,355 people
- City population
- 191,800
- Metro
- San Francisco-Oakland-Berkeley, CA
- Population (ZIP)
- 76,947
- Household income
- $107,785
- Rent vs Own
- Severe rent burden
- 2573.0
Population outlook (Alameda County) Hauer SSP2
- Today (2025)
- 1,928,884 people
- By 2030
- 2,069,146 · +7.3%
- By 2040
- 2,338,405 · +21.2%
- By 2050
- 2,586,608 · +34.1%
- By 2075
- 3,061,911 · +58.7%
- By 2100
- 3,234,133 · +67.7%
Race, ethnicity, and origin ACS 2023
- Neighborhood character
- Highly diverse neighborhood (Simpson 0.70)
- Race & ethnicity
- Hispanic / Latino 45% Asian 28% Two or more races 13% White 11% Black 7% Pacific Islander 4% Native American 1%
- Hispanic origin (detail)
- Mexican 33% Puerto Rican 1%
- Common ancestry
- Russian 1% Italian 1% Lithuanian 1%
- Foreign-born
- 46% · Canada, China, Vietnam
- Languages at home
- 34% English-only · Spanish 37% Tagalog/Filipino 8% Other Indo-European 7%
Political lean MEDSL · Alameda
- 2024 margin
- Solid D (+53.6) · D 74.6% · R 21.0% · Other 4.4%
- 2008→2024 swing
- -5.9pp toward R · 2008: 59.5pp · 2024: 53.6pp
- All cycles
- 2024: D+53.6 2020: D+62.5 2016: D+64.4 2012: D+59.8 2008: D+59.5
Not yet ingested
- Civics
- —
Market trends
- HPI YoY
- ▼ -907.12%
- Current HPI
- 315.6082
- Rent YoY
- ▲ 2.58%
- Metro
- San Francisco-Oakland-Berkeley, CA
- State GDP YoY
- ▲ 3.21%
- F500 in state
- 116
Industry mix (Fortune 500 HQ in CA)
| Industry | F500 HQs | Revenue |
|---|---|---|
| Technology | 27 | $1,492B |
|
||
| Financial Services | 3 | $174B |
|
||
| Retail | 3 | $44B |
|
||
| Insurance | 3 | $26B |
|
||
| Media / Entertainment | 2 | $115B |
|
||
| Pharmaceuticals / Biotech | 2 | $62B |
|
||
Price history
1 event — show timeline
- 2026-06-02 Listed $349,950 bridgeMLS, Bay East AOR, or Contra Costa AOR
Property tax history
-0.2%/yrLatest (2025): $705 · -1.7% YoY. Source: county tax records.
Cash-flow waterfall
monthlySold comps — $/sqft
last 12 mo · ≤1 miLoading sold comps…