61 Hamms Rocky Hl · Front Royal, VA
Flood risk 8/10 · Major
- FEMA flood zone
- X (unshaded)
- Chance of flooding over 30 yrs
- 0.99%
- Est. flood insurance / yr
- $473 – $860
Fire risk 4/10 · Minor
- Est. fire insurance / yr
- $666 – $1,236
Heat risk 5/10 · Moderate
- Hot days now (above 98°F)
- 8 days/yr
- Hot days in 30 yrs
- 19 days/yr
Wind risk 2/10 · Minimal
- Chance of severe wind over 30 yrs
- 1.0%
Air-quality risk 2/10 · Minimal
- Unhealthy air days now
- 0 days/yr
- Unhealthy air days in 30 yrs
- 1 days/yr
Risk factors via First Street. Map © Google.
Why this score? — see what drove the C+ grade
The composite is a weighted blend of 9 inputs, each scored 0–100. Each bar is that input's sub-score; the figure is the points it added to the 100-point composite (weight × sub-score).
- Cash flow +20.4/30.0
- ARV discount +15.0/15.0
- DSCR +6.5/10.0
- Schools +4.9/10.0
- Rent growth +4.6/5.0
- 1% rule +4.4/10.0
- Livability +3.7/5.0
- Condition / age +2.5/5.0
- Appreciation +0.0/10.0
$180,000
🖨 Deal sheet 📄 Offer letter ✓ Due diligence
Listing remarks MLS
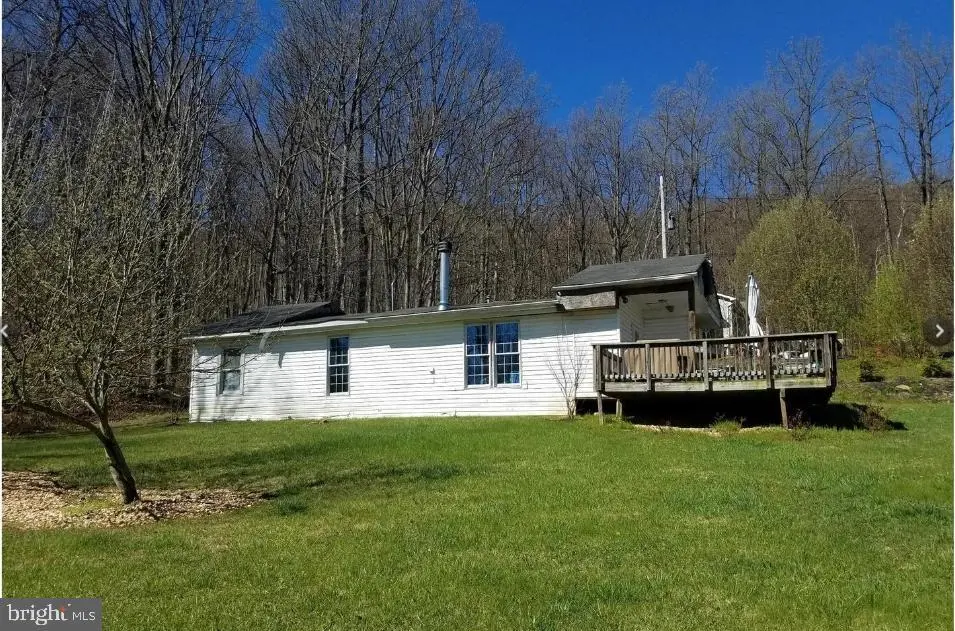
Bring your vision to this incredible 1.03-acre lot boasting panoramic mountain views and a prime location in the heart of Front Royal. This property is being sold "AS IS WHERE IS" and is a prime candidate for a custom new build or a total renovation project. The true value lies in the expansive, open land and impressive exterior additions, including a custom-made, extra-large detached 2-car garage and a storage shed. Zoned A-1, offering flexibility for agricultural pursuits or expanded accessory structures. Location Highlights: Commuter Friendly: Just minutes from I-66 and I-81, providing easy access to Northern Virginia and Winchester. Outdoor Paradise: Situated near the entrance of Shenandoah National Park (Skyline Drive) and the Shenandoah River for world-class hiking, fishing, and kayaking. Local Amenities: Close to the charming shops and dining of Historic Downtown Front Royal. This is a rare opportunity to secure a high-potential investment or build your dream home with a view. Sold strictly AS-IS. Shared septic in place; no well on-site. A rare "blank canvas" opportunity for investors and dream-home builders alike!
Key facts
- Zoned a-1
- Storage shed
- 1.03-acre lot
Tags
Neighborhood map
What this means for you Summary
Snapshot
- This is a 2-bed/1.0-bath single-family listed at $180k.
Deal economics
- At list price, monthly cash flow is $178 ($2k/yr) — positive.
- The deal already cash-flows at list — no discount required.
- To meet the 1% rule (rent ≥ 1% of price), the offer needs to be $169k (6.4% below list).
- Recommended offer: $169k (6.4% below list) — sets the bar for 1% rule.
- Cap rate 7.8% vs local median 3.6% in Front Royal — top-decile yield for the area; either an underpriced asset or a hidden risk that comps aren't pricing in. Stress-test before assuming the spread holds.
Location & tenants
- Location reads 73/100 on livability (#162 in VA) — a middle-class / working-renter tenant base. Strengths: health & safety A+, housing A, cost of living B+; Watch: commute F, employment D-.
- Warren County Public School District (town): math 49% / reading 64% proficiency, ranked #70 of 131 in VA (top 53%) — acceptable for families but not a draw, mixed tenant base, ~2y average lease.
- Market conditions: Rents rising fast (+8.3%/yr); 280 active listings in the ZIP; solid renter incomes; 170 units permitted in Warren County in 2024 (0 in 5+ unit buildings).
Forward outlook
- Local home prices are declining (-3.0%/yr); year-one equity from $1k of loan paydown is wiped out by about $5k of value loss. Plan a longer hold.
- Warren County population projected at +8% by 2050 — modest demand growth; plan on rents tracking national, not racing it.
- At projected returns (-3.0% appreciation + 8.0% rent growth), your $50k cash investment doubles in ~10 years — after that, you're playing with house money.
Negotiation context
- It's been on market 73 days — a 6% lower offer ($169k) is reasonable based on typical stale-listing flexibility.
- 8 sale attempts since 12y ago with the ask held roughly flat each time — persistent listings suggest the price (not the market) is what's stuck; bring a comps-based counter.
- Current owner paid $32k; list at $180k implies a 454% gain — meaningful room to come down on a strong offer.
Risks & watch-outs
- Watch-outs: flood insurance adds $56/mo.
- Climate carrying-cost: severe flood risk; extreme-heat days projected 8→19/yr by 2055 (HVAC capex compounding) — expect insurance premiums to compound above CPI over the hold.
Questions for the listing agent
- It's been on market 73 days. Have you received any prior offers? Is the seller open to a 6% concession, seller financing, or rate buy-down credit?
- Built in 1970 — when were the roof, HVAC, electrical panel, plumbing, and water heater last replaced?
- What's the actual annual flood-insurance premium (NFIP or private), and is the property in a SFHA with mandatory coverage?
- Why hasn't it sold? Are there any deal-killer items the seller is aware of (foundation, flood, title, zoning, code violations)?
- Is there a deadline driving the sale (1031 exchange, divorce, estate, relocation)? That informs how much negotiation room exists.
- Schools are B-rated — typically a magnet for longer-tenancy family renters. What's the average tenant stay here, and is there a school-zone premium baked into asking?
- What's the average days-on-market for RENTAL listings here right now (not sales)? A rising rental-DOM trend means longer vacancies and softer asking-rent achievability than the comps imply.
- What's the recent tenant-quality profile in this submarket — average credit score on applications, eviction rate, late-payment / NSF rate, and stable-employment percentage? A property-management company in the area should have these aggregated.
- How much new for-sale + rental construction is in the pipeline within 1–3 miles? Heavy new supply typically softens prices + rents 12–24 months out; constrained supply supports both.
Investment metrics
- 1% rule
- 0.94% ✗
- Cap rate
- 7.85%
- Cash-on-cash
- 5.55%
- DSCR
- 1.25
- GRM
- 8.9
CMA / ARV
- ARV (median comp)
- $324,261
- List price
- $180,000
- Delta
- -44.49%
- Verdict
- UNDERPRICED
- Comps
- 2 within 1.0 mi
Projected returns pro-forma
-3.0% appreciation · 8.0% rent growth · sell at horizon
- IRR
- -4.5%
- Equity multiple
- 0.82×
- Total profit
- $-8,972
- Equity at exit
- $26,839
- IRR
- 10.0%
- Equity multiple
- 1.94×
- Total profit
- $47,183
- Equity at exit
- $15,563
Cash invested: $50,400 (down + closing). Projections, not guarantees.
Landlord ↔ Tenant lean methodology
- Overall (STATE)
- 55 Moderately Landlord-Leaning
- State Virginia
- 55 Moderately Landlord-Leaning · D+2
- County
- — inherits STATE
- City
- — inherits STATE
ZIP-level market 22630
- Home prices YoY
- -27.1%
- Rents YoY
- 8.3%
- Active inventory
- 280
- Price-to-rent
- 8.9×
Monthly cashflow live
- Estimated rent
- $1,686 medium interval (Pro) →
- Mortgage (P&I)
- −$944
- Tax from tax record
- −$79 /mo · $953/yr
- Insurance
- −$75
- Flood insurance flood zone
- −$56 /mo · $666/yr
- HOA
- −$0
- Vacancy / Maint / Mgmt
- −$354
- Net cashflow
- $178
Break-even live
UW: 25.0% down · 7.5% · 30yr · 1.5% tax · 5.0% vac · 8.0% maint · 8.0% mgmt
Financing live
Cash to close
- Down payment
- $45,000
- Closing costs
- $5,400
- Reserves months
- —
- Total cash needed
- —
Loan-product check · same deal, 3 products live
Conventional
25% down · 7.5% · 30yr
- Down + closing
- —
- Monthly P&I
- —
- Monthly cashflow
- —
- DSCR
- —
- Eligible?
- —
Personal DTI + credit; lowest rate.
DSCR
20% down · 8.5% · 30yr
- Down + closing
- —
- Monthly P&I
- —
- Monthly cashflow
- —
- DSCR
- —
- Eligible?
- —
No personal income docs; deal must DSCR.
Hard money
10% down · 12.0% · 12mo
- Down + closing
- —
- Monthly P&I
- —
- Monthly cashflow
- —
- DSCR
- —
- Eligible?
- —
Short-term bridge; refi at stabilization.
Listing history 34 events
-
2026-06-18days on market $180,000 Active 73 DOM
-
2026-06-17days on market $180,000 Active 72 DOM
-
2026-06-16days on market $180,000 Active 71 DOM
-
2026-06-15days on market $180,000 Active 70 DOM
-
2026-06-13days on market $180,000 Active 68 DOM
-
2026-06-09days on market $180,000 Active 64 DOM
-
2026-06-08days on market $180,000 Active 63 DOM
-
2026-06-07days on market $180,000 Active 62 DOM
-
2026-06-04days on market $180,000 Active 59 DOM
-
2026-06-03days on market $180,000 Active 58 DOM
-
2026-06-02days on market $180,000 Active 57 DOM
-
2026-06-01days on market $180,000 Active 56 DOM
-
2026-05-31days on market $180,000 Active 55 DOM
-
2026-04-06$180,000 Active 1159-char remark
Show marketing remark (1159 chars)
Bring your vision to this incredible 1.03-acre lot boasting panoramic mountain views and a prime location in the heart of Front Royal. This property is being sold "AS IS WHERE IS" and is a prime candidate for a custom new build or a total renovation project. The true value lies in the expansive, open land and impressive exterior additions, including a custom-made, extra-large detached 2-car garage and a storage shed. Zoned A-1, offering flexibility for agricultural pursuits or expanded accessory structures. Location Highlights: Commuter Friendly: Just minutes from I-66 and I-81, providing easy access to Northern Virginia and Winchester. Outdoor Paradise: Situated near the entrance of Shenandoah National Park (Skyline Drive) and the Shenandoah River for world-class hiking, fishing, and kayaking. Local Amenities: Close to the charming shops and dining of Historic Downtown Front Royal. This is a rare opportunity to secure a high-potential investment or build your dream home with a view. Sold strictly AS-IS. Shared septic in place; no well on-site. A rare "blank canvas" opportunity for investors and dream-home builders alike!
-
2021-08-11historical
-
2021-05-11status Active
-
2021-05-03historical
-
2021-03-24price $99,000
-
2021-01-08$105,000 Active
-
2018-10-14historical
-
2018-02-24$100,000 Active
-
2017-09-04historical
-
2017-09-04historical Withdrawn
-
2017-05-16price
-
2017-04-09Active
-
2017-04-09$99,900
-
2014-03-25historical
-
2014-03-21soldstatus $32,500 Sold
-
2014-03-21soldstatus $32,500
-
2014-03-15status Contract
-
2014-03-14historical
-
2014-02-17price $39,900
-
2014-01-23$47,900 Active
-
2014-01-23$39,900
ⓘ Source: listings_history table (triggers on properties + properties_extension) + one-shot
backfill from property_details.listing_events for pre-trigger history.
Tax reassessment forecast VA · Resets to sale price
- Current annual tax
- $953 · $79/mo
- Projected year-2 tax
- $1,476 · $123/mo
- Expected delta
- +$523/yr (+$44/mo · 54.8%)
ⓘ Screening estimate from a state-policy table — verify with the county assessor before closing.
Climate risk First Street
- Flood 8/10 Severe FEMA zone X (unshaded) · 99% chance over 30 yrs
- Wildfire 4/10 Moderate
- Heat 5/10 Major 8 d/yr ≥98°F today · 19 d/yr by 30 yrs out
- Wind 2/10 Low 100% chance of damaging wind over 30 yrs
- Air quality 2/10 Low 0 unhealthy d/yr today · 1 by 30 yrs out
Nearby sold comps map
Loading sold comps map…
Walkable amenities ~0.75 mi
Loading nearby amenities…
Taxation est. · year 1
- Rental income
- $20,227
- − Mortgage interest
- −$10,083
- − Property taxes
- −$953
- − Insurance
- −$1,566
- − Repairs & maintenance
- −$1,618
- − Management
- −$1,618
- − Depreciation
- −$5,236
- Taxable loss
- −$848
- Est. tax savings @ 24.0%
- +$204
- After-tax cash flow
- $2,336/yr
For passive investors: Depreciation is non-cash, so a rental often shows a tax loss while cash-flowing — sheltering income. Rental losses are passive: they offset passive income freely, and up to $25,000/yr can offset ordinary (W-2) income if you actively participate and your MAGI is under $100k (phasing out to $0 by $150k); unused losses carry forward. On sale, claimed depreciation is recaptured at up to 25%, and gains may owe capital-gains tax (a 1031 exchange can defer both). Figures are a year-1 estimate at your 24.0% rate — not tax advice; consult a CPA.
Schools (NCES district)
- District
- Warren County Public School District
- NCES district ID
- 5103870
- Math proficiency
- 49% ▼ -29.00%
- Reading proficiency
- 64% ▼ -10.00%
- Median HH income
- $61,504
- Composite
- 49.22/100
- National rank
- #2039
- State rank
- #70 of 131 in VA
Livability — Front Royal
- Score
- 73/100
- State rank
- #162
- US rank
- #5050
Category grades
Schools grade is shown separately in the Schools card above.
Census & demographics
- County
- Warren County · 35,615 people
- City population
- 35,615
- Metro
- Washington-Arlington-Alexandria, DC-VA-MD-WV
- Population (ZIP)
- 35,615
- Household income
- $84,631
- Rent vs Own
- Severe rent burden
- 460.0
Population outlook (Warren County) Hauer SSP2
- Today (2025)
- 42,045 people
- By 2030
- 43,257 · +2.9%
- By 2040
- 45,088 · +7.2%
- By 2050
- 45,567 · +8.4%
- By 2075
- 46,081 · +9.6%
- By 2100
- 42,093 · +0.1%
Race, ethnicity, and origin ACS 2023
- Neighborhood character
- Predominantly White (81%)
- Race & ethnicity
- White 81% Hispanic / Latino 7% Black 6% Two or more races 5% Asian 2%
- Hispanic origin (detail)
- Mexican 1%
- Common ancestry
- Slovak 3% Lithuanian 2% Romanian 2%
- Foreign-born
- 6% · Canada
- Languages at home
- 92% English-only · Spanish 5% Other Indo-European 1%
Political lean MEDSL · Warren
- 2024 margin
- Solid R (+37.6) · D 30.6% · R 68.3% · Other 1.1%
- 2008→2024 swing
- -26.0pp toward R · 2008: -11.7pp · 2024: -37.6pp
- All cycles
- 2024: R+37.6 2020: R+35.3 2016: R+37.1 2012: R+20.5 2008: R+11.7
Not yet ingested
- Civics
- —
Market trends
- HPI YoY
- ▼ -118.82%
- Current HPI
- 319.8136
- Rent YoY
- ▲ 8.30%
- Metro
- Washington-Arlington-Alexandria, DC-VA-MD-WV
- State GDP YoY
- ▲ 2.40%
- F500 in state
- 50
Industry mix (Fortune 500 HQ in VA)
| Industry | F500 HQs | Revenue |
|---|---|---|
| Aerospace / Defense | 4 | $236B |
|
||
| Technology / Defense | 3 | $32B |
|
||
| Financial Services | 2 | $176B |
|
||
| Utilities | 2 | $27B |
|
||
| Insurance | 2 | $25B |
|
||
| Technology | 2 | $15B |
|
||
Price history
+351.1% since first listed21 events — show timeline
- 2026-04-06 Listed $180,000 BRIGHT MLS
- 2021-08-11 Listing Removed — BRIGHT MLS
- 2021-05-11 Relisted — BRIGHT MLS
- 2021-05-03 Listing Removed — BRIGHT MLS
- 2021-03-24 Price Changed $99,000 BRIGHT MLS
- 2021-01-08 Listed $105,000 BRIGHT MLS
- 2018-10-14 Listing Removed — BRIGHT MLS
- 2018-02-24 Listed $100,000 BRIGHT MLS
- 2017-09-04 Delisted — MRIS
- 2017-09-04 Listing Removed — BRIGHT MLS
- 2017-05-16 Price Changed — MRIS
- 2017-04-09 Listed — MRIS
- 2017-04-09 Listed $99,900 BRIGHT MLS
- 2014-03-25 Delisted — MRIS
- 2014-03-21 Sold (MLS) $32,500 BRIGHT MLS
- 2014-03-21 Sold (MLS) $32,500 MRIS
- 2014-03-15 Pending — MRIS
- 2014-03-14 Listing Removed — BRIGHT MLS
- 2014-02-17 Price Changed $39,900 MRIS
- 2014-01-23 Listed $47,900 MRIS
- 2014-01-23 Listed $39,900 BRIGHT MLS
Property tax history
+7.1%/yrLatest (2025): $953 · +56.4% YoY. Source: county tax records.
Cash-flow waterfall
monthlySold comps — $/sqft
last 12 mo · ≤1 miLoading sold comps…