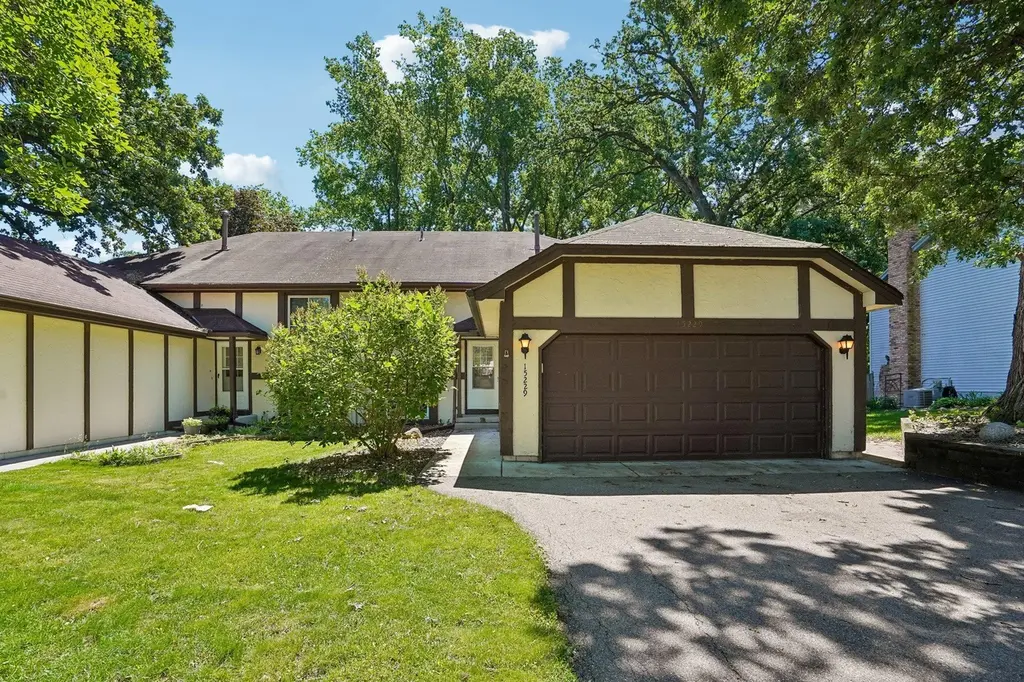
15229 Buchanan Ct · Eden Prairie, MN
Flood risk 1/10 · Minimal
- FEMA flood zone
- X (unshaded)
- Chance of flooding over 30 yrs
- 0.0%
- Est. flood insurance / yr
- $473 – $860
Fire risk 1/10 · Minimal
- Est. fire insurance / yr
- $888 – $1,650
Heat risk 2/10 · Minimal
- Hot days now (above 99°F)
- 7 days/yr
- Hot days in 30 yrs
- 14 days/yr
Wind risk 2/10 · Minimal
- Chance of severe wind over 30 yrs
- —
Air-quality risk 2/10 · Minimal
- Unhealthy air days now
- 1 days/yr
- Unhealthy air days in 30 yrs
- 2 days/yr
Risk factors via First Street. Map © Google.
Why this score? — see what drove the D grade
The composite is a weighted blend of 9 inputs, each scored 0–100. Each bar is that input's sub-score; the figure is the points it added to the 100-point composite (weight × sub-score).
- Cash flow +11.7/30.0
- ARV discount +7.5/15.0
- Schools +6.0/10.0
- Livability +4.2/5.0
- DSCR +3.5/10.0
- Rent growth +3.2/5.0
- 1% rule +2.9/10.0
- Condition / age +2.5/5.0
- Appreciation +0.0/10.0
$349,900
🖨 Deal sheet (PDF) 📄 Offer letter ✓ Due diligence
Listing remarks MLS
Wonderful Twinhome located on a private wooded lot in a quiet cul-de-sac. Enjoy the view from the spacious three season porch overlooking the nature and woods of Edenvale Park. Super convenient location. Everything you need within miles. Don't miss this one! No Association Fees. One year Home Warranty Included!
Key facts
- Large family room
- Updated twin home
- Private wooded lot
Tags
Property features AI
Finance
- Other: Lot about 0.17 acres (dimensions 48x169x38x169) on a public maintained city street
- HOA & community: No association fees (N/A)
Exterior
- Parking: Attached garage with garage door opener (2 car)
- Utilities: City water connected; City sewer connected; Natural gas
- Home design: Residential attached property; Split-entry (bi-level) home; Entry level and room levels on upper and lower floors
- Construction: Block and concrete construction materials; Block foundation; Roof older than 8 years
- Exterior features: Enclosed and rear porch; Patio; Metal, vinyl and wood exterior materials; Medium tree coverage
Interior
- Kitchen: Dishwasher; Disposal; Microwave; Range; Refrigerator; Stainless steel appliances
- Bedrooms: 4 bedrooms (upper and lower levels; primary bedrooms on upper level, additional bedrooms on lower level)
- Bathrooms: One full bath; One three-quarter bath (upper level)
- Heating & cooling: Forced air heating; Central air conditioning
- Interior features: Finished full walkout basement; Three-season porch; Eat-in kitchen / kitchen-dining room; Wood-burning fireplace
- Laundry & utility: Washer and dryer included; Washer/Dryer hookup; Laundry located on lower level
Neighborhood map
What this means for you Summary
Snapshot
- This is a 4-bed/2.5-bath single-family listed at $350k.
Deal economics
- At list price, monthly cash flow is $-100 ($-1k/yr) — negative.
- To cash-flow at today's rent, offer at most $332k (5.1% below list).
- To meet the 1% rule (rent ≥ 1% of price), the offer needs to be $275k (21.5% below list).
- Recommended offer: $275k (21.5% below list) — sets the bar for 1% rule.
- Cap rate 5.9% vs local median 2.7% in Eden Prairie — top-decile yield for the area; either an underpriced asset or a hidden risk that comps aren't pricing in. Stress-test before assuming the spread holds.
Location & tenants
- Location reads 85/100 on livability (#21 in MN, #575 nationally) — a professional / high-income tenant draw. Strengths: crime A+, commute A+, employment A+; Watch: amenities F, cost of living F.
- Eden Prairie Public School District (urban): math 61% / reading 70% proficiency, ranked #13 of 301 in MN (top 4%) — acceptable for families but not a draw, mixed tenant base, ~2y average lease; only 17% free/reduced lunch — higher-income household profile.
- Zoned schools: Eagle Heights Spanish Immersion (math 62% / reading 75%, grade B+, #91 of 857 statewide, top 11%, 715 students, 9% FRL); Central Middle School (math 55% / reading 69%, grade B+, #19 of 258 statewide, top 8%, 1,909 students, 30% FRL); Eden Prairie Senior High (math 61% / reading 71%, grade B, #24 of 471 statewide, top 5%, 2,833 students, 31% FRL).
- Market conditions: Rents rising (+2.7%/yr); 65 active listings in the ZIP; 4 comparable units currently listed for rent nearby; rentals at typical pace (median 20d on market — plan ~3-4 weeks tenant-placement turnaround); solid renter incomes; 4,651 units permitted in Hennepin County in 2024 (2,443 in 5+ unit buildings).
- This rent runs 37% of the median local income ($90k/yr) — at the standard rent-burdened threshold; future hikes will face affordability resistance.
Forward outlook
- Local home prices are declining (-3.0%/yr); year-one equity from $2k of loan paydown is wiped out by about $10k of value loss. Plan a longer hold.
- Hennepin County population projected at +30% by 2050 — long-run rental-demand tailwind backs the buy-and-hold thesis.
Negotiation context
- Only 3 days on market — expect competitive offers; lowballing is unlikely to land.
- 3 sale attempts since 28y ago; this cycle's ask is 67% above the opening price — seller raised mid-cycle; expect resistance to lowballs.
- Current owner paid $207k; list at $350k implies a 69% gain — meaningful room to come down on a strong offer.
Questions for the listing agent
- What do current leases actually rent for vs. the listed asking? Can we see a recent rent roll and the last 12 months of T-12 income?
- Built in 1979 — when were the roof, HVAC, electrical panel, plumbing, and water heater last replaced?
- Is there a deadline driving the sale (1031 exchange, divorce, estate, relocation)? That informs how much negotiation room exists.
- Schools are A-rated — typically a magnet for longer-tenancy family renters. What's the average tenant stay here, and is there a school-zone premium baked into asking?
- The area grade is low — what's the realistic commute time and amenity access for the typical tenant pool here? Any planned neighborhood developments (good or bad) we should know about?
- What's the average days-on-market for RENTAL listings here right now (not sales)? A rising rental-DOM trend means longer vacancies and softer asking-rent achievability than the comps imply.
- What's the recent tenant-quality profile in this submarket — average credit score on applications, eviction rate, late-payment / NSF rate, and stable-employment percentage? A property-management company in the area should have these aggregated.
- How much new for-sale + rental construction is in the pipeline within 1–3 miles? Heavy new supply typically softens prices + rents 12–24 months out; constrained supply supports both.
Investment metrics
- 1% rule
- 0.79% ✗
- Cap rate
- 5.95%
- Cash-on-cash
- -1.23%
- DSCR
- 0.95
- GRM
- 10.6
CMA / ARV
No comps found within radius.
Projected returns pro-forma
-3.0% appreciation · 2.69% rent growth · sell at horizon
- IRR
- -18.7%
- Equity multiple
- 0.35×
- Total profit
- $-63,981
- Equity at exit
- $52,171
- IRR
- -11.7%
- Equity multiple
- 0.31×
- Total profit
- $-67,610
- Equity at exit
- $30,253
Cash invested: $97,972 (down + closing). Projections, not guarantees.
Landlord ↔ Tenant lean methodology
- Overall (STATE)
- 46 Balanced
- State Minnesota
- 46 Balanced · D+2
- County
- — inherits STATE
- City
- — inherits STATE
ZIP-level market 55344
- Rents YoY
- 2.7%
- Active inventory
- 65
- Price-to-rent
- 10.6×
Monthly cashflow live
- Estimated rent
- $2,747 medium interval (Pro) →
- Mortgage (P&I)
- −$1,835
- Tax from tax record
- −$290 /mo · $3,479/yr
- Insurance
- −$146
- HOA
- −$0
- Vacancy / Maint / Mgmt
- −$577
- Net cashflow
- $-100
Break-even live
Sensitivity live
| Price | -10% $98 | -5% $-1 | +0% $-100 | +5% $-199 | +10% $-298 |
|---|---|---|---|---|---|
| Rent | -10% $-317 | -5% $-209 | +0% $-100 | +5% $8 | +10% $117 |
| Rate | -1.0pp $76 | -0.5pp $-11 | base $-100 | +0.5pp $-191 | +1.0pp $-283 |
UW: 25.0% down · 7.5% · 30yr · 1.5% tax · 5.0% vac · 8.0% maint · 8.0% mgmt
Financing live
Cash to close
- Down payment
- $87,475
- Closing costs
- $10,497
- Reserves months
- —
- Total cash needed
- —
Loan-product check · same deal, 3 products live
Conventional
25% down · 7.5% · 30yr
- Down + closing
- —
- Monthly P&I
- —
- Monthly cashflow
- —
- DSCR
- —
- Eligible?
- —
Personal DTI + credit; lowest rate.
DSCR
20% down · 8.5% · 30yr
- Down + closing
- —
- Monthly P&I
- —
- Monthly cashflow
- —
- DSCR
- —
- Eligible?
- —
No personal income docs; deal must DSCR.
Hard money
10% down · 12.0% · 12mo
- Down + closing
- —
- Monthly P&I
- —
- Monthly cashflow
- —
- DSCR
- —
- Eligible?
- —
Short-term bridge; refi at stabilization.
Rent comps 4 comps
| Address | Beds | Baths | Sqft | Rent | $/sqft | DOM | Units | Dist |
|---|---|---|---|---|---|---|---|---|
| 15598 Garfield Cir Eden Prairie, MN | 4.0 | 2.0 | 1600 | $2,995 | $1.87 | 20d | 1 | 0.30mi |
| 6718 Vermar Ter Eden Prairie, MN | 4.0 | 2.0 | 2100 | $2,800 | $1.33 | 45d | 1 | 1.02mi |
| 14030 Chestnut Dr Eden Prairie, MN | 1.0–3.0 | 1.0–2.0 | 1072 | $2,155 | $2.01 | 0d | 18 | 1.24mi |
| 13905 Chestnut Dr Eden Prairie, MN | 1.0–3.0 | 1.0–2.0 | 1035 | $2,316 | $2.24 | 0d | 28 | 1.38mi |
Listing history 3 events
-
2026-06-21statusdays on market $349,900 Active 3 DOM
-
2026-06-18remarks 693-char remark
-
2026-06-18$349,900 Coming Soon 1 DOM
ⓘ Source: listings_history table (triggers on properties + properties_extension) + one-shot
backfill from property_details.listing_events for pre-trigger history.
Tax reassessment forecast MN · Partial reset (capped growth)
- Current annual tax
- $3,479 · $290/mo
- Projected year-2 tax
- $3,699 · $308/mo
- Expected delta
- +$220/yr (+$18/mo · 6.3%)
ⓘ Screening estimate from a state-policy table — verify with the county assessor before closing.
Climate risk First Street
- Flood 1/10 Low FEMA zone X (unshaded) · 0% chance over 30 yrs
- Wildfire 1/10 Low
- Heat 2/10 Low 7 d/yr ≥99°F today · 14 d/yr by 30 yrs out
- Wind 2/10 Low
- Air quality 2/10 Low 1 unhealthy d/yr today · 2 by 30 yrs out
Nearby sold comps map
Loading sold comps map…
Walkable amenities ~0.75 mi
Loading nearby amenities…
Taxation est. · year 1
- Rental income
- $32,970
- − Mortgage interest
- −$19,600
- − Property taxes
- −$3,479
- − Insurance
- −$1,750
- − Repairs & maintenance
- −$2,638
- − Management
- −$2,638
- − Depreciation
- −$10,179
- Taxable loss
- −$7,313
- Est. tax savings @ 24.0%
- +$1,755
- After-tax cash flow
- $553/yr
For passive investors: Depreciation is non-cash, so a rental often shows a tax loss while cash-flowing — sheltering income. Rental losses are passive: they offset passive income freely, and up to $25,000/yr can offset ordinary (W-2) income if you actively participate and your MAGI is under $100k (phasing out to $0 by $150k); unused losses carry forward. On sale, claimed depreciation is recaptured at up to 25%, and gains may owe capital-gains tax (a 1031 exchange can defer both). Figures are a year-1 estimate at your 24.0% rate — not tax advice; consult a CPA.
Schools (NCES district)
- District
- Eden Prairie Public School District
- NCES district ID
- 2714220
- Math proficiency
- 61% ▼ -8.00%
- Reading proficiency
- 70% ▼ -3.00%
- Median HH income
- $95,212
- Composite
- 59.93/100
- National rank
- #879
- State rank
- #13 of 301 in MN
Livability — Eden Prairie
- Score
- 85/100
- State rank
- #21
- US rank
- #575
Category grades
Schools grade is shown separately in the Schools card above.
Census & demographics
- Census place
- Eden Prairie, MN
- County
- Hennepin County · 1,150,272 people
- City population
- 44,463
- Metro
- Minneapolis-St. Paul-Bloomington, MN-WI
- Population (ZIP)
- 14,034
- Household income
- $89,565
- Rent vs Own
- Severe rent burden
- 909.0
Population outlook (Hennepin County) Hauer SSP2
- Today (2025)
- 1,405,227 people
- By 2030
- 1,492,650 · +6.2%
- By 2040
- 1,660,157 · +18.1%
- By 2050
- 1,823,498 · +29.8%
- By 2075
- 2,221,283 · +58.1%
- By 2100
- 2,509,976 · +78.6%
Race, ethnicity, and origin ACS 2023
- Neighborhood character
- Diverse neighborhood (Simpson 0.64)
- Race & ethnicity
- White 54% Asian 21% Black 13% Hispanic / Latino 7% Two or more races 6%
- Hispanic origin (detail)
- Mexican 3%
- Common ancestry
- Portuguese 9% Romanian 3% Scottish 2%
- Foreign-born
- 24% · Canada, Jamaica, China
- Languages at home
- 68% English-only · Other Indo-European 9% Other Asian/Pacific 7% Spanish 5%
Political lean MEDSL · Hennepin
- 2024 margin
- Solid D (+42.6) · D 70.2% · R 27.5% · Other 2.3%
- 2008→2024 swing
- +14.0pp toward D · 2008: 28.6pp · 2024: 42.6pp
- All cycles
- 2024: D+42.6 2020: D+43.2 2016: D+35.3 2012: D+27.1 2008: D+28.6
Not yet ingested
- Civics
- —
Market trends
- HPI YoY
- ▼ -108.33%
- Current HPI
- 201.1272
- Rent YoY
- ▲ 2.69%
- Metro
- Minneapolis-St. Paul-Bloomington, MN-WI
- State GDP YoY
- ▲ 2.41%
- F500 in state
- 34
Industry mix (Fortune 500 HQ in MN)
| Industry | F500 HQs | Revenue |
|---|---|---|
| Healthcare | 2 | $407B |
|
||
| Retail | 2 | $150B |
|
||
| Consumer Goods | 2 | $32B |
|
||
| Industrial Machinery | 2 | $6B |
|
||
| Agriculture | 1 | $40B |
|
||
| Healthcare / Medical Devices | 1 | $32B |
|
||
Price history
+293.1% since first listed15 events — show timeline
- 2026-06-18 Coming Soon $349,900 NORTHSTARMLS as Distributed by MLS Grid
- 2016-05-23 Sold (Public Records) $207,450 Public Records
- 2016-05-19 Sold (MLS) $207,450 NORTHSTARMLS as Distributed by MLS Grid
- 2016-03-28 Pending — NORTHSTARMLS as Distributed by MLS Grid
- 2016-03-15 Contingent — NORTHSTARMLS as Distributed by MLS Grid
- 2016-03-11 Listed $209,900 NORTHSTARMLS as Distributed by MLS Grid
- 2010-06-08 Sold (Public Records) $175,000 Public Records
- 2010-05-27 Sold (MLS) $175,000 NORTHSTARMLS as Distributed by MLS Grid
- 2010-04-29 Listing Removed — NORTHSTARMLS as Distributed by MLS Grid
- 2010-04-09 Listed $179,900 NORTHSTARMLS as Distributed by MLS Grid
- 2001-10-17 Sold (Public Records) $172,900 Public Records
- 1999-05-03 Sold (Public Records) $117,000 Public Records
- 1998-09-16 Listing Removed — NORTHSTARMLS as Distributed by MLS Grid
- 1998-09-11 Listed $121,500 NORTHSTARMLS as Distributed by MLS Grid
- 1986-08-01 Sold (Public Records) $89,000 Public Records
Property tax history
+4.4%/yrLatest (2025): $3,479 · +3.1% YoY. Source: county tax records.
Cash-flow waterfall
monthlySold comps — $/sqft
last 12 mo · ≤1 miLoading sold comps…