307 North St · Westville, IL
Flood risk 1/10 · Minimal
- FEMA flood zone
- X (unshaded)
- Chance of flooding over 30 yrs
- 0.0%
- Est. flood insurance / yr
- $507 – $1,088
Fire risk 1/10 · Minimal
- Est. fire insurance / yr
- $804 – $1,492
Heat risk 3/10 · Minor
- Hot days now (above 104°F)
- 7 days/yr
- Hot days in 30 yrs
- 18 days/yr
Wind risk 2/10 · Minimal
- Chance of severe wind over 30 yrs
- 1.0%
Air-quality risk 2/10 · Minimal
- Unhealthy air days now
- 1 days/yr
- Unhealthy air days in 30 yrs
- 1 days/yr
Risk factors via First Street. Map © Google.
Why this score? — see what drove the B grade
The composite is a weighted blend of 9 inputs, each scored 0–100. Each bar is that input's sub-score; the figure is the points it added to the 100-point composite (weight × sub-score).
- Cash flow +30.0/30.0
- DSCR +10.0/10.0
- 1% rule +9.7/10.0
- ARV discount +7.5/15.0
- Appreciation +5.5/10.0
- Livability +3.5/5.0
- Rent growth +2.5/5.0
- Condition / age +2.5/5.0
- Schools +0.8/10.0
$49,900
🖨 Deal sheet (PDF) 📄 Offer letter ✓ Due diligence
Listing remarks MLS
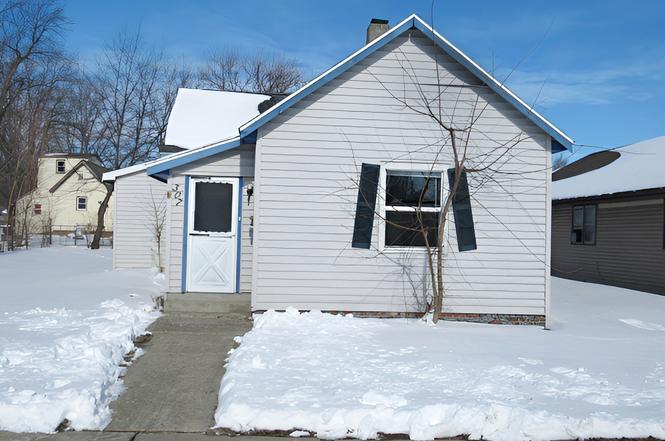
SPACIOUS 2 BEDROOM HOME. LARGE KITCHEN AND LARGE DINING ROOM. NEW ROOF ON HOUSE IN 2020. NEW ROOF ON GARAGE IN 2021 AND NEW WINDOWS IN HOUSE IN 2021. ENCLOSED FRONT PORCH. NEW PAINT AND THIS PROPERTY WILL LOOK GOOD AS NEW.
Key facts
- Large kitchen
- Spacious rooms
- Wood beamed ceiling
Tags
Neighborhood map
What this means for you Summary
Snapshot
- This is a 2-bed/1.0-bath single-family listed at $50k.
Deal economics
- At list price, monthly cash flow is $191 ($2k/yr) — positive.
- The deal already cash-flows at list — no discount required.
- Meets the 1% rule at list price ($732 rent vs $50k).
- Recommended offer: $48k (3.0% below list) — sets the bar for market timing.
Location & tenants
- Location reads 69/100 on livability (#404 in IL) — a middle-class / working-renter tenant base. Strengths: cost of living A+, housing A+, health & safety A+; Watch: employment D+, amenities F, commute F.
- Westville CUSD 2 (suburban): math 8% / reading 9% proficiency, ranked #590 of 620 in IL (top 95%) — low school quality limits family demand, transient renter base, plan for 1-2y turnover.
- Zoned schools: Judith Giacoma Elem School (math 8% / reading 9%, grade F, #1,617 of 2,056 statewide, top 79%, 671 students, 0% FRL); Westville Jr High School (math 8% / reading 8%, grade F, #612 of 665 statewide, top 93%, 177 students, 0% FRL); Westville High School (math 8% / reading 8%, grade F, #589 of 693 statewide, top 86%, 350 students, 0% FRL) — zoned schools average 0% FRL vs 54% district-wide (54 pts lower); this property's tenant base skews higher-income than the district average.
- Market conditions: 15 active listings in the ZIP; 3 comparable units currently listed for rent nearby; rentals at typical pace (median 14d on market — plan ~3-4 weeks tenant-placement turnaround); 8 units permitted in Vermilion County in 2024 (0 in 5+ unit buildings).
Forward outlook
- In year one you build about $848 of equity ($345 loan paydown + $503 appreciation (1.0% local appreciation)).
- Vermilion County population projected at -24% by 2050 — secular population decline; favor cash flow + early exit over multi-decade hold.
- At projected returns (1.0% appreciation + 3.0% rent growth), your $14k cash investment doubles in ~5 years — after that, you're playing with house money.
Negotiation context
- It's been on market 36 days — a 3% lower offer ($48k) is reasonable based on typical stale-listing flexibility.
- 4 sale attempts since 8y ago with the ask held roughly flat each time — persistent listings suggest the price (not the market) is what's stuck; bring a comps-based counter.
Risks & watch-outs
- Watch-outs: property tax is 2.5% of price; built in 1920 — expect roof / HVAC / electrical / plumbing capex.
Questions for the listing agent
- It's been on market 36 days. Have you received any prior offers? Is the seller open to a 3% concession, seller financing, or rate buy-down credit?
- Built in 1920 — when were the roof, HVAC, electrical panel, plumbing, and water heater last replaced?
- Property tax is high relative to price — has the assessment been appealed recently, and will the sale trigger a re-assessment?
- Is there a deadline driving the sale (1031 exchange, divorce, estate, relocation)? That informs how much negotiation room exists.
- Schools are F-rated, which usually means shorter tenancies and higher turnover. Who's the typical renter profile here, and what's been the actual vacancy rate?
- What's the average days-on-market for RENTAL listings here right now (not sales)? A rising rental-DOM trend means longer vacancies and softer asking-rent achievability than the comps imply.
- What's the recent tenant-quality profile in this submarket — average credit score on applications, eviction rate, late-payment / NSF rate, and stable-employment percentage? A property-management company in the area should have these aggregated.
- How much new for-sale + rental construction is in the pipeline within 1–3 miles? Heavy new supply typically softens prices + rents 12–24 months out; constrained supply supports both.
Investment metrics
- 1% rule
- 1.47% ✓
- Cap rate
- 10.88%
- Cash-on-cash
- 16.38%
- DSCR
- 1.73
- GRM
- 5.7
CMA / ARV
- ARV (on-the-fly)
- $104,500
- Comps found
- 12
Show comp detail 12 sales within ~0.75 mi
| Address | Dist | Beds/Ba | Sqft | Sold | Price | $/sf | Match |
|---|---|---|---|---|---|---|---|
| 121 Mckinley St | 0.18mi | 2/1.0 | 1,200 (+9%) | 4mo | $28,000 | $23 | 73 |
| 519 S State St | 0.48mi | 3/1.5 (+1) | 1,100 (0%) | 2mo | $105,000 | $95 | 69 |
| 219 S West St | 0.23mi | 3/1.0 (+1) | 1,160 (+6%) | 7mo | $142,500 | $123 | 69 |
| 113 N Scott St | 0.07mi | 3/1.0 (+1) | 1,206 (+10%) | 11mo | $125,000 | $104 | 67 |
| 121 S Walnut St | 0.37mi | 2/1.0 | 1,148 (+4%) | 10mo | $97,500 | $85 | 66 |
| 414 E Main St | 0.39mi | 2/1.0 | 1,200 (+9%) | 1mo | $90,000 | $75 | 66 |
| 214 W Park St | 0.46mi | 3/1.0 (+1) | 1,077 (-2%) | 5mo | $100,000 | $93 | 66 |
| 318 Pennsylvania Ave | 0.56mi | 2/1.0 | 1,074 (-2%) | 7mo | $98,500 | $92 | 64 |
| 130 N Jefferson St | 0.32mi | 2/1.0 | 985 (-10%) | 7mo | $102,500 | $104 | 62 |
| 227 N Jefferson St | 0.35mi | 2/1.0 | 1,212 (+10%) | 10mo | $115,000 | $95 | 58 |
| 216 Illinois Ave | 0.67mi | 3/1.0 (+1) | 988 (-10%) | 1mo | $109,000 | $110 | 46 |
| 320 Bridgett St | 0.55mi | 3/2.0 (+1) | 1,196 (+9%) | 9mo | $114,900 | $96 | 43 |
Match score weights: distance 35% · size 25% · config 20% · recency 20%. Top-matched comps best support the ARV.
Projected returns pro-forma
1.01% appreciation · 3.0% rent growth · sell at horizon
- IRR
- 18.4%
- Equity multiple
- 1.94×
- Total profit
- $13,131
- Equity at exit
- $17,054
- IRR
- 21.6%
- Equity multiple
- 3.62×
- Total profit
- $36,614
- Equity at exit
- $22,677
Cash invested: $13,972 (down + closing). Projections, not guarantees.
Landlord ↔ Tenant lean methodology
- Overall (STATE)
- 43 Moderately Tenant-Leaning
- State Illinois
- 43 Moderately Tenant-Leaning · D+7
- County
- — inherits STATE
- City
- — inherits STATE
ZIP-level market 61883
- Home prices YoY
- 0.4%
- Active inventory
- 15
- Price-to-rent
- 5.7×
Monthly cashflow live
- Estimated rent
- $732 medium interval (Pro) →
- Mortgage (P&I)
- −$262
- Tax from tax record
- −$105 /mo · $1,261/yr
- Insurance
- −$21
- HOA
- −$0
- Vacancy / Maint / Mgmt
- −$154
- Net cashflow
- $191
Break-even live
Sensitivity live
| Price | -10% $219 | -5% $205 | +0% $191 | +5% $177 | +10% $162 |
|---|---|---|---|---|---|
| Rent | -10% $133 | -5% $162 | +0% $191 | +5% $220 | +10% $248 |
| Rate | -1.0pp $216 | -0.5pp $203 | base $191 | +0.5pp $178 | +1.0pp $165 |
UW: 25.0% down · 7.5% · 30yr · 1.5% tax · 5.0% vac · 8.0% maint · 8.0% mgmt
Financing live
Cash to close
- Down payment
- $12,475
- Closing costs
- $1,497
- Reserves months
- —
- Total cash needed
- —
Loan-product check · same deal, 3 products live
Conventional
25% down · 7.5% · 30yr
- Down + closing
- —
- Monthly P&I
- —
- Monthly cashflow
- —
- DSCR
- —
- Eligible?
- —
Personal DTI + credit; lowest rate.
DSCR
20% down · 8.5% · 30yr
- Down + closing
- —
- Monthly P&I
- —
- Monthly cashflow
- —
- DSCR
- —
- Eligible?
- —
No personal income docs; deal must DSCR.
Hard money
10% down · 12.0% · 12mo
- Down + closing
- —
- Monthly P&I
- —
- Monthly cashflow
- —
- DSCR
- —
- Eligible?
- —
Short-term bridge; refi at stabilization.
Rent comps 3 comps
| Address | Beds | Baths | Sqft | Rent | $/sqft | DOM | Units | Dist |
|---|---|---|---|---|---|---|---|---|
| 215 Cook St Westville, IL | 1.0 | 1.0 | 700 | $650 | $0.93 | 14d | 1 | 0.09mi |
| 3 Church St Westville, IL | 3.0 | 1.0 | 1100 | $995 | $0.90 | 14d | 1 | 0.68mi |
| 220 Kentucky Ave Westville, IL | 2.0 | 1.0 | 900 | $875 | $0.97 | 5d | 1 | 0.89mi |
Listing history 11 events
-
2026-03-18status Pending
-
2026-01-30$49,900 Active
-
2022-05-17soldstatus $55,000
-
2022-05-16soldstatus $55,000 224-char remark
Show marketing remark (227 chars)
SPACIOUS 2 BEDROOM HOME. LARGE KITCHEN AND LARGE DINING ROOM. NEW ROOF ON HOUSE IN 2020. NEW ROOF ON GARAGE IN 2021 AND NEW WINDOWS IN HOUSE IN 2021. ENCLOSED FRONT PORCH. NEW PAINT AND THIS PROPERTY WILL LOOK GOOD AS NEW.
-
2022-05-16soldstatus $55,000 227-char remark
Show marketing remark (227 chars)
SPACIOUS 2 BEDROOM HOME. LARGE KITCHEN AND LARGE DINING ROOM. NEW ROOF ON HOUSE IN 2020. NEW ROOF ON GARAGE IN 2021 AND NEW WINDOWS IN HOUSE IN 2021. ENCLOSED FRONT PORCH. NEW PAINT AND THIS PROPERTY WILL LOOK GOOD AS NEW.
-
2021-10-25$55,000 224-char remark
Show marketing remark (227 chars)
SPACIOUS 2 BEDROOM HOME. LARGE KITCHEN AND LARGE DINING ROOM. NEW ROOF ON HOUSE IN 2020. NEW ROOF ON GARAGE IN 2021 AND NEW WINDOWS IN HOUSE IN 2021. ENCLOSED FRONT PORCH. NEW PAINT AND THIS PROPERTY WILL LOOK GOOD AS NEW.
-
2021-10-25$55,000 227-char remark
Show marketing remark (227 chars)
SPACIOUS 2 BEDROOM HOME. LARGE KITCHEN AND LARGE DINING ROOM. NEW ROOF ON HOUSE IN 2020. NEW ROOF ON GARAGE IN 2021 AND NEW WINDOWS IN HOUSE IN 2021. ENCLOSED FRONT PORCH. NEW PAINT AND THIS PROPERTY WILL LOOK GOOD AS NEW.
-
2018-03-23soldstatus $28,000
-
2018-02-22$39,900
-
1994-05-04soldstatus $10,000
-
1990-03-23soldstatus $7,000
ⓘ Source: listings_history table (triggers on properties + properties_extension) + one-shot
backfill from property_details.listing_events for pre-trigger history.
Tax reassessment forecast IL · Partial reset (capped growth)
- Current annual tax
- $1,261 · $105/mo
- Projected year-2 tax
- $1,261 · $105/mo
- Expected delta
- $0/yr ($0/mo · 0.0%)
ⓘ Screening estimate from a state-policy table — verify with the county assessor before closing.
Climate risk First Street
- Flood 1/10 Low FEMA zone X (unshaded) · 0% chance over 30 yrs
- Wildfire 1/10 Low
- Heat 3/10 Moderate 7 d/yr ≥104°F today · 18 d/yr by 30 yrs out
- Wind 2/10 Low 100% chance of damaging wind over 30 yrs
- Air quality 2/10 Low 1 unhealthy d/yr today · 1 by 30 yrs out
Nearby sold comps map
Loading sold comps map…
Walkable amenities ~0.75 mi
Loading nearby amenities…
Taxation est. · year 1
- Rental income
- $8,782
- − Mortgage interest
- −$2,795
- − Property taxes
- −$1,261
- − Insurance
- −$250
- − Repairs & maintenance
- −$703
- − Management
- −$703
- − Depreciation
- −$1,452
- Taxable income
- $1,620
- Est. tax owed @ 24.0%
- −$389
- After-tax cash flow
- $1,899/yr
For passive investors: Depreciation is non-cash, so a rental often shows a tax loss while cash-flowing — sheltering income. Rental losses are passive: they offset passive income freely, and up to $25,000/yr can offset ordinary (W-2) income if you actively participate and your MAGI is under $100k (phasing out to $0 by $150k); unused losses carry forward. On sale, claimed depreciation is recaptured at up to 25%, and gains may owe capital-gains tax (a 1031 exchange can defer both). Figures are a year-1 estimate at your 24.0% rate — not tax advice; consult a CPA.
Schools (NCES district)
- District
- Westville CUSD 2
- NCES district ID
- 1710820
- Math proficiency
- 8% ▼ -4.00%
- Reading proficiency
- 9% ▼ -4.00%
- Median HH income
- $41,214
- Composite
- 7.54/100
- National rank
- #9949
- State rank
- #590 of 620 in IL
Livability — Westville
- Score
- 69/100
- State rank
- #404
- US rank
- #8382
Category grades
Schools grade is shown separately in the Schools card above.
Census & demographics
- Census place
- Westville, IL
- City population
- 4,424
- Population (ZIP)
- 4,424
Population outlook (Vermilion County) Hauer SSP2
- Today (2025)
- 72,775 people
- By 2030
- 69,235 · -4.9%
- By 2040
- 62,360 · -14.3%
- By 2050
- 55,539 · -23.7%
- By 2075
- 40,606 · -44.2%
- By 2100
- 26,985 · -62.9%
Race, ethnicity, and origin ACS 2023
- Neighborhood character
- Predominantly White (95%)
- Race & ethnicity
- White 95% Two or more races 2% Hispanic / Latino 1%
- Common ancestry
- Romanian 4% Lithuanian 3% Slovak 2%
- Foreign-born
- 1%
- Languages at home
- 98% English-only · Spanish 2%
Political lean MEDSL · Vermilion
- 2024 margin
- Solid R (+35.7) · D 31.4% · R 67.0% · Other 1.6%
- 2008→2024 swing
- -36.2pp toward R · 2008: 0.6pp · 2024: -35.7pp
- All cycles
- 2024: R+35.7 2020: R+32.9 2016: R+29.2 2012: R+15.7 2008: D+0.6
Not yet ingested
- Civics
- —
Market trends
- HPI YoY
- ▲ 1.01%
- Current HPI
- 230.8944
- Rent YoY
- —
- Metro
- —
- State GDP YoY
- ▲ 1.59%
- F500 in state
- 60
Industry mix (Fortune 500 HQ in IL)
| Industry | F500 HQs | Revenue |
|---|---|---|
| Insurance | 4 | $201B |
|
||
| Consumer Goods | 4 | $87B |
|
||
| Industrial Machinery | 3 | $64B |
|
||
| Healthcare | 2 | $55B |
|
||
| Retail / Pharmacy | 1 | $148B |
|
||
| Agriculture / Food | 1 | $86B |
|
||
Price history
+612.9% since first listed11 events — show timeline
- 2026-03-18 Pending — MRED as Distributed by MLS Grid
- 2026-01-30 Listed $49,900 MRED as Distributed by MLS Grid
- 2022-05-17 Sold (Public Records) $55,000 Public Records
- 2022-05-16 Sold (MLS) $55,000 MRED as Distributed by MLS Grid
- 2022-05-16 Sold (MLS) $55,000 CIBR
- 2021-10-25 Listed $55,000 MRED as Distributed by MLS Grid
- 2021-10-25 Listed $55,000 CIBR
- 2018-03-23 Sold (MLS) $28,000 CIBR
- 2018-02-22 Listed $39,900 CIBR
- 1994-05-04 Sold (Public Records) $10,000 Public Records
- 1990-03-23 Sold (Public Records) $7,000 Public Records
Property tax history
-0.4%/yrLatest (2024): $1,261 · +12.5% YoY. Source: county tax records.
Cash-flow waterfall
monthlySold comps — $/sqft
last 12 mo · ≤1 miLoading sold comps…