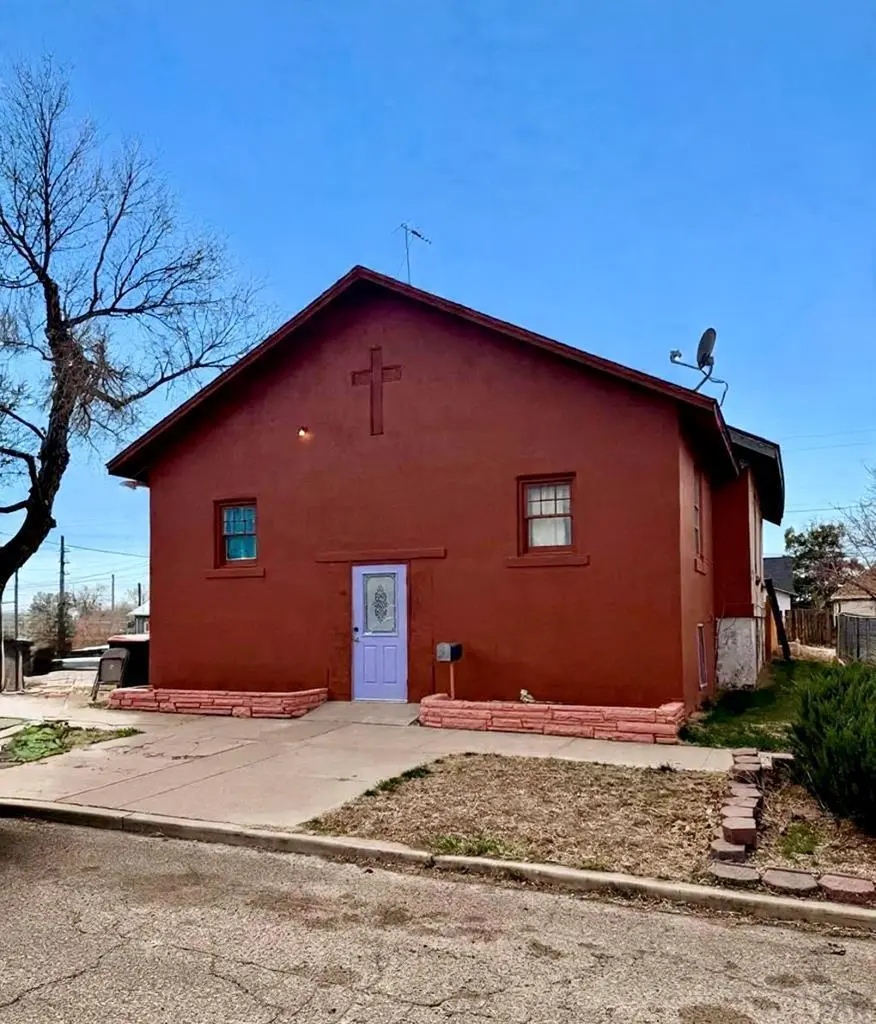
322 Lincoln Ave · La Junta, CO
Flood risk 1/10 · Minimal
- FEMA flood zone
- X
- Chance of flooding over 30 yrs
- 0.0%
- Est. flood insurance / yr
- $473 – $860
Fire risk 7/10 · Major
- Est. fire insurance / yr
- $939 – $1,743
Heat risk 4/10 · Minor
- Hot days now (above 99°F)
- 7 days/yr
- Hot days in 30 yrs
- 20 days/yr
Wind risk 2/10 · Minimal
- Chance of severe wind over 30 yrs
- —
Air-quality risk 2/10 · Minimal
- Unhealthy air days now
- 1 days/yr
- Unhealthy air days in 30 yrs
- 2 days/yr
Risk factors via First Street. Map © Google.
Why this score? — see what drove the D+ grade
The composite is a weighted blend of 9 inputs, each scored 0–100. Each bar is that input's sub-score; the figure is the points it added to the 100-point composite (weight × sub-score).
- ARV discount +15.0/15.0
- Cash flow +12.8/30.0
- DSCR +3.8/10.0
- 1% rule +3.6/10.0
- Livability +3.4/5.0
- Rent growth +2.5/5.0
- Condition / age +2.5/5.0
- Schools +1.3/10.0
- Appreciation +0.0/10.0
$125,000
🖨 Deal sheet 📄 Offer letter ✓ Due diligence
Listing remarks
This former church has been thoughtfully transformed into a primary residence, offering character and flexibility you won't find anywhere else. Inside, you'll find up to five potential bedrooms, a dedicated workshop, and the choice between a cozy, intimate living area or an expansive great room—the very space where sermons were once held—perfect for hosting and creating unforgettable gatherings. The fully fenced backyard and open deck add even more room to entertain or unwind.
Key facts
- Open deck
- Dedicated workshop
- 5,009 sq ft lot
Tags
Property features AI
Finance
- Other: Zoning: R-1
- HOA & community: No association amenities
Exterior
- Parking: No garage
- Utilities: Public water; Public sewer
- Home design: Single-family residential; Frame construction
- Construction: Frame construction; Composition roof
- Exterior features: Deck; Wood fencing; Composition roof; Irregular lot
Interior
- Kitchen: Range; Oven; Refrigerator
- Bedrooms: 4 bedrooms on the main level
- Flooring: Carpet; Vinyl
- Bathrooms: 2 full bathrooms total; 1 bathroom on the main level
- Heating & cooling: Natural gas heating; Forced air heating; No cooling system
- Interior features: Master bedroom on main level; No fireplace listed
- Laundry & utility: Laundry on the main level
Neighborhood map
What this means for you Summary
Snapshot
- This is a 2-bed/1.0-bath single-family listed at $125k.
Deal economics
- At list price, monthly cash flow is $-11 ($-126/yr) — negative.
- To cash-flow at today's rent, offer at most $123k (1.2% below list).
- To meet the 1% rule (rent ≥ 1% of price), the offer needs to be $108k (13.6% below list).
- Recommended offer: $108k (13.6% below list) — sets the bar for 1% rule.
- Cap rate 6.2% vs local median 4.1% in La Junta — top-decile yield for the area; either an underpriced asset or a hidden risk that comps aren't pricing in. Stress-test before assuming the spread holds.
Location & tenants
- Location reads 67/100 on livability (#126 in CO) — a middle-class / working-renter tenant base. Strengths: cost of living A+, housing A+, health & safety A+; Watch: employment D+, schools F, crime F.
- East Otero School District No. R1 (town): math 7% / reading 26% proficiency, ranked #83 of 86 in CO (top 96%) — low school quality limits family demand, transient renter base, plan for 1-2y turnover; 65% free/reduced lunch — lower-income household profile, screen leases tightly.
- Market conditions: 84 active listings in the ZIP; 11 units permitted in Otero County in 2024 (0 in 5+ unit buildings).
Forward outlook
- Local home prices are declining (-3.0%/yr); year-one equity from $864 of loan paydown is wiped out by about $4k of value loss. Plan a longer hold.
- Otero County population projected at -17% by 2050 — secular population decline; favor cash flow + early exit over multi-decade hold.
Negotiation context
- It's been on market 94 days — a 9% lower offer ($114k) is reasonable based on typical stale-listing flexibility.
- Current owner paid $45k; list at $125k implies a 178% gain — meaningful room to come down on a strong offer.
Risks & watch-outs
- Climate carrying-cost: major wildfire risk — expect insurance premiums to compound above CPI over the hold.
Questions for the listing agent
- What do current leases actually rent for vs. the listed asking? Can we see a recent rent roll and the last 12 months of T-12 income?
- It's been on market 94 days. Have you received any prior offers? Is the seller open to a 14% concession, seller financing, or rate buy-down credit?
- Why hasn't it sold? Are there any deal-killer items the seller is aware of (foundation, flood, title, zoning, code violations)?
- Is there a deadline driving the sale (1031 exchange, divorce, estate, relocation)? That informs how much negotiation room exists.
- Schools are F-rated, which usually means shorter tenancies and higher turnover. Who's the typical renter profile here, and what's been the actual vacancy rate?
- Crime grade is F in this area — have there been break-ins, vandalism, or insurance claims at this property in the last 3 years? What carrier currently insures it and at what premium?
- The area grade is low — what's the realistic commute time and amenity access for the typical tenant pool here? Any planned neighborhood developments (good or bad) we should know about?
- What's the average days-on-market for RENTAL listings here right now (not sales)? A rising rental-DOM trend means longer vacancies and softer asking-rent achievability than the comps imply.
- What's the recent tenant-quality profile in this submarket — average credit score on applications, eviction rate, late-payment / NSF rate, and stable-employment percentage? A property-management company in the area should have these aggregated.
- How much new for-sale + rental construction is in the pipeline within 1–3 miles? Heavy new supply typically softens prices + rents 12–24 months out; constrained supply supports both.
Investment metrics
- 1% rule
- 0.86% ✗
- Cap rate
- 6.19%
- Cash-on-cash
- -0.36%
- DSCR
- 0.98
- GRM
- 9.6
CMA / ARV
- ARV (on-the-fly)
- $182,952
- Comps found
- 12
Show comp detail 12 sales within ~0.75 mi
| Address | Dist | Beds/Ba | Sqft | Sold | Price | $/sf | Match |
|---|---|---|---|---|---|---|---|
| 402 Lincoln Ave | 0.02mi | 3/2.0 (+1) | 1,508 (+4%) | 14mo | $80,000 | $53 | 72 |
| 822 Colorado Ave | 0.49mi | 2/2.0 | 1,452 (0%) | 5mo | $225,000 | $155 | 69 |
| 721 Carson Ave | 0.29mi | 1/1.0 (-1) | 1,468 (+1%) | 18mo | $184,500 | $126 | 64 |
| 410 Raton Ave | 0.43mi | 3/2.0 (+1) | 1,400 (-4%) | 2mo | $80,000 | $57 | 63 |
| 402 Hayes Ave | 0.39mi | 3/2.0 (+1) | 1,345 (-7%) | 17mo | $253,000 | $188 | 46 |
| 514 E 5th St | 0.74mi | 3/2.0 (+1) | 1,503 (+4%) | 14mo | $170,000 | $113 | 39 |
| 1006 Park Ave | 0.51mi | 3/2.0 (+1) | 1,654 (+14%) | 7mo | $204,000 | $123 | 38 |
| 709 Cimarron Ave | 0.59mi | 2/2.0 | 1,642 (+13%) | 10mo | $220,000 | $134 | 38 |
| 1118 W 11th St | 0.67mi | 3/2.0 (+1) | 1,291 (-11%) | 9mo | $247,000 | $191 | 34 |
| 904 Cimarron Ave | 0.63mi | 3/1.0 (+1) | 1,303 (-10%) | 18mo | $140,000 | $107 | 34 |
| 308 E 10th St | 0.74mi | 2/1.0 | 1,234 (-15%) | 15mo | $150,000 | $122 | 28 |
| 702 Smithland Ave | 0.62mi | 3/2.0 (+1) | 1,250 (-14%) | 16mo | $275,000 | $220 | 26 |
Match score weights: distance 35% · size 25% · config 20% · recency 20%. Top-matched comps best support the ARV.
Projected returns pro-forma
-3.0% appreciation · 3.0% rent growth · sell at horizon
- IRR
- -16.9%
- Equity multiple
- 0.40×
- Total profit
- $-20,909
- Equity at exit
- $18,638
- IRR
- -8.7%
- Equity multiple
- 0.46×
- Total profit
- $-19,004
- Equity at exit
- $10,808
Cash invested: $35,000 (down + closing). Projections, not guarantees.
Landlord ↔ Tenant lean methodology
- Overall (STATE)
- 38 Tenant-Leaning
- State Colorado
- 38 Tenant-Leaning · D+4
- County
- — inherits STATE
- City
- — inherits STATE
ZIP-level market 81050
- Active inventory
- 84
- Price-to-rent
- 9.6×
Monthly cashflow live
- Estimated rent
- $1,080 medium interval (Pro) →
- Mortgage (P&I)
- −$656
- Tax est. 1.5%
- −$156 /mo · $1,875/yr
- Insurance
- −$52
- HOA
- −$0
- Vacancy / Maint / Mgmt
- −$227
- Net cashflow
- $-11
Break-even live
UW: 25.0% down · 7.5% · 30yr · 1.5% tax · 5.0% vac · 8.0% maint · 8.0% mgmt
Financing live
Cash to close
- Down payment
- $31,250
- Closing costs
- $3,750
- Reserves months
- —
- Total cash needed
- —
Loan-product check · same deal, 3 products live
Conventional
25% down · 7.5% · 30yr
- Down + closing
- —
- Monthly P&I
- —
- Monthly cashflow
- —
- DSCR
- —
- Eligible?
- —
Personal DTI + credit; lowest rate.
DSCR
20% down · 8.5% · 30yr
- Down + closing
- —
- Monthly P&I
- —
- Monthly cashflow
- —
- DSCR
- —
- Eligible?
- —
No personal income docs; deal must DSCR.
Hard money
10% down · 12.0% · 12mo
- Down + closing
- —
- Monthly P&I
- —
- Monthly cashflow
- —
- DSCR
- —
- Eligible?
- —
Short-term bridge; refi at stabilization.
Listing history 17 events
-
2026-06-18days on market $125,000 Active 94 DOM
-
2026-06-17days on market $125,000 Active 93 DOM
-
2026-06-16days on market $125,000 Active 92 DOM
-
2026-06-15days on market $125,000 Active 91 DOM
-
2026-06-13days on market $125,000 Active 89 DOM
-
2026-06-12days on market $125,000 Active 88 DOM
-
2026-06-09days on market $125,000 Active 85 DOM
-
2026-06-08days on market $125,000 Active 84 DOM
-
2026-06-07days on market $125,000 Active 83 DOM
-
2026-06-07days on market $125,000 Active 82 DOM
-
2026-06-04days on market $125,000 Active 79 DOM
-
2026-06-02days on market $125,000 Active 78 DOM
-
2026-06-01days on market $125,000 Active 77 DOM
-
2026-05-31days on market $125,000 Active 76 DOM
-
2026-05-31days on market $125,000 Active 75 DOM
-
2026-03-16$125,000 Active
-
2012-10-12soldstatus $45,000
ⓘ Source: listings_history table (triggers on properties + properties_extension) + one-shot
backfill from property_details.listing_events for pre-trigger history.
Climate risk First Street
- Flood 1/10 Low FEMA zone X · 0% chance over 30 yrs
- Wildfire 7/10 Severe
- Heat 4/10 Moderate 7 d/yr ≥99°F today · 20 d/yr by 30 yrs out
- Wind 2/10 Low
- Air quality 2/10 Low 1 unhealthy d/yr today · 2 by 30 yrs out
Nearby sold comps map
Loading sold comps map…
Walkable amenities ~0.75 mi
Loading nearby amenities…
Taxation est. · year 1
- Rental income
- $12,962
- − Mortgage interest
- −$7,002
- − Property taxes
- −$1,875
- − Insurance
- −$625
- − Repairs & maintenance
- −$1,037
- − Management
- −$1,037
- − Depreciation
- −$3,636
- Taxable loss
- −$2,250
- Est. tax savings @ 24.0%
- +$540
- After-tax cash flow
- $414/yr
For passive investors: Depreciation is non-cash, so a rental often shows a tax loss while cash-flowing — sheltering income. Rental losses are passive: they offset passive income freely, and up to $25,000/yr can offset ordinary (W-2) income if you actively participate and your MAGI is under $100k (phasing out to $0 by $150k); unused losses carry forward. On sale, claimed depreciation is recaptured at up to 25%, and gains may owe capital-gains tax (a 1031 exchange can defer both). Figures are a year-1 estimate at your 24.0% rate — not tax advice; consult a CPA.
Schools (NCES district)
- District
- East Otero School District No. R1
- NCES district ID
- 0805130
- Math proficiency
- 7% ▼ -2.00%
- Reading proficiency
- 26% ▲ 5.00%
- Median HH income
- $33,475
- Composite
- 13.36/100
- National rank
- #9534
- State rank
- #83 of 86 in CO
Livability — La Junta
- Score
- 67/100
- State rank
- #126
- US rank
- #10703
Category grades
Schools grade is shown separately in the Schools card above.
Census & demographics
- Census place
- La Junta, CO
- Population (ZIP)
- 9,774
Population outlook (Otero County) Hauer SSP2
- Today (2025)
- 17,363 people
- By 2030
- 16,776 · -3.4%
- By 2040
- 15,534 · -10.5%
- By 2050
- 14,467 · -16.7%
- By 2075
- 12,054 · -30.6%
- By 2100
- 9,392 · -45.9%
Race, ethnicity, and origin ACS 2023
- Neighborhood character
- Diverse neighborhood (Simpson 0.57)
- Race & ethnicity
- White 52% Hispanic / Latino 40% Two or more races 10% Native American 2% Black 1%
- Hispanic origin (detail)
- Mexican 34%
- Common ancestry
- Lithuanian 2% Iranian 2% Slovak 2%
- Foreign-born
- 4% · Canada
- Languages at home
- 85% English-only · Spanish 14%
Political lean MEDSL · Otero
- 2024 margin
- Strong R (+26.4) · D 35.5% · R 61.9% · Other 2.7%
- 2008→2024 swing
- -15.9pp toward R · 2008: -10.5pp · 2024: -26.4pp
- All cycles
- 2024: R+26.4 2020: R+22.5 2016: R+25.2 2012: R+9.3 2008: R+10.5
Not yet ingested
- Civics
- —
Market trends
- HPI YoY
- ▼ -188.44%
- Current HPI
- 232.984
- Rent YoY
- —
- Metro
- —
- State GDP YoY
- ▲ 1.95%
- F500 in state
- 14
Industry mix (Fortune 500 HQ in CO)
| Industry | F500 HQs | Revenue |
|---|---|---|
| Technology Distribution | 1 | $31B |
|
||
| Food / Agriculture | 1 | $18B |
|
||
| Packaging | 1 | $14B |
|
||
| Healthcare | 1 | $13B |
|
||
| Energy | 1 | $10B |
|
||
| Technology | 1 | $4B |
|
||
Price history
+177.8% since first listed2 events — show timeline
- 2026-03-16 Listed $125,000 PARMLS
- 2012-10-12 Sold (Public Records) $45,000 Public Records
Property tax history
-9.7%/yrLatest (2024): $79 · -1.2% YoY. Source: county tax records.
Cash-flow waterfall
monthlySold comps — $/sqft
last 12 mo · ≤1 miLoading sold comps…