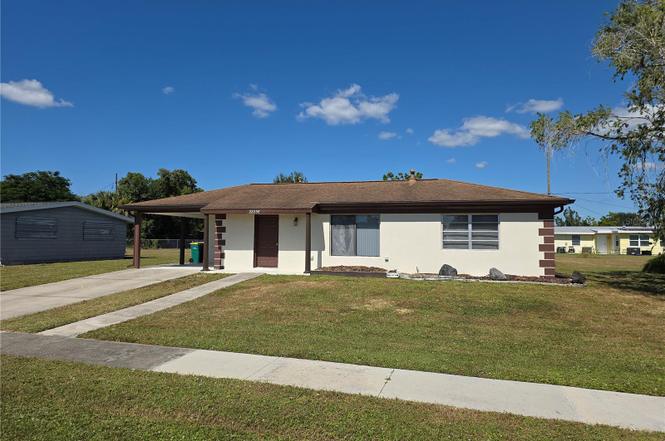
22236 Montrose Ave · Port Charlotte, FL
Flood risk 6/10 · Moderate
- FEMA flood zone
- X (shaded)
- Chance of flooding over 30 yrs
- 0.57%
- Est. flood insurance / yr
- $507 – $1,088
Fire risk 1/10 · Minimal
- Est. fire insurance / yr
- $947 – $1,759
Heat risk 10/10 · Severe
- Hot days now (above 107°F)
- 7 days/yr
- Hot days in 30 yrs
- 28 days/yr
Wind risk 10/10 · Severe
- Chance of severe wind over 30 yrs
- 99.0%
Air-quality risk 3/10 · Minor
- Unhealthy air days now
- 2 days/yr
- Unhealthy air days in 30 yrs
- 2 days/yr
Risk factors via First Street. Map © Google.
Why this score? — see what drove the B- grade
The composite is a weighted blend of 9 inputs, each scored 0–100. Each bar is that input's sub-score; the figure is the points it added to the 100-point composite (weight × sub-score).
- Cash flow +23.8/30.0
- ARV discount +15.0/15.0
- DSCR +7.7/10.0
- 1% rule +6.7/10.0
- Schools +4.6/10.0
- Livability +3.2/5.0
- Condition / age +2.5/5.0
- Rent growth +2.2/5.0
- Appreciation +0.0/10.0
$129,900
🖨 Deal sheet 📄 Offer letter ✓ Due diligence
Listing remarks MLS
CONVENIENT LOCATION. GREAT STARTER HOME, RETIREMENT HOME, OR INVESTMENT OPPORTUNITY. THIS IS A SHORT SALE. Listing price may not be sufficient to pay the total of all liens and costs of sale, and sale of Property at full listing price may require approval of seller's lender(s).
Key facts
- Spacious backyard
- 8,712 sq ft lot
- Parking
Tags
Property features AI
Finance
- Other: Property zoned RSF3.5
- Financial info: No lease restrictions
- HOA & community: No association or HOA listed; No association approval required
Exterior
- Parking: Carport (1 space)
- Utilities: Public water; Public sewer; Cable available; Electricity connected; Water connected
- Home design: Single family residence; Residential property; One story; Faces south
- Construction: Block and stucco construction; Shingle roof; Slab foundation; Built on a 0.2 acre lot
- Exterior features: Rain gutters; Sidewalk; Paved lot
Interior
- Kitchen: Range; Refrigerator; Electric water heater
- Bedrooms: 2 bedrooms
- Flooring: Tile
- Bathrooms: 1 full bathroom
- Heating & cooling: Central heating; Central air conditioning
- Interior features: Living room/dining room combo; Thermostat
- Laundry & utility: Washer; Dryer; Laundry located outside
Neighborhood map
What this means for you Summary
Snapshot
- This is a 3-bed/1.0-bath single-family listed at $130k.
Deal economics
- At list price, monthly cash flow is $250 ($3k/yr) — positive.
- The deal already cash-flows at list — no discount required.
- Meets the 1% rule at list price ($2k rent vs $130k).
- Recommended offer: $114k (12.0% below list) — sets the bar for market timing.
- Cap rate 8.6% vs local median 4.4% in Port Charlotte — top-decile yield for the area; either an underpriced asset or a hidden risk that comps aren't pricing in. Stress-test before assuming the spread holds.
Location & tenants
- Location reads 65/100 on livability (#655 in FL) — a middle-class / working-renter tenant base. Strengths: cost of living A+, housing A+; Watch: employment D, amenities F, commute F.
- Charlotte (suburban): math 54% / reading 54% proficiency, ranked #22 of 73 in FL (top 30%) — acceptable for families but not a draw, mixed tenant base, ~2y average lease.
- Zoned schools: Neil Armstrong Elementary School (math 66% / reading 63%, grade B, #525 of 2,144 statewide, top 26%, 780 students, 63% FRL); Port Charlotte High School (math 23% / reading 38%, grade F, #434 of 667 statewide, top 66%, 1,649 students, 43% FRL) — zoned schools at 53% FRL track the district average.
- Market conditions: Rents soft (-1.4%/yr); 707 active listings in the ZIP; 17 comparable units currently listed for rent nearby; rentals at typical pace (median 21d on market — plan ~3-4 weeks tenant-placement turnaround); 4,585 units permitted in Charlotte County in 2024 (703 in 5+ unit buildings).
Forward outlook
- Local home prices are declining (-3.0%/yr); year-one equity from $898 of loan paydown is wiped out by about $4k of value loss. Plan a longer hold.
- Charlotte County population projected at +24% by 2050 — long-run rental-demand tailwind backs the buy-and-hold thesis.
Negotiation context
- It's been on market 229 days — a 12% lower offer ($114k) is reasonable based on typical stale-listing flexibility.
- 4 sale attempts since 17y ago; this cycle's ask has dropped $50k (28%) from the opening price — seller is motivated, your offer sets the floor, not the list.
- Current owner paid $30k; list at $130k implies a 333% gain — meaningful room to come down on a strong offer.
Risks & watch-outs
- Climate carrying-cost: major flood risk; severe wind risk, 99% chance of damaging wind over 30y; extreme-heat days projected 7→28/yr by 2055 (HVAC capex compounding) — expect insurance premiums to compound above CPI over the hold.
Questions for the listing agent
- It's been on market 229 days. Have you received any prior offers? Is the seller open to a 12% concession, seller financing, or rate buy-down credit?
- Built in 1965 — when were the roof, HVAC, electrical panel, plumbing, and water heater last replaced?
- Why hasn't it sold? Are there any deal-killer items the seller is aware of (foundation, flood, title, zoning, code violations)?
- Is there a deadline driving the sale (1031 exchange, divorce, estate, relocation)? That informs how much negotiation room exists.
- Schools are D-rated, which usually means shorter tenancies and higher turnover. Who's the typical renter profile here, and what's been the actual vacancy rate?
- What's the average days-on-market for RENTAL listings here right now (not sales)? A rising rental-DOM trend means longer vacancies and softer asking-rent achievability than the comps imply.
- What's the recent tenant-quality profile in this submarket — average credit score on applications, eviction rate, late-payment / NSF rate, and stable-employment percentage? A property-management company in the area should have these aggregated.
- How much new for-sale + rental construction is in the pipeline within 1–3 miles? Heavy new supply typically softens prices + rents 12–24 months out; constrained supply supports both.
Investment metrics
- 1% rule
- 1.17% ✓
- Cap rate
- 8.60%
- Cash-on-cash
- 8.24%
- DSCR
- 1.37
- GRM
- 7.1
CMA / ARV
- ARV (on-the-fly)
- $170,720
- Comps found
- 12
Show comp detail 12 sales within ~0.75 mi
| Address | Dist | Beds/Ba | Sqft | Sold | Price | $/sf | Match |
|---|---|---|---|---|---|---|---|
| 22243 Lasalle Rd | 0.15mi | 2/1.0 (-1) | 880 (0%) | 1mo | $152,267 | $173 | 87 |
| 22326 Cadet Ln | 0.28mi | 2/2.0 (-1) | 890 (+1%) | 1mo | $197,000 | $221 | 75 |
| 22163 Lasalle Rd | 0.19mi | 2/1.0 (-1) | 938 (+7%) | 7mo | $124,000 | $132 | 69 |
| 22131 Belinda Ave | 0.61mi | 2/1.0 (-1) | 901 (+2%) | 9mo | $125,000 | $139 | 55 |
| 1207 Ramsdel St | 0.67mi | 2/2.0 (-1) | 864 (-2%) | 5mo | $102,000 | $118 | 53 |
| 2401 Starlite Ln | 0.62mi | 2/1.0 (-1) | 840 (-4%) | 10mo | $182,000 | $217 | 50 |
| 22127 Gatewood Ave | 0.33mi | 2/1.0 (-1) | 952 (+8%) | 19mo | $155,000 | $163 | 50 |
| 22209 Beverly Ave | 0.55mi | 2/1.0 (-1) | 823 (-6%) | 15mo | $160,000 | $194 | 46 |
| 1627 Adrian St | 0.65mi | 2/1.0 (-1) | 912 (+4%) | 18mo | $175,000 | $192 | 44 |
| 2271 Hariet St | 0.62mi | 2/1.0 (-1) | 988 (+12%) | 14mo | $225,000 | $228 | 34 |
| 21439 Midway Blvd | 0.66mi | 2/1.0 (-1) | 962 (+9%) | 19mo | $220,000 | $229 | 33 |
| 21403 Glendale Ave | 0.75mi | 3/1.0 | 1,009 (+15%) | 11mo | $252,500 | $250 | 32 |
Match score weights: distance 35% · size 25% · config 20% · recency 20%. Top-matched comps best support the ARV.
Projected returns pro-forma
-3.0% appreciation · 0.0% rent growth · sell at horizon
- IRR
- -7.3%
- Equity multiple
- 0.74×
- Total profit
- $-9,550
- Equity at exit
- $19,369
- IRR
- -2.3%
- Equity multiple
- 0.87×
- Total profit
- $-4,871
- Equity at exit
- $11,231
Cash invested: $36,372 (down + closing). Projections, not guarantees.
Landlord ↔ Tenant lean methodology
- Overall (STATE)
- 87 Strongly Landlord-Friendly
- State Florida
- 87 Strongly Landlord-Friendly · R+3
- County
- — inherits STATE
- City
- — inherits STATE
ZIP-level market 33952
- Home prices YoY
- -4.8%
- Rents YoY
- -1.4%
- Active inventory
- 707
- Price-to-rent
- 7.1×
Monthly cashflow live
- Estimated rent
- $1,526 high interval (Pro) →
- Mortgage (P&I)
- −$681
- Tax from tax record
- −$220 /mo · $2,646/yr
- Insurance
- −$54
- HOA
- −$0
- Vacancy / Maint / Mgmt
- −$320
- Net cashflow
- $250
Break-even live
UW: 25.0% down · 7.5% · 30yr · 1.5% tax · 5.0% vac · 8.0% maint · 8.0% mgmt
Financing live
Cash to close
- Down payment
- $32,475
- Closing costs
- $3,897
- Reserves months
- —
- Total cash needed
- —
Loan-product check · same deal, 3 products live
Conventional
25% down · 7.5% · 30yr
- Down + closing
- —
- Monthly P&I
- —
- Monthly cashflow
- —
- DSCR
- —
- Eligible?
- —
Personal DTI + credit; lowest rate.
DSCR
20% down · 8.5% · 30yr
- Down + closing
- —
- Monthly P&I
- —
- Monthly cashflow
- —
- DSCR
- —
- Eligible?
- —
No personal income docs; deal must DSCR.
Hard money
10% down · 12.0% · 12mo
- Down + closing
- —
- Monthly P&I
- —
- Monthly cashflow
- —
- DSCR
- —
- Eligible?
- —
Short-term bridge; refi at stabilization.
Rent comps 17 comps
| Address | Beds | Baths | Sqft | Rent | $/sqft | DOM | Units | Dist |
|---|---|---|---|---|---|---|---|---|
| 22203 Lasalle Rd Port Charlotte, FL | 2.0 | 1.0 | 874 | $1,325 | $1.52 | 21d | 1 | 0.16mi |
| 1636 Hayworth Rd Port Charlotte, FL | 2.0 | 2.0 | 884 | $1,300 | $1.47 | 21d | 1 | 0.26mi |
| 22070 Gatewood Ave Port Charlotte, FL | 2.0 | 1.0 | 812 | $1,350 | $1.66 | 13d | 1 | 0.40mi |
| 21499 Glendale Ave Port Charlotte, FL | 3.0 | 1.0 | 1077 | $1,600 | $1.49 | 21d | 1 | 0.59mi |
| 22086 Beverly Ave Port Charlotte, FL | 2.0 | 1.0 | 1031 | $1,250 | $1.21 | 21d | 1 | 0.70mi |
| 21322 Stillwater Ave Port Charlotte, FL | 2.0 | 1.0 | 1080 | $1,300 | $1.20 | 21d | 1 | 1.05mi |
| 21155 Meehan Ave Port Charlotte, FL | 3.0 | 1.0 | 1060 | $1,300 | $1.23 | 21d | 1 | 1.21mi |
| 21440 Mallory Ave Port Charlotte, FL | 2.0 | 1.0 | 930 | $1,550 | $1.67 | 21d | 1 | 1.23mi |
| 3108 Whiting Ln Port Charlotte, FL | 2.0 | 1.0 | 828 | $1,350 | $1.63 | 21d | 1 | 1.24mi |
| 21405 Olean Blvd Port Charlotte, FL | 1.0–2.0 | 1.0–2.0 | 708 | $1,445 | $2.04 | 21d | 2 | 1.29mi |
| 2300 Aaron St #114 Port Charlotte, FL | 2.0 | 2.0 | 869 | $1,250 | $1.44 | 21d | 1 | 1.34mi |
| 21061 Midway Blvd Port Charlotte, FL | 2.0 | 1.0 | 897 | $1,600 | $1.78 | 21d | 1 | 1.37mi |
| 3100 Harbor Blvd Port Charlotte, FL | 2.0 | 1.0–1.5 | 994 | $1,472 | $1.48 | 21d | 2 | 1.39mi |
| 3126 Harbor Blvd Unit 3A Port Charlotte, FL | 2.0 | 2.0 | 1100 | $1,500 | $1.36 | 13d | 1 | 1.40mi |
| 21026 Glendale Ave Port Charlotte, FL | 2.0 | 1.0 | 812 | $1,400 | $1.72 | 21d | 1 | 1.43mi |
| 2425 Caring Way Unit 205 Port Charlotte, FL | 2.0 | 2.0 | 900 | $1,400 | $1.56 | 21d | 1 | 1.46mi |
| 2456 Elkcam Blvd Port Charlotte, FL | 2.0 | 2.0 | 1015 | $1,700 | $1.67 | 21d | 1 | 1.49mi |
Listing history 29 events
-
2026-06-17status $129,900 Pending 229 DOM
-
2026-06-16days on market $129,900 Active 229 DOM
-
2026-06-15days on market $129,900 Active 228 DOM
-
2026-06-14days on market $129,900 Active 226 DOM
-
2026-06-13pricedays on market $129,900 Active 225 DOM
-
2026-06-10days on market $132,900 Active 223 DOM
-
2026-06-09days on market $132,900 Active 222 DOM
-
2026-06-08days on market $132,900 Active 221 DOM
-
2026-06-05days on market $132,900 Active 217 DOM
-
2026-06-02days on market $132,900 Active 215 DOM
-
2026-06-01days on market $132,900 Active 214 DOM
-
2026-05-31days on market $132,900 Active 213 DOM
-
2026-05-30days on market $132,900 Active 212 DOM
-
2026-05-07price $132,900
-
2026-04-19price $139,900
-
2026-04-09price $144,900
-
2026-03-16price $149,900
-
2026-03-14status Active
-
2026-03-12historical $1,600
-
2026-03-07status Pending
-
2026-02-15price $159,900
-
2025-12-26price $164,900
-
2025-12-09price $169,900
-
2025-10-24$179,900 Active
-
2025-10-02$1,600
-
2009-06-25soldstatus $30,000 278-char remark
Show marketing remark (278 chars)
CONVENIENT LOCATION. GREAT STARTER HOME, RETIREMENT HOME, OR INVESTMENT OPPORTUNITY. THIS IS A SHORT SALE. Listing price may not be sufficient to pay the total of all liens and costs of sale, and sale of Property at full listing price may require approval of seller's lender(s).
-
2009-02-04$35,000 278-char remark
Show marketing remark (278 chars)
CONVENIENT LOCATION. GREAT STARTER HOME, RETIREMENT HOME, OR INVESTMENT OPPORTUNITY. THIS IS A SHORT SALE. Listing price may not be sufficient to pay the total of all liens and costs of sale, and sale of Property at full listing price may require approval of seller's lender(s).
-
2001-05-02soldstatus $46,000
-
1996-09-04soldstatus $36,500
ⓘ Source: listings_history table (triggers on properties + properties_extension) + one-shot
backfill from property_details.listing_events for pre-trigger history.
Tax reassessment forecast FL · Resets to sale price
- Current annual tax
- $2,646 · $220/mo
- Projected year-2 tax
- $2,646 · $220/mo
- Expected delta
- $0/yr ($0/mo · 0.0%)
ⓘ Screening estimate from a state-policy table — verify with the county assessor before closing.
Climate risk First Street
- Flood 6/10 Major FEMA zone X (shaded) · 57% chance over 30 yrs
- Wildfire 1/10 Low
- Heat 10/10 Extreme 7 d/yr ≥107°F today · 28 d/yr by 30 yrs out
- Wind 10/10 Extreme 99% chance of damaging wind over 30 yrs
- Air quality 3/10 Moderate 2 unhealthy d/yr today · 2 by 30 yrs out
Nearby sold comps map
Loading sold comps map…
Walkable amenities ~0.75 mi
Loading nearby amenities…
Taxation est. · year 1
- Rental income
- $18,314
- − Mortgage interest
- −$7,276
- − Property taxes
- −$2,646
- − Insurance
- −$650
- − Repairs & maintenance
- −$1,465
- − Management
- −$1,465
- − Depreciation
- −$3,779
- Taxable income
- $1,033
- Est. tax owed @ 24.0%
- −$248
- After-tax cash flow
- $2,750/yr
For passive investors: Depreciation is non-cash, so a rental often shows a tax loss while cash-flowing — sheltering income. Rental losses are passive: they offset passive income freely, and up to $25,000/yr can offset ordinary (W-2) income if you actively participate and your MAGI is under $100k (phasing out to $0 by $150k); unused losses carry forward. On sale, claimed depreciation is recaptured at up to 25%, and gains may owe capital-gains tax (a 1031 exchange can defer both). Figures are a year-1 estimate at your 24.0% rate — not tax advice; consult a CPA.
Schools (NCES district)
- District
- Charlotte
- NCES district ID
- 1200240
- Math proficiency
- 54% ▼ -6.00%
- Reading proficiency
- 54% ▼ -1.00%
- Median HH income
- $44,864
- Composite
- 45.62/100
- National rank
- #2586
- State rank
- #22 of 73 in FL
Livability — Port Charlotte
- Score
- 65/100
- State rank
- #655
- US rank
- #13081
Category grades
Schools grade is shown separately in the Schools card above.
Census & demographics
- Census place
- Port Charlotte, FL
- County
- Charlotte County · 196,994 people
- City population
- 102,180
- Metro
- Punta Gorda, FL
- Population (ZIP)
- 35,231
- Household income
- $61,382
- Rent vs Own
- Severe rent burden
- 733.0
Population outlook (Charlotte County) Hauer SSP2
- Today (2025)
- 198,646 people
- By 2030
- 210,507 · +6.0%
- By 2040
- 230,857 · +16.2%
- By 2050
- 247,148 · +24.4%
- By 2075
- 281,777 · +41.8%
- By 2100
- 293,609 · +47.8%
Race, ethnicity, and origin ACS 2023
- Neighborhood character
- Predominantly White (76%)
- Race & ethnicity
- White 76% Hispanic / Latino 14% Two or more races 8% Black 6% Asian 2%
- Hispanic origin (detail)
- Mexican 2% Puerto Rican 3% Cuban 2%
- Common ancestry
- Lithuanian 2% Romanian 2% Italian 2%
- Foreign-born
- 12% · Canada, Vietnam
- Languages at home
- 85% English-only · Spanish 10% French/Haitian/Cajun 1% Russian/Polish/Slavic 1%
Political lean MEDSL · Charlotte
- 2024 margin
- Solid R (+34.0) · D 32.7% · R 66.7%
- 2008→2024 swing
- -26.7pp toward R · 2008: -7.2pp · 2024: -34.0pp
- All cycles
- 2024: R+34.0 2020: R+26.6 2016: R+27.8 2012: R+14.3 2008: R+7.2
Not yet ingested
- Civics
- —
Market trends
- HPI YoY
- ▼ -17.18%
- Current HPI
- 339.0932
- Rent YoY
- ▼ -1.35%
- Metro
- Punta Gorda, FL
- State GDP YoY
- ▲ 3.28%
- F500 in state
- 36
Industry mix (Fortune 500 HQ in FL)
| Industry | F500 HQs | Revenue |
|---|---|---|
| Industrial Technology | 2 | $29B |
|
||
| Insurance | 2 | $17B |
|
||
| Retail | 1 | $60B |
|
||
| Technology Distribution | 1 | $58B |
|
||
| Homebuilding | 1 | $35B |
|
||
| Technology Manufacturing | 1 | $35B |
|
||
Price history
+264.1% since first listed16 events — show timeline
- 2026-05-07 Price Changed $132,900 Stellar MLS as Distributed by MLS Grid
- 2026-04-19 Price Changed $139,900 Stellar MLS as Distributed by MLS Grid
- 2026-04-09 Price Changed $144,900 Stellar MLS as Distributed by MLS Grid
- 2026-03-16 Price Changed $149,900 Stellar MLS as Distributed by MLS Grid
- 2026-03-14 Relisted — Stellar MLS as Distributed by MLS Grid
- 2026-03-12 Rental Removed $1,600 STELLARMLS
- 2026-03-07 Pending — Stellar MLS as Distributed by MLS Grid
- 2026-02-15 Price Changed $159,900 Stellar MLS as Distributed by MLS Grid
- 2025-12-26 Price Changed $164,900 Stellar MLS as Distributed by MLS Grid
- 2025-12-09 Price Changed $169,900 Stellar MLS as Distributed by MLS Grid
- 2025-10-24 Listed $179,900 Stellar MLS as Distributed by MLS Grid
- 2025-10-02 Listed for Rent $1,600 STELLARMLS
- 2009-06-25 Sold (MLS) $30,000 Stellar MLS as Distributed by MLS Grid
- 2009-02-04 Listed $35,000 Stellar MLS as Distributed by MLS Grid
- 2001-05-02 Sold (Public Records) $46,000 Public Records
- 1996-09-04 Sold (Public Records) $36,500 Public Records
Property tax history
+5.2%/yrLatest (2025): $2,646 · -0.9% YoY. Source: county tax records.
Cash-flow waterfall
monthlySold comps — $/sqft
last 12 mo · ≤1 miLoading sold comps…