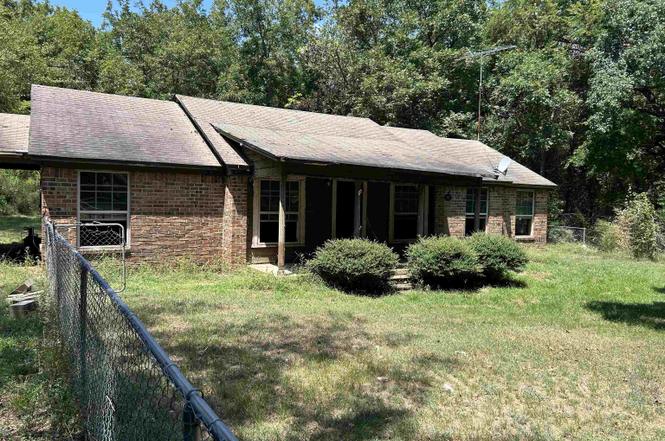
11006 S Fm 225 · Henderson, TX
Flood risk 1/10 · Minimal
- FEMA flood zone
- X (unshaded)
- Chance of flooding over 30 yrs
- 0.0%
- Est. flood insurance / yr
- $507 – $1,088
Fire risk 3/10 · Minor
- Est. fire insurance / yr
- $1,222 – $2,270
Heat risk 6/10 · Moderate
- Hot days now (above 110°F)
- 6 days/yr
- Hot days in 30 yrs
- 19 days/yr
Wind risk 6/10 · Moderate
- Chance of severe wind over 30 yrs
- 72.0%
Air-quality risk 1/10 · Minimal
- Unhealthy air days now
- 0 days/yr
- Unhealthy air days in 30 yrs
- 0 days/yr
Risk factors via First Street. Map © Google.
Why this score? — see what drove the B+ grade
The composite is a weighted blend of 9 inputs, each scored 0–100. Each bar is that input's sub-score; the figure is the points it added to the 100-point composite (weight × sub-score).
- Cash flow +30.0/30.0
- 1% rule +10.0/10.0
- DSCR +10.0/10.0
- Appreciation +7.7/10.0
- ARV discount +7.5/15.0
- Schools +4.0/10.0
- Livability +3.5/5.0
- Rent growth +2.5/5.0
- Condition / age +2.5/5.0
$55,000
🖨 Deal sheet 📄 Offer letter ✓ Due diligence
Listing remarks
here is a 1600 Square foot home sitting on 3 acres about 10 minutes from Henderson. Land has the potential for additional homes, large shop or just a peaceful getaway. Home needs a full renovation but power and water were on at the time of acquisition. Don't let this property with great equity upside get away from you.
Key facts
- 3 acre lot
- 2 garage spots
- Built 1957
Neighborhood map
What this means for you Summary
Snapshot
- This is a 3-bed/2.0-bath single-family listed at $55k.
Deal economics
- At list price, monthly cash flow is $457 ($5k/yr) — positive.
- The deal already cash-flows at list — no discount required.
- Meets the 1% rule at list price ($1k rent vs $55k).
- Recommended offer: $48k (12.0% below list) — sets the bar for market timing.
- Cap rate 16.3% vs local median 2.9% in Henderson — top-decile yield for the area; either an underpriced asset or a hidden risk that comps aren't pricing in. Stress-test before assuming the spread holds.
Location & tenants
- Location reads 69/100 on livability (#408 in TX) — a middle-class / working-renter tenant base. Strengths: cost of living A+, housing A+, health & safety A+; Watch: employment D+, schools D-, crime F.
- Laneville ISD (rural): math 55% / reading 35% proficiency, ranked #572 of 1,141 in TX (top 50%) — families likely to look elsewhere, expect single-tenant / working-renter base with shorter leases; 84% free/reduced lunch — lower-income household profile, screen leases tightly.
- Market conditions: 32 active listings in the ZIP; 4 units permitted in Rusk County in 2024 (0 in 5+ unit buildings).
Forward outlook
- In year one you build about $3k of equity ($380 loan paydown + $3k appreciation (5.5% local appreciation)).
- Rusk County population projected to shrink 5% by 2050 — rents likely to lag national; underwrite the cash flow, not the appreciation.
- At projected returns (5.5% appreciation + 3.0% rent growth), your $15k cash investment doubles in ~2 years — after that, you're playing with house money.
- By year 9, paydown + projected appreciation supports a ~$30k cash-out refi (75% LTV) — recoverable capital for the next deal without selling this one.
Negotiation context
- It's been on market 192 days — a 12% lower offer ($48k) is reasonable based on typical stale-listing flexibility.
- 2 sale attempts; this cycle's ask has dropped $42k (43%) from the opening price — seller is motivated, your offer sets the floor, not the list.
Risks & watch-outs
- Watch-outs: property tax is 4.1% of price; built in 1957 — expect roof / HVAC / electrical / plumbing capex.
- Climate carrying-cost: major wind risk, 72% chance of damaging wind over 30y; extreme-heat days projected 6→19/yr by 2055 (HVAC capex compounding) — expect insurance premiums to compound above CPI over the hold.
Questions for the listing agent
- It's been on market 192 days. Have you received any prior offers? Is the seller open to a 12% concession, seller financing, or rate buy-down credit?
- Built in 1957 — when were the roof, HVAC, electrical panel, plumbing, and water heater last replaced?
- Property tax is high relative to price — has the assessment been appealed recently, and will the sale trigger a re-assessment?
- Why hasn't it sold? Are there any deal-killer items the seller is aware of (foundation, flood, title, zoning, code violations)?
- Is there a deadline driving the sale (1031 exchange, divorce, estate, relocation)? That informs how much negotiation room exists.
- Schools are D-rated, which usually means shorter tenancies and higher turnover. Who's the typical renter profile here, and what's been the actual vacancy rate?
- Crime grade is F in this area — have there been break-ins, vandalism, or insurance claims at this property in the last 3 years? What carrier currently insures it and at what premium?
- What's the average days-on-market for RENTAL listings here right now (not sales)? A rising rental-DOM trend means longer vacancies and softer asking-rent achievability than the comps imply.
- What's the recent tenant-quality profile in this submarket — average credit score on applications, eviction rate, late-payment / NSF rate, and stable-employment percentage? A property-management company in the area should have these aggregated.
- How much new for-sale + rental construction is in the pipeline within 1–3 miles? Heavy new supply typically softens prices + rents 12–24 months out; constrained supply supports both.
Investment metrics
- 1% rule
- 2.20% ✓
- Cap rate
- 16.27%
- Cash-on-cash
- 35.63%
- DSCR
- 2.59
- GRM
- 3.8
CMA / ARV
No comps found within radius.
Projected returns pro-forma
5.49% appreciation · 3.0% rent growth · sell at horizon
- IRR
- 45.1%
- Equity multiple
- 3.82×
- Total profit
- $43,447
- Equity at exit
- $32,826
- IRR
- 42.6%
- Equity multiple
- 7.86×
- Total profit
- $105,665
- Equity at exit
- $58,075
Cash invested: $15,400 (down + closing). Projections, not guarantees.
Landlord ↔ Tenant lean methodology
- Overall (STATE)
- 87 Strongly Landlord-Friendly
- State Texas
- 87 Strongly Landlord-Friendly · R+5
- County
- — inherits STATE
- City
- — inherits STATE
ZIP-level market 75667
- Home prices YoY
- 2.8%
- Active inventory
- 32
- Price-to-rent
- 3.8×
Monthly cashflow live
- Estimated rent
- $1,211 medium interval (Pro) →
- Mortgage (P&I)
- −$288
- Tax from tax record
- −$188 /mo · $2,260/yr
- Insurance
- −$23
- HOA
- −$0
- Vacancy / Maint / Mgmt
- −$254
- Net cashflow
- $457
Break-even live
UW: 25.0% down · 7.5% · 30yr · 1.5% tax · 5.0% vac · 8.0% maint · 8.0% mgmt
Financing live
Cash to close
- Down payment
- $13,750
- Closing costs
- $1,650
- Reserves months
- —
- Total cash needed
- —
Loan-product check · same deal, 3 products live
Conventional
25% down · 7.5% · 30yr
- Down + closing
- —
- Monthly P&I
- —
- Monthly cashflow
- —
- DSCR
- —
- Eligible?
- —
Personal DTI + credit; lowest rate.
DSCR
20% down · 8.5% · 30yr
- Down + closing
- —
- Monthly P&I
- —
- Monthly cashflow
- —
- DSCR
- —
- Eligible?
- —
No personal income docs; deal must DSCR.
Hard money
10% down · 12.0% · 12mo
- Down + closing
- —
- Monthly P&I
- —
- Monthly cashflow
- —
- DSCR
- —
- Eligible?
- —
Short-term bridge; refi at stabilization.
Listing history 15 events
-
2026-03-19status Pending
-
2026-01-29price $55,000
-
2025-10-14status Active
-
2025-10-14price $65,000
-
2025-09-23status Pending
-
2025-09-15price $75,000
-
2025-08-29price $80,000
-
2025-08-18price $95,000
-
2025-08-18$97,000 Active
-
2025-06-30soldstatus
-
2018-02-16soldstatus
-
2004-11-29soldstatus
-
2000-07-18soldstatus
-
1998-08-20soldstatus
-
1994-08-29soldstatus
ⓘ Source: listings_history table (triggers on properties + properties_extension) + one-shot
backfill from property_details.listing_events for pre-trigger history.
Tax reassessment forecast TX · Resets to sale price
- Current annual tax
- $2,260 · $188/mo
- Projected year-2 tax
- $2,260 · $188/mo
- Expected delta
- $0/yr ($0/mo · 0.0%)
ⓘ Screening estimate from a state-policy table — verify with the county assessor before closing.
Climate risk First Street
- Flood 1/10 Low FEMA zone X (unshaded) · 0% chance over 30 yrs
- Wildfire 3/10 Moderate
- Heat 6/10 Major 6 d/yr ≥110°F today · 19 d/yr by 30 yrs out
- Wind 6/10 Major 72% chance of damaging wind over 30 yrs
- Air quality 1/10 Low 0 unhealthy d/yr today · 0 by 30 yrs out
Nearby sold comps map
Loading sold comps map…
Walkable amenities ~0.75 mi
Loading nearby amenities…
Taxation est. · year 1
- Rental income
- $14,535
- − Mortgage interest
- −$3,081
- − Property taxes
- −$2,260
- − Insurance
- −$275
- − Repairs & maintenance
- −$1,163
- − Management
- −$1,163
- − Depreciation
- −$1,600
- Taxable income
- $4,993
- Est. tax owed @ 24.0%
- −$1,198
- After-tax cash flow
- $4,288/yr
For passive investors: Depreciation is non-cash, so a rental often shows a tax loss while cash-flowing — sheltering income. Rental losses are passive: they offset passive income freely, and up to $25,000/yr can offset ordinary (W-2) income if you actively participate and your MAGI is under $100k (phasing out to $0 by $150k); unused losses carry forward. On sale, claimed depreciation is recaptured at up to 25%, and gains may owe capital-gains tax (a 1031 exchange can defer both). Figures are a year-1 estimate at your 24.0% rate — not tax advice; consult a CPA.
Schools (NCES district)
- District
- Laneville ISD
- NCES district ID
- 4826700
- Math proficiency
- 55% ▲ 5.00%
- Reading proficiency
- 35% ▼ -5.00%
- Median HH income
- $39,000
- Composite
- 39.85/100
- National rank
- #7949
- State rank
- #572 of 1141 in TX
Livability — Henderson
- Score
- 69/100
- State rank
- #408
- US rank
- #8434
Category grades
Schools grade is shown separately in the Schools card above.
Census & demographics
- Population (ZIP)
- 1,310
Population outlook (Rusk County) Hauer SSP2
- Today (2025)
- 52,498 people
- By 2030
- 52,093 · -0.8%
- By 2040
- 50,866 · -3.1%
- By 2050
- 49,696 · -5.3%
- By 2075
- 48,583 · -7.5%
- By 2100
- 43,265 · -17.6%
Race, ethnicity, and origin ACS 2023
- Neighborhood character
- Predominantly White (65%)
- Race & ethnicity
- White 65% Black 23% Hispanic / Latino 10% Two or more races 9%
- Hispanic origin (detail)
- Mexican 8%
- Common ancestry
- Lithuanian 2% Portuguese 1% Slovak 1%
- Foreign-born
- 1% · Canada
- Languages at home
- 95% English-only · Spanish 5%
Political lean MEDSL · Rusk
- 2024 margin
- Solid R (+59.4) · D 20.0% · R 79.4%
- 2008→2024 swing
- -13.2pp toward R · 2008: -46.3pp · 2024: -59.4pp
- All cycles
- 2024: R+59.4 2020: R+55.7 2016: R+56.5 2012: R+51.1 2008: R+46.3
Not yet ingested
- Civics
- —
Market trends
- HPI YoY
- ▲ 5.49%
- Current HPI
- 204.8745
- Rent YoY
- —
- Metro
- —
- State GDP YoY
- ▲ 3.95%
- F500 in state
- 110
Industry mix (Fortune 500 HQ in TX)
| Industry | F500 HQs | Revenue |
|---|---|---|
| Energy | 16 | $1,198B |
|
||
| Technology | 5 | $198B |
|
||
| Engineering / Construction | 4 | $72B |
|
||
| Energy Services | 3 | $60B |
|
||
| Utilities | 3 | $41B |
|
||
| Healthcare | 2 | $330B |
|
||
Price history
-43.3% since first listed15 events — show timeline
- 2026-03-19 Pending — LAAR
- 2026-01-29 Price Changed $55,000 LAAR
- 2025-10-14 Relisted — LAAR
- 2025-10-14 Price Changed $65,000 LAAR
- 2025-09-23 Pending — LAAR
- 2025-09-15 Price Changed $75,000 LAAR
- 2025-08-29 Price Changed $80,000 LAAR
- 2025-08-18 Price Changed $95,000 LAAR
- 2025-08-18 Listed $97,000 LAAR
- 2025-06-30 Sold (Public Records) — Public Records
- 2018-02-16 Sold (Public Records) — Public Records
- 2004-11-29 Sold (Public Records) — Public Records
- 2000-07-18 Sold (Public Records) — Public Records
- 1998-08-20 Sold (Public Records) — Public Records
- 1994-08-29 Sold (Public Records) — Public Records
Property tax history
+4.7%/yrLatest (2025): $2,260 · +1.0% YoY. Source: county tax records.
Cash-flow waterfall
monthlySold comps — $/sqft
last 12 mo · ≤1 miLoading sold comps…