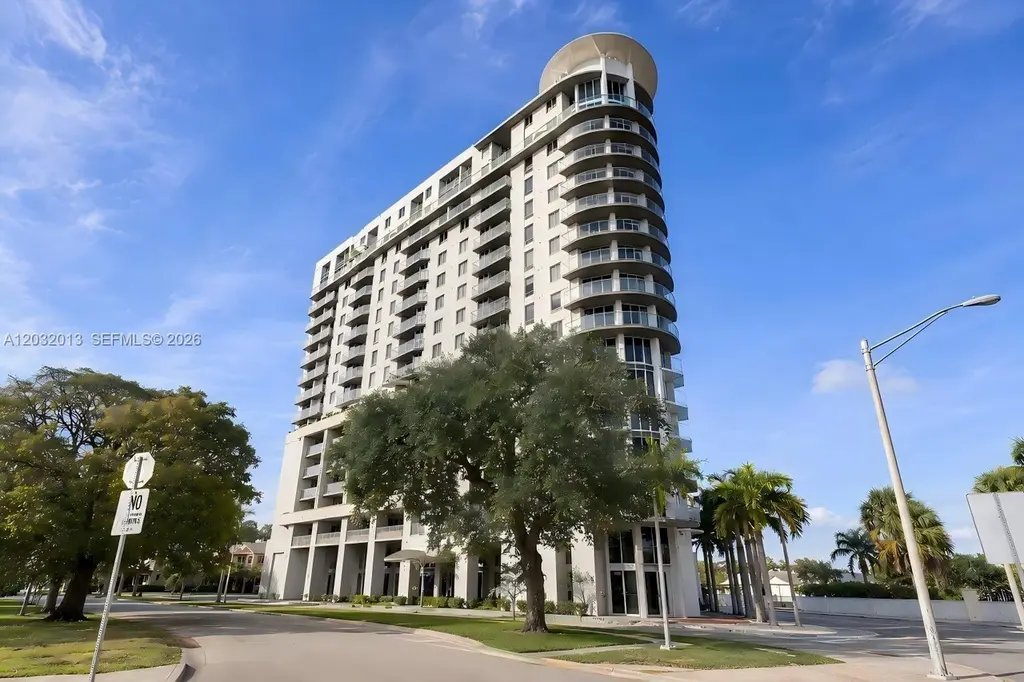
1 Glen Royal Pkwy #1210 · Miami, FL
Flood risk 1/10 · Minimal
- FEMA flood zone
- X (unshaded)
- Chance of flooding over 30 yrs
- 0.0%
- Est. flood insurance / yr
- $507 – $1,088
Fire risk 1/10 · Minimal
- Est. fire insurance / yr
- $947 – $1,759
Heat risk 10/10 · Severe
- Hot days now (above 104°F)
- 7 days/yr
- Hot days in 30 yrs
- 28 days/yr
Wind risk 10/10 · Severe
- Chance of severe wind over 30 yrs
- 99.0%
Air-quality risk 2/10 · Minimal
- Unhealthy air days now
- 1 days/yr
- Unhealthy air days in 30 yrs
- 1 days/yr
Risk factors via First Street. Map © Google.
Why this score? — see what drove the D- grade
The composite is a weighted blend of 9 inputs, each scored 0–100. Each bar is that input's sub-score; the figure is the points it added to the 100-point composite (weight × sub-score).
- Cash flow +9.4/30.0
- ARV discount +7.5/15.0
- 1% rule +4.6/10.0
- Schools +4.2/10.0
- Livability +3.9/5.0
- DSCR +2.6/10.0
- Condition / age +2.5/5.0
- Rent growth +2.2/5.0
- Appreciation +0.0/10.0
$369,500
🖨 Deal sheet (PDF) 📄 Offer letter ✓ Due diligence
Listing remarks
Welcome to city living! This beautifully maintained 2-bedroom, 2-bathroom condo offers the perfect combination of comfort, convenience, & breathtaking skyline views. Featuring an open-concept layout, abundant natural light, modern finishes, & spacious walk-in closet in Main Bedroom, this residence is move-in ready & designed for today's lifestyle. Enjoy a bright NEW kitchen with stainless steel appliances & a functional layout that flows seamlessly into the living & dining areas. The balcony showcases spectacular panoramic city views, creating the perfect setting to relax with your morning coffee or unwind after a long day. The spacious primary suite features a l
Key facts
- Bright new kitchen
- Ample storage
- $566 HOA
Tags
Property features AI
Finance
- Other: Annual tax amount listed (excluded from feature grouping as financial detail)
- Financial info: Pets allowed
- HOA & community: Monthly association fee of $566; Association covers maintenance of grounds and structure, parking, roof, sewer, security, and water; Community amenities include a fitness center and elevators
Exterior
- Parking: Covered, deeded parking space (1 space); Secured garage/parking
- Security: Doorman; Elevator secured; Intercom; Lobby secured; Security guard
- Utilities: Water included in association fee; Sewer included in association fee; Electric service (for heating and cooling)
- Home design: Attached property; 16-story building; Entry located on level 12
- Construction: Block construction; Effective year built
- Exterior features: Balcony; Storm/security shutters; Exterior lighting; Open balcony/porch
Interior
- Kitchen: Dishwasher; Electric range; Garbage disposal; Refrigerator; Pantry
- Bedrooms: Bedroom located on the main level
- Flooring: Laminate flooring; Marble flooring
- Bathrooms: 2 full bathrooms
- Heating & cooling: Central heating (electric); Central air conditioning (electric)
- Interior features: First-floor entry; Bedroom on main level; Garden/Roman tub; Pantry; Walk-in closets
- Laundry & utility: Dryer; Electric water heater
Neighborhood map
What this means for you Summary
Snapshot
- This is a 1-bed/2.0-bath condo listed at $370k.
Deal economics
- At list price, monthly cash flow is $-266 ($-3k/yr) — negative.
- To cash-flow at today's rent, offer at most $323k (12.7% below list).
- To meet the 1% rule (rent ≥ 1% of price), the offer needs to be $356k (3.6% below list).
- Recommended offer: $323k (12.7% below list) — sets the bar for cash-flow.
- Cap rate 5.4% vs local median 1.9% in Miami — top-decile yield for the area; either an underpriced asset or a hidden risk that comps aren't pricing in. Stress-test before assuming the spread holds.
Location & tenants
- Location reads 78/100 on livability (#177 in FL, #2,724 nationally) — a middle-class / working-renter tenant base. Strengths: amenities A+, commute A+, health & safety A+; Watch: employment C-, crime F, cost of living F.
- Miami-Dade (suburban): math 45% / reading 54% proficiency, ranked #40 of 73 in FL (top 55%) — families likely to look elsewhere, expect single-tenant / working-renter base with shorter leases; 64% free/reduced lunch — lower-income household profile, screen leases tightly.
- Zoned schools: Citrus Grove Elementary School (math 27% / reading 35%, grade F, #1,854 of 2,144 statewide, top 87%, 866 students, 65% FRL); Citrus Grove Middle School (math 19% / reading 21%, grade F, #558 of 571 statewide, top 98%, 781 students, 66% FRL); Miami Senior High School (math 21% / reading 41%, grade F, #429 of 667 statewide, top 65%, 2,905 students, 69% FRL) — zoned schools at 67% FRL track the district average.
- Zoned-school proficiency averages 27% at this address vs 50% district-wide (-22 pts) — the specific schools serving this property underperform the Miami-Dade average; the district grade overstates school quality for this exact location.
- Market conditions: Rents soft (-1.4%/yr); 241 active listings in the ZIP; 1 comparable units currently listed for rent nearby; lower-income renter base — watch delinquency; 10,051 units permitted in Miami-Dade County in 2024 (7,758 in 5+ unit buildings).
- At $3,563/mo this rent would consume 95% of the median local household income ($45k/yr) (locally 5223% of renters already pay >50% of income on rent) — very limited rent-growth headroom before tenants either downsize or default.
Forward outlook
- Local home prices are declining (-3.0%/yr); year-one equity from $3k of loan paydown is wiped out by about $11k of value loss. Plan a longer hold.
- Miami-Dade County population projected at +28% by 2050 — long-run rental-demand tailwind backs the buy-and-hold thesis.
Negotiation context
- It's been on market 15 days — a 2% lower offer ($364k) is reasonable based on typical stale-listing flexibility.
- 2 sale attempts with the ask held roughly flat each time — persistent listings suggest the price (not the market) is what's stuck; bring a comps-based counter.
Risks & watch-outs
- Climate carrying-cost: severe wind risk, 99% chance of damaging wind over 30y; extreme-heat days projected 7→28/yr by 2055 (HVAC capex compounding) — expect insurance premiums to compound above CPI over the hold.
Questions for the listing agent
- What do current leases actually rent for vs. the listed asking? Can we see a recent rent roll and the last 12 months of T-12 income?
- What does the HOA fee cover, when was the last increase, and are there any pending special assessments or reserve-fund shortfalls?
- Any open or pending special assessments — roof, HVAC, plumbing, elevator, façade? What's the per-unit balance and payoff schedule, and is the seller paying it off at close or rolling it to the buyer?
- Is there a deadline driving the sale (1031 exchange, divorce, estate, relocation)? That informs how much negotiation room exists.
- Schools are B-rated — typically a magnet for longer-tenancy family renters. What's the average tenant stay here, and is there a school-zone premium baked into asking?
- Crime grade is F in this area — have there been break-ins, vandalism, or insurance claims at this property in the last 3 years? What carrier currently insures it and at what premium?
- The area grade is low — what's the realistic commute time and amenity access for the typical tenant pool here? Any planned neighborhood developments (good or bad) we should know about?
- What's the average days-on-market for RENTAL listings here right now (not sales)? A rising rental-DOM trend means longer vacancies and softer asking-rent achievability than the comps imply.
- What's the recent tenant-quality profile in this submarket — average credit score on applications, eviction rate, late-payment / NSF rate, and stable-employment percentage? A property-management company in the area should have these aggregated.
- How much new apartment / multifamily construction is in the pipeline within 1–3 miles? Heavy new supply (>2% of stock underway) typically softens rents 12–24 months out; light construction supports rent growth.
Investment metrics
- 1% rule
- 0.96% ✗
- Cap rate
- 5.43%
- Cash-on-cash
- -3.08%
- DSCR
- 0.86
- GRM
- 8.6
CMA / ARV
No comps found within radius.
Projected returns pro-forma
-3.0% appreciation · 0.0% rent growth · sell at horizon
- IRR
- -25.5%
- Equity multiple
- 0.16×
- Total profit
- $-86,879
- Equity at exit
- $55,094
- IRR
- -40.0%
- Equity multiple
- -0.32×
- Total profit
- $-136,287
- Equity at exit
- $31,948
Cash invested: $103,460 (down + closing). Projections, not guarantees.
Landlord ↔ Tenant lean methodology
- Overall (STATE)
- 87 Strongly Landlord-Friendly
- State Florida
- 87 Strongly Landlord-Friendly · R+3
- County
- — inherits STATE
- City
- — inherits STATE
ZIP-level market 33125
- Rents YoY
- -1.4%
- Active inventory
- 241
- Price-to-rent
- 8.6×
Monthly cashflow live
- Estimated rent
- $3,563 medium interval (Pro) →
- Mortgage (P&I)
- −$1,938
- Tax from tax record
- −$423 /mo · $5,079/yr
- Insurance
- −$154
- HOA
- −$566
- Vacancy / Maint / Mgmt
- −$748
- Net cashflow
- $-266
Break-even live
Sensitivity live
| Price | -10% $-57 | -5% $-161 | +0% $-266 | +5% $-371 | +10% $-475 |
|---|---|---|---|---|---|
| Rent | -10% $-547 | -5% $-407 | +0% $-266 | +5% $-125 | +10% $16 |
| Rate | -1.0pp $-80 | -0.5pp $-172 | base $-266 | +0.5pp $-362 | +1.0pp $-459 |
UW: 25.0% down · 7.5% · 30yr · 1.5% tax · 5.0% vac · 8.0% maint · 8.0% mgmt
Financing live
Cash to close
- Down payment
- $92,375
- Closing costs
- $11,085
- Reserves months
- —
- Total cash needed
- —
Loan-product check · same deal, 3 products live
Conventional
25% down · 7.5% · 30yr
- Down + closing
- —
- Monthly P&I
- —
- Monthly cashflow
- —
- DSCR
- —
- Eligible?
- —
Personal DTI + credit; lowest rate.
DSCR
20% down · 8.5% · 30yr
- Down + closing
- —
- Monthly P&I
- —
- Monthly cashflow
- —
- DSCR
- —
- Eligible?
- —
No personal income docs; deal must DSCR.
Hard money
10% down · 12.0% · 12mo
- Down + closing
- —
- Monthly P&I
- —
- Monthly cashflow
- —
- DSCR
- —
- Eligible?
- —
Short-term bridge; refi at stabilization.
Rent comps 1 comps
| Address | Beds | Baths | Sqft | Rent | $/sqft | DOM | Units | Dist |
|---|---|---|---|---|---|---|---|---|
| 1710 SW 27th Ave Unit 1272101P Miami, FL | 1.0–5.0 | 1.0–4.0 | 1716 | $3,855 | $2.25 | 10d | 3 | 1.29mi |
HOA detail condo
- Monthly dues
- $566 · $6,792/yr
- Assessments
- None detected in remarks — confirm with the listing agent.
Listing history 10 events
-
2026-06-21days on market $369,500 Active 15 DOM
-
2026-06-18days on market $369,500 Active 12 DOM
-
2026-06-17days on market $369,500 Active 11 DOM
-
2026-06-16days on market $369,500 Active 10 DOM
-
2026-06-15days on market $369,500 Active 9 DOM
-
2026-06-13days on market $369,500 Active 7 DOM
-
2026-06-09days on market $369,500 Active 3 DOM
-
2026-06-08days on market $369,500 Active 2 DOM
-
2026-06-07remarks 679-char remark
-
2026-06-07$369,500 Active 1 DOM
ⓘ Source: listings_history table (triggers on properties + properties_extension) + one-shot
backfill from property_details.listing_events for pre-trigger history.
Tax reassessment forecast FL · Resets to sale price
- Current annual tax
- $5,079 · $423/mo
- Projected year-2 tax
- $5,079 · $423/mo
- Expected delta
- $0/yr ($0/mo · 0.0%)
ⓘ Screening estimate from a state-policy table — verify with the county assessor before closing.
Climate risk First Street
- Flood 1/10 Low FEMA zone X (unshaded) · 0% chance over 30 yrs
- Wildfire 1/10 Low
- Heat 10/10 Extreme 7 d/yr ≥104°F today · 28 d/yr by 30 yrs out
- Wind 10/10 Extreme 99% chance of damaging wind over 30 yrs
- Air quality 2/10 Low 1 unhealthy d/yr today · 1 by 30 yrs out
Nearby sold comps map
Loading sold comps map…
Walkable amenities ~0.75 mi
Loading nearby amenities…
Taxation est. · year 1
- Rental income
- $42,759
- − Mortgage interest
- −$20,698
- − Property taxes
- −$5,079
- − Insurance
- −$1,848
- − Repairs & maintenance
- −$3,421
- − Management
- −$3,421
- − HOA
- −$6,792
- − Depreciation
- −$10,749
- Taxable loss
- −$9,248
- Est. tax savings @ 24.0%
- +$2,220
- After-tax cash flow
- $-972/yr
For passive investors: Depreciation is non-cash, so a rental often shows a tax loss while cash-flowing — sheltering income. Rental losses are passive: they offset passive income freely, and up to $25,000/yr can offset ordinary (W-2) income if you actively participate and your MAGI is under $100k (phasing out to $0 by $150k); unused losses carry forward. On sale, claimed depreciation is recaptured at up to 25%, and gains may owe capital-gains tax (a 1031 exchange can defer both). Figures are a year-1 estimate at your 24.0% rate — not tax advice; consult a CPA.
Schools (NCES district)
- District
- Miami-Dade
- NCES district ID
- 1200390
- Math proficiency
- 45% ▼ -16.00%
- Reading proficiency
- 54% ▼ -5.00%
- Median HH income
- $43,928
- Composite
- 41.76/100
- National rank
- #3397
- State rank
- #40 of 73 in FL
Livability — Miami
- Score
- 78/100
- State rank
- #177
- US rank
- #2724
Category grades
Schools grade is shown separately in the Schools card above.
Census & demographics
- Census place
- Miami, FL
- County
- Miami-Dade County · 2,697,751 people
- City population
- 827,308
- Metro
- Miami-Fort Lauderdale-Pompano Beach, FL
- Population (ZIP)
- 56,897
- Household income
- $44,979
- Rent vs Own
- Severe rent burden
- 5223.0
Population outlook (Miami-Dade County) Hauer SSP2
- Today (2025)
- 3,126,439 people
- By 2030
- 3,325,765 · +6.4%
- By 2040
- 3,697,561 · +18.3%
- By 2050
- 4,012,134 · +28.3%
- By 2075
- 4,605,612 · +47.3%
- By 2100
- 4,866,598 · +55.7%
Race, ethnicity, and origin ACS 2023
- Neighborhood character
- Predominantly Hispanic (92%)
- Race & ethnicity
- Hispanic / Latino 92% Two or more races 52% White 4% Black 4%
- Hispanic origin (detail)
- Mexican 2% Puerto Rican 3% Cuban 46% Dominican 3% Salvadoran 1%
- Common ancestry
- Hispanic 1%
- Foreign-born
- 68% · Canada, Jamaica, Dominican Republic
- Languages at home
- 9% English-only · Spanish 90%
Political lean MEDSL · Miami-Dade
- 2024 margin
- R (+11.4) · D 43.9% · R 55.4%
- 2008→2024 swing
- -27.6pp toward R · 2008: 16.1pp · 2024: -11.4pp
- All cycles
- 2024: R+11.4 2020: D+7.3 2016: D+29.6 2012: D+23.7 2008: D+16.1
Not yet ingested
- Civics
- —
Market trends
- HPI YoY
- ▼ -402.98%
- Current HPI
- 476.1631
- Rent YoY
- ▼ -1.39%
- Metro
- Miami-Fort Lauderdale-Pompano Beach, FL
- State GDP YoY
- ▲ 3.28%
- F500 in state
- 36
Industry mix (Fortune 500 HQ in FL)
| Industry | F500 HQs | Revenue |
|---|---|---|
| Industrial Technology | 2 | $29B |
|
||
| Insurance | 2 | $17B |
|
||
| Retail | 1 | $60B |
|
||
| Technology Distribution | 1 | $58B |
|
||
| Homebuilding | 1 | $35B |
|
||
| Technology Manufacturing | 1 | $35B |
|
||
Price history
-3.9% since first listed3 events — show timeline
- 2026-06-06 Listed $369,500 MARMLS
- 2026-02-26 Listing Removed — MARMLS
- 2026-02-10 Listed $384,500 MARMLS
Property tax history
+11.3%/yrLatest (2025): $5,079 · +10.7% YoY. Source: county tax records.
Cash-flow waterfall
monthlySold comps — $/sqft
last 12 mo · ≤1 miLoading sold comps…