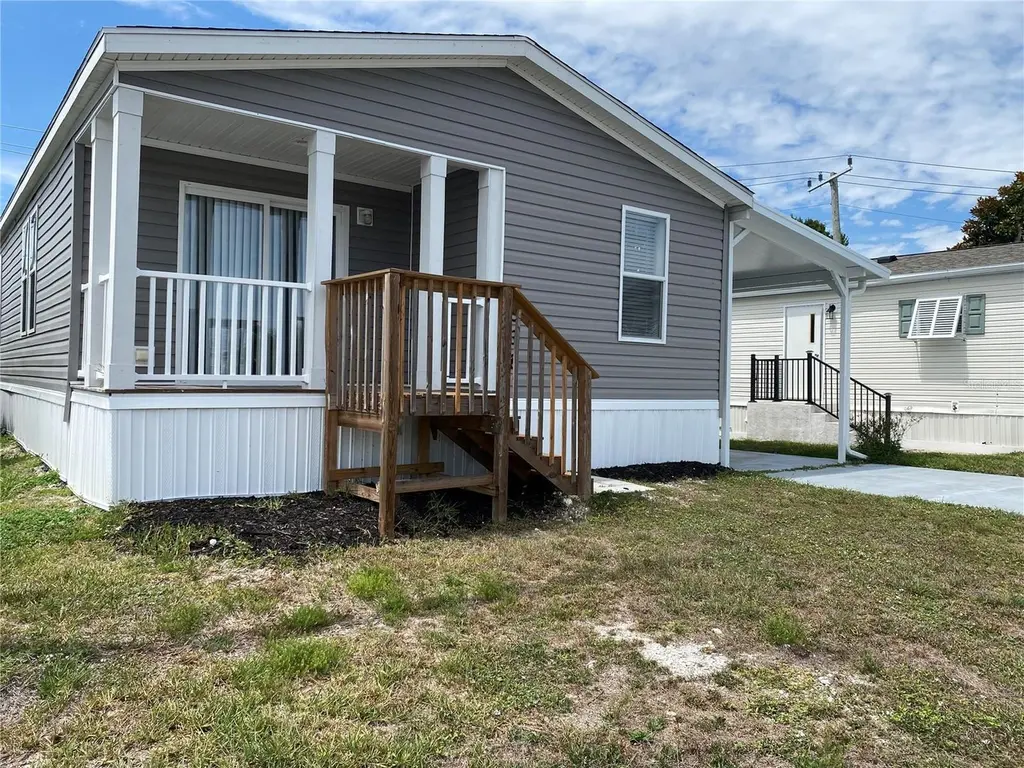
538 Fleetwood St · Warm Mineral Springs, FL
Flood risk 9/10 · Severe
- FEMA flood zone
- AE
- Chance of flooding over 30 yrs
- 0.99%
- Est. flood insurance / yr
- $1,737 – $8,500
Fire risk 6/10 · Moderate
- Est. fire insurance / yr
- $947 – $1,759
Heat risk 10/10 · Severe
- Hot days now (above 107°F)
- 7 days/yr
- Hot days in 30 yrs
- 29 days/yr
Wind risk 10/10 · Severe
- Chance of severe wind over 30 yrs
- 99.0%
Air-quality risk 2/10 · Minimal
- Unhealthy air days now
- 1 days/yr
- Unhealthy air days in 30 yrs
- 1 days/yr
Risk factors via First Street. Map © Google.
Why this score? — see what drove the C+ grade
The composite is a weighted blend of 9 inputs, each scored 0–100. Each bar is that input's sub-score; the figure is the points it added to the 100-point composite (weight × sub-score).
- Cash flow +25.9/30.0
- DSCR +8.7/10.0
- ARV discount +7.5/15.0
- 1% rule +5.9/10.0
- Schools +5.4/10.0
- Livability +3.3/5.0
- Rent growth +2.6/5.0
- Condition / age +2.5/5.0
- Appreciation +0.0/10.0
$150,000
🖨 Deal sheet (PDF) 📄 Offer letter ✓ Due diligence
Listing remarks
????NEW PRICE!!!????Incredible opportunity to Own this Beautiful New Home on a 40 YEAR LEASED LOT $99 FOR THE ENTIRE YEAR in Harbor Cove!!! Space abounds in this 2-bedroom, 2-bath home that offers the perfect blend of affordability, comfort, and Florida sunshine in one of the area’s most desirable WATERFRONT communities with direct GULF ACCESS via the Myakka River. Outside, sit in the sun on the front deck and enjoy your morning coffee or afternoon tea. Harbor Cove’s lifestyle is truly unmatched. The two-story clubhouse overlooking the 90-slip marina is the heart of the community, hosting dances, trivia nights, entertainment shows, card games, billiards, picnics, and more. The o
Key facts
- Direct gulf access
- Two swimming pools
- Hot tub
Tags
Property features AI
Finance
- Other: Association name: Wayne Schofield
- Financial info: Lease restrictions apply
- HOA & community: Has HOA (annual association fee $99; monthly $8.25); Association amenities include clubhouse, pool, spa/hot tub, fitness center, recreation facilities, tennis courts, pickleball and shuffleboard courts, storage, laundry, and optional additional fees; Association fee covers common area taxes, pool, maintenance of grounds, management, and escrow reserves; buyer approval required; Senior community; Pets allowed with limits (dogs and cats; max pet weight ~40 lbs); Deed restrictions, street lights, golf carts allowed, association recreation owned
Exterior
- Parking: Carport with 2 spaces
- Utilities: Public water; Public sewer; Electricity connected; Water connected; Cable available; Broadband/high-speed internet available
- Home design: Manufactured double-wide home; One story; Faces south; Completed condition; New construction
- Construction: Vinyl siding with frame construction; Shingle roof; Crawlspace foundation; Built by Champion
- Exterior features: Covered front porch; Patio/porch with sliding doors; Outdoor lighting; Private mailbox; Storage shed(s); Flood zone (property in flood zone); Near marina; Asphalt road frontage; Publicly maintained road
Interior
- Kitchen: Dishwasher; Microwave; Range; Refrigerator; Electric water heater
- Bedrooms: 2 bedrooms
- Bathrooms: 2 full bathrooms
- Heating & cooling: Central heating (electric); Central air conditioning
- Interior features: Open floorplan; Walk-in closets; Window treatments; Blinds
- Laundry & utility: Laundry inside
Neighborhood map
What this means for you Summary
Snapshot
- This is a 2-bed/2.0-bath manufactured listed at $150k.
Deal economics
- At list price, monthly cash flow is $-57 ($-688/yr) — negative.
- To cash-flow at today's rent, offer at most $140k (6.7% below list).
- Meets the 1% rule at list price ($2k rent vs $150k).
- Recommended offer: $140k (6.7% below list) — sets the bar for cash-flow.
Location & tenants
- Location reads 66/100 on livability (#604 in FL) — a middle-class / working-renter tenant base. Strengths: cost of living A+, housing A+, crime B+; Watch: amenities F, commute F, health & safety D-.
- Sarasota (urban): math 63% / reading 63% proficiency, ranked #7 of 73 in FL (top 10%) — acceptable for families but not a draw, mixed tenant base, ~2y average lease.
- Zoned schools: Glenallen Elementary School (math 54% / reading 54%, grade C, #936 of 2,144 statewide, top 44%, 716 students, 79% FRL); Heron Creek Middle School (math 54% / reading 52%, grade C+, #209 of 571 statewide, top 37%, 902 students, 72% FRL); North Port High School (math 44% / reading 57%, grade D+, #171 of 667 statewide, top 26%, 2,562 students, 54% FRL) — zoned schools average 68% FRL vs 42% district-wide (26 pts higher); higher-poverty schools than district average — tighter screening recommended.
- Market conditions: Rents flat; 857 active listings in the ZIP; 7,466 units permitted in Sarasota County in 2024 (2,138 in 5+ unit buildings).
- This rent runs 31% of the median local income ($63k/yr) — at the standard rent-burdened threshold; future hikes will face affordability resistance.
Forward outlook
- Local home prices are declining (-3.0%/yr); year-one equity from $1k of loan paydown is wiped out by about $4k of value loss. Plan a longer hold.
- Sarasota County population projected at +20% by 2050 — long-run rental-demand tailwind backs the buy-and-hold thesis.
Negotiation context
- It's been on market 39 days — a 3% lower offer ($146k) is reasonable based on typical stale-listing flexibility.
- 2 sale attempts; this cycle's ask has dropped $15k (9%) from the opening price — seller is motivated, your offer sets the floor, not the list.
- Current owner paid $40k; list at $150k implies a 275% gain — meaningful room to come down on a strong offer.
Risks & watch-outs
- Watch-outs: flood insurance adds $427/mo.
- Climate carrying-cost: in FEMA flood zone AE (mandatory federal flood insurance); severe wind risk, 99% chance of damaging wind over 30y; major wildfire risk; extreme-heat days projected 7→29/yr by 2055 (HVAC capex compounding) — expect insurance premiums to compound above CPI over the hold.
Questions for the listing agent
- What do current leases actually rent for vs. the listed asking? Can we see a recent rent roll and the last 12 months of T-12 income?
- It's been on market 39 days. Have you received any prior offers? Is the seller open to a 7% concession, seller financing, or rate buy-down credit?
- What's the actual annual flood-insurance premium (NFIP or private), and is the property in a SFHA with mandatory coverage?
- What does the HOA fee cover, when was the last increase, and are there any pending special assessments or reserve-fund shortfalls?
- Is there a deadline driving the sale (1031 exchange, divorce, estate, relocation)? That informs how much negotiation room exists.
- Schools are D-rated, which usually means shorter tenancies and higher turnover. Who's the typical renter profile here, and what's been the actual vacancy rate?
- What's the average days-on-market for RENTAL listings here right now (not sales)? A rising rental-DOM trend means longer vacancies and softer asking-rent achievability than the comps imply.
- What's the recent tenant-quality profile in this submarket — average credit score on applications, eviction rate, late-payment / NSF rate, and stable-employment percentage? A property-management company in the area should have these aggregated.
- How much new for-sale + rental construction is in the pipeline within 1–3 miles? Heavy new supply typically softens prices + rents 12–24 months out; constrained supply supports both.
Investment metrics
- 1% rule
- 1.09% ✓
- Cap rate
- 9.25%
- Cash-on-cash
- 10.55%
- DSCR
- 1.47
- GRM
- 7.7
CMA / ARV
No comps found within radius.
Projected returns pro-forma
-3.0% appreciation · 0.26% rent growth · sell at horizon
- IRR
- -22.9%
- Equity multiple
- 0.24×
- Total profit
- $-32,113
- Equity at exit
- $22,365
- IRR
- -30.9%
- Equity multiple
- -0.16×
- Total profit
- $-48,769
- Equity at exit
- $12,969
Cash invested: $42,000 (down + closing). Projections, not guarantees.
Landlord ↔ Tenant lean methodology
- Overall (STATE)
- 87 Strongly Landlord-Friendly
- State Florida
- 87 Strongly Landlord-Friendly · R+3
- County
- — inherits STATE
- City
- — inherits STATE
ZIP-level market 34287
- Home prices YoY
- -20.1%
- Rents YoY
- 0.3%
- Active inventory
- 857
- Price-to-rent
- 7.7×
Monthly cashflow live
- Estimated rent
- $1,628 medium interval (Pro) →
- Mortgage (P&I)
- −$787
- Tax from tax record
- −$60 /mo · $719/yr
- Insurance
- −$62
- Flood insurance flood zone
- −$427 /mo · $5,118/yr
- HOA
- −$8
- Vacancy / Maint / Mgmt
- −$342
- Net cashflow
- $-57
Break-even live
Sensitivity live
| Price | -10% $28 | -5% $-15 | +0% $-57 | +5% $-100 | +10% $-142 |
|---|---|---|---|---|---|
| Rent | -10% $-186 | -5% $-122 | +0% $-57 | +5% $7 | +10% $71 |
| Rate | -1.0pp $18 | -0.5pp $-19 | base $-57 | +0.5pp $-96 | +1.0pp $-136 |
UW: 25.0% down · 7.5% · 30yr · 1.5% tax · 5.0% vac · 8.0% maint · 8.0% mgmt
Financing live
Cash to close
- Down payment
- $37,500
- Closing costs
- $4,500
- Reserves months
- —
- Total cash needed
- —
Loan-product check · same deal, 3 products live
Conventional
25% down · 7.5% · 30yr
- Down + closing
- —
- Monthly P&I
- —
- Monthly cashflow
- —
- DSCR
- —
- Eligible?
- —
Personal DTI + credit; lowest rate.
DSCR
20% down · 8.5% · 30yr
- Down + closing
- —
- Monthly P&I
- —
- Monthly cashflow
- —
- DSCR
- —
- Eligible?
- —
No personal income docs; deal must DSCR.
Hard money
10% down · 12.0% · 12mo
- Down + closing
- —
- Monthly P&I
- —
- Monthly cashflow
- —
- DSCR
- —
- Eligible?
- —
Short-term bridge; refi at stabilization.
HOA detail
- Monthly dues
- $8 · $96/yr
- Likely covers
- water
Listing history 23 events
-
2026-06-21days on market $150,000 Active 39 DOM
-
2026-06-18days on market $150,000 Active 36 DOM
-
2026-06-17days on market $150,000 Active 35 DOM
-
2026-06-16days on market $150,000 Active 34 DOM
-
2026-06-15days on market $150,000 Active 33 DOM
-
2026-06-13days on market $150,000 Active 31 DOM
-
2026-06-13days on market $150,000 Active 30 DOM
-
2026-06-10days on market $150,000 Active 28 DOM
-
2026-06-09days on market $150,000 Active 27 DOM
-
2026-06-08pricedays on market $150,000 Active 26 DOM
-
2026-06-08days on market $164,999 Active 25 DOM
-
2026-06-05days on market $164,999 Active 22 DOM
-
2026-06-03days on market $164,999 Active 21 DOM
-
2026-06-02days on market $164,999 Active 20 DOM
-
2026-06-01days on market $164,999 Active 19 DOM
-
2026-05-31days on market $164,999 Active 18 DOM
-
2026-05-13$164,999 Active 1177-char remark
-
2026-04-30historical
-
2026-03-28price $164,999
-
2026-03-13price $174,999
-
2026-02-28price $189,900
-
2026-01-04$195,000 Active
-
1993-10-20soldstatus $40,000
ⓘ Source: listings_history table (triggers on properties + properties_extension) + one-shot
backfill from property_details.listing_events for pre-trigger history.
Tax reassessment forecast FL · Resets to sale price
- Current annual tax
- $719 · $60/mo
- Projected year-2 tax
- $1,245 · $104/mo
- Expected delta
- +$526/yr (+$44/mo · 73.1%)
ⓘ Screening estimate from a state-policy table — verify with the county assessor before closing.
Climate risk First Street
- Flood 9/10 Extreme FEMA zone AE · 99% chance over 30 yrs
- Wildfire 6/10 Major
- Heat 10/10 Extreme 7 d/yr ≥107°F today · 29 d/yr by 30 yrs out
- Wind 10/10 Extreme 99% chance of damaging wind over 30 yrs
- Air quality 2/10 Low 1 unhealthy d/yr today · 1 by 30 yrs out
Nearby sold comps map
Loading sold comps map…
Walkable amenities ~0.75 mi
Loading nearby amenities…
Taxation est. · year 1
- Rental income
- $19,538
- − Mortgage interest
- −$8,402
- − Property taxes
- −$719
- − Insurance
- −$5,868
- − Repairs & maintenance
- −$1,563
- − Management
- −$1,563
- − HOA
- −$96
- − Depreciation
- −$4,364
- Taxable loss
- −$3,037
- Est. tax savings @ 24.0%
- +$729
- After-tax cash flow
- $41/yr
For passive investors: Depreciation is non-cash, so a rental often shows a tax loss while cash-flowing — sheltering income. Rental losses are passive: they offset passive income freely, and up to $25,000/yr can offset ordinary (W-2) income if you actively participate and your MAGI is under $100k (phasing out to $0 by $150k); unused losses carry forward. On sale, claimed depreciation is recaptured at up to 25%, and gains may owe capital-gains tax (a 1031 exchange can defer both). Figures are a year-1 estimate at your 24.0% rate — not tax advice; consult a CPA.
Schools (NCES district)
- District
- Sarasota
- NCES district ID
- 1201680
- Math proficiency
- 63% ▼ -8.00%
- Reading proficiency
- 63% ▼ -3.00%
- Median HH income
- $51,167
- Composite
- 53.68/100
- National rank
- #1428
- State rank
- #7 of 73 in FL
Livability — Warm Mineral Springs
- Score
- 66/100
- State rank
- #604
- US rank
- #11606
Category grades
Schools grade is shown separately in the Schools card above.
Census & demographics
- Census place
- Warm Mineral Springs, FL
- County
- Sarasota County · 448,376 people
- City population
- 75,324
- Metro
- North Port-Sarasota-Bradenton, FL
- Population (ZIP)
- 25,929
- Household income
- $63,464
- Rent vs Own
- Severe rent burden
- 522.0
Population outlook (Sarasota County) Hauer SSP2
- Today (2025)
- 452,380 people
- By 2030
- 474,175 · +4.8%
- By 2040
- 511,577 · +13.1%
- By 2050
- 541,467 · +19.7%
- By 2075
- 604,947 · +33.7%
- By 2100
- 621,965 · +37.5%
Race, ethnicity, and origin ACS 2023
- Neighborhood character
- Predominantly White (77%)
- Race & ethnicity
- White 77% Hispanic / Latino 14% Two or more races 7% Asian 4% Black 3%
- Hispanic origin (detail)
- Mexican 2% Puerto Rican 3% Cuban 3% Dominican 1%
- Common ancestry
- Romanian 4% Scotch-Irish 3% Lithuanian 3%
- Foreign-born
- 16% · Canada, Philippines
- Languages at home
- 81% English-only · Spanish 8% Russian/Polish/Slavic 5% French/Haitian/Cajun 2%
Political lean MEDSL · Sarasota
- 2024 margin
- R (+18.2) · D 40.5% · R 58.7%
- 2008→2024 swing
- -18.1pp toward R · 2008: -0.1pp · 2024: -18.2pp
- All cycles
- 2024: R+18.2 2020: R+10.4 2016: R+11.6 2012: R+7.4 2008: R+0.1
Not yet ingested
- Civics
- —
Market trends
- HPI YoY
- ▼ -70.89%
- Current HPI
- 280.8484
- Rent YoY
- ▲ 0.26%
- Metro
- North Port-Sarasota-Bradenton, FL
- State GDP YoY
- ▲ 3.28%
- F500 in state
- 36
Industry mix (Fortune 500 HQ in FL)
| Industry | F500 HQs | Revenue |
|---|---|---|
| Industrial Technology | 2 | $29B |
|
||
| Insurance | 2 | $17B |
|
||
| Retail | 1 | $60B |
|
||
| Technology Distribution | 1 | $58B |
|
||
| Homebuilding | 1 | $35B |
|
||
| Technology Manufacturing | 1 | $35B |
|
||
Price history
+275.0% since first listed8 events — show timeline
- 2026-06-08 Price Changed $150,000 Stellar MLS as Distributed by MLS Grid
- 2026-05-13 Listed $164,999 Stellar MLS as Distributed by MLS Grid
- 2026-04-30 Listing Removed — Stellar MLS as Distributed by MLS Grid
- 2026-03-28 Price Changed $164,999 Stellar MLS as Distributed by MLS Grid
- 2026-03-13 Price Changed $174,999 Stellar MLS as Distributed by MLS Grid
- 2026-02-28 Price Changed $189,900 Stellar MLS as Distributed by MLS Grid
- 2026-01-04 Listed $195,000 Stellar MLS as Distributed by MLS Grid
- 1993-10-20 Sold (Public Records) $40,000 Public Records
Property tax history
+0.8%/yrLatest (2025): $719 · +84.9% YoY. Source: county tax records.
Cash-flow waterfall
monthlySold comps — $/sqft
last 12 mo · ≤1 miLoading sold comps…