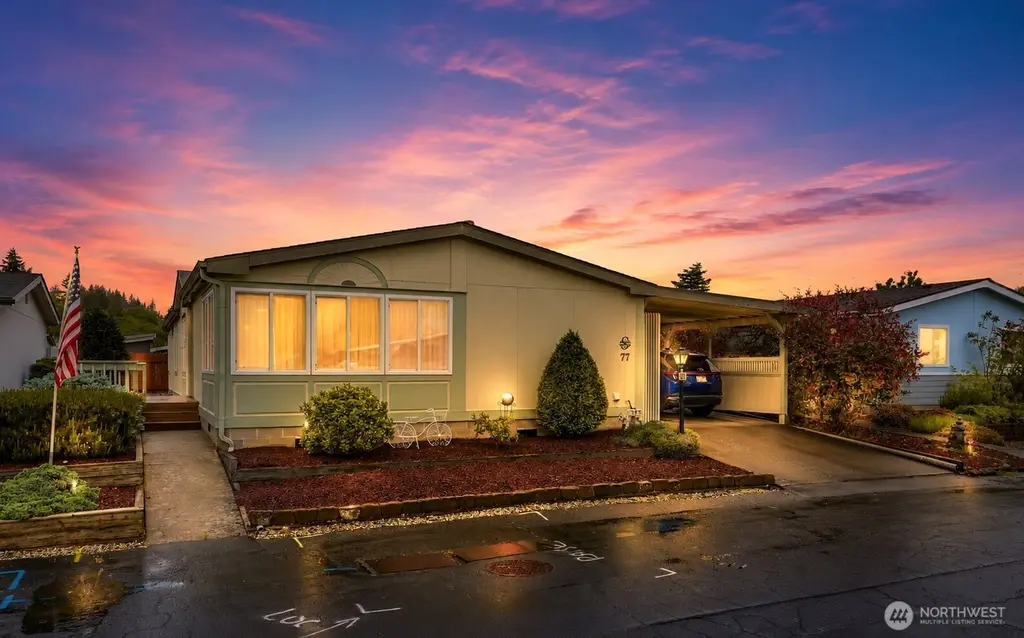
2015 24th St #77 · Bellingham, WA
Flood risk 1/10 · Minimal
- FEMA flood zone
- X (unshaded)
- Chance of flooding over 30 yrs
- 0.0%
- Est. flood insurance / yr
- $507 – $1,088
Fire risk 2/10 · Minimal
- Est. fire insurance / yr
- $604 – $1,122
Heat risk 3/10 · Minor
- Hot days now (above 83°F)
- 8 days/yr
- Hot days in 30 yrs
- 20 days/yr
Wind risk 1/10 · Minimal
- Chance of severe wind over 30 yrs
- —
Air-quality risk 6/10 · Moderate
- Unhealthy air days now
- 9 days/yr
- Unhealthy air days in 30 yrs
- 10 days/yr
Risk factors via First Street. Map © Google.
Why this score? — see what drove the C+ grade
The composite is a weighted blend of 9 inputs, each scored 0–100. Each bar is that input's sub-score; the figure is the points it added to the 100-point composite (weight × sub-score).
- Cash flow +24.9/30.0
- DSCR +8.1/10.0
- ARV discount +7.3/15.0
- 1% rule +5.6/10.0
- Schools +4.8/10.0
- Livability +4.0/5.0
- Rent growth +3.2/5.0
- Condition / age +2.5/5.0
- Appreciation +0.0/10.0
$289,900
🖨 Deal sheet 📄 Offer letter ✓ Due diligence
Listing remarks
Tucked within Parkway Village’s sought-after 55+ community in Fairhaven, this beautifully maintained home blends comfort, functionality, and lifestyle. The spacious (1,782 sqft) layout offers bright living areas, a skylit kitchen hub, generously sized bedrooms & a large primary suite with ensuite bath featuring dual vanities, soaking tub, separate shower, skylight, and abundant storage. Neutral interiors & oversized windows creates a warm, inviting feel throughout. Enjoy seamless indoor-outdoor living with a covered deck retreat directly off the kitchen slider and carport area—ideal for morning coffee, year-round entertaining, or quiet evenings outdoors. Privacy scre
Key facts
- Dual vanities
- Soaking tub
- Ensuite bath
Tags
Property features AI
Finance
- Other: Bus service nearby (Route 105)
- Financial info: Listing terms: Cash
- HOA & community: Parkway Village (manufactured home park); Park approved for sale; Senior community; Park amenities include BBQs, clubhouse, common area, exercise room, RV parking, sauna; Approximately 101 homes in the park; Monthly land lease
Exterior
- Parking: RV parking (park amenity)
- Utilities: Public water; Natural gas water heater; Public sewer; Electric and natural gas service; Cable: Xfinity/Comcast; Internet: Xfinity/Comcast; Power: Puget Sound Energy
- Home design: Manufactured double-wide home; One level; Good condition; Has a view; Make: MARLETTE, Model: 89 MARLETTE; Mobile home remains on site
- Construction: Wood construction; Composition roof; Block and concrete skirting; Slab foundation with tie-downs; Manufactured house structure
- Exterior features: Wood products exterior; Patio/porch/deck; Landscaped; Backyard storage
Interior
- Kitchen: Dishwasher; Garbage disposal; Microwave; Refrigerator; Stove/Range
- Bedrooms: 3 bedrooms
- Flooring: Engineered hardwood; Vinyl; Carpet
- Bathrooms: 2 full bathrooms; 2 bathtubs; 2 showers
- Heating & cooling: High-efficiency (90%+) forced air heating; Window cooling unit(s)
- Interior features: Water heater; Jetted/soaking tub; Skylights; Vaulted ceilings; Ceiling fan(s); Double pane windows; Drapes
- Laundry & utility: Washer; Dryer; Utility room
Neighborhood map
What this means for you Summary
Snapshot
- This is a 3-bed/2.0-bath manufactured listed at $290k.
Deal economics
- At list price, monthly cash flow is $619 ($7k/yr) — positive.
- The deal already cash-flows at list — no discount required.
- Meets the 1% rule at list price ($3k rent vs $290k).
- Cap rate 8.9% vs local median 2.0% in Bellingham — top-decile yield for the area; either an underpriced asset or a hidden risk that comps aren't pricing in. Stress-test before assuming the spread holds.
Location & tenants
- Location reads 80/100 on livability (#102 in WA, #1,947 nationally) — a professional / high-income tenant draw. Strengths: amenities A+, commute A+, health & safety A+; Watch: crime F, cost of living F.
- Bellingham School District (urban): math 47% / reading 63% proficiency, ranked #106 of 291 in WA (top 36%) — acceptable for families but not a draw, mixed tenant base, ~2y average lease.
- Zoned schools: Sehome High School (1,163 students, 25% FRL).
- Market conditions: Rents rising (+2.7%/yr); 235 active listings in the ZIP; 9 comparable units currently listed for rent nearby; rentals at typical pace (median 21d on market — plan ~3-4 weeks tenant-placement turnaround); 1,190 units permitted in Whatcom County in 2024 (327 in 5+ unit buildings).
- At $3,067/mo this rent would consume 58% of the median local household income ($64k/yr) (locally 4351% of renters already pay >50% of income on rent) — very limited rent-growth headroom before tenants either downsize or default.
Forward outlook
- Local home prices are declining (-3.0%/yr); year-one equity from $2k of loan paydown is wiped out by about $9k of value loss. Plan a longer hold.
- Whatcom County population projected at +28% by 2050 — long-run rental-demand tailwind backs the buy-and-hold thesis.
Negotiation context
- Only 13 days on market — expect competitive offers; lowballing is unlikely to land.
Questions for the listing agent
- Is there a deadline driving the sale (1031 exchange, divorce, estate, relocation)? That informs how much negotiation room exists.
- Schools are B-rated — typically a magnet for longer-tenancy family renters. What's the average tenant stay here, and is there a school-zone premium baked into asking?
- Crime grade is F in this area — have there been break-ins, vandalism, or insurance claims at this property in the last 3 years? What carrier currently insures it and at what premium?
- What's the average days-on-market for RENTAL listings here right now (not sales)? A rising rental-DOM trend means longer vacancies and softer asking-rent achievability than the comps imply.
- What's the recent tenant-quality profile in this submarket — average credit score on applications, eviction rate, late-payment / NSF rate, and stable-employment percentage? A property-management company in the area should have these aggregated.
- How much new for-sale + rental construction is in the pipeline within 1–3 miles? Heavy new supply typically softens prices + rents 12–24 months out; constrained supply supports both.
Investment metrics
- 1% rule
- 1.06% ✓
- Cap rate
- 8.85%
- Cash-on-cash
- 9.15%
- DSCR
- 1.41
- GRM
- 7.9
CMA / ARV
- ARV (on-the-fly)
- $288,684
- Comps found
- 10
Show comp detail 10 sales within ~0.75 mi
| Address | Dist | Beds/Ba | Sqft | Sold | Price | $/sf | Match |
|---|---|---|---|---|---|---|---|
| 2400 Donovan Ave #2 | 0.19mi | 3/2.0 | 1,782 (0%) | 20mo | $240,000 | $135 | 74 |
| 2015 24th St #94 | 0.13mi | 2/2.0 (-1) | 1,590 (-11%) | 2mo | $215,000 | $135 | 70 |
| 2015 24th St #86 | 0.04mi | 2/2.0 (-1) | 1,728 (-3%) | 22mo | $290,000 | $168 | 69 |
| 2015 24th St #25 | 0.05mi | 3/2.0 | 1,608 (-10%) | 20mo | $268,000 | $167 | 65 |
| 2015 24th St #102 | 0.11mi | 3/2.0 | 1,555 (-13%) | 11mo | $185,000 | $119 | 64 |
| 2015 24th St #29 | 0.02mi | 3/2.0 | 1,558 (-13%) | 18mo | $260,000 | $167 | 62 |
| 2015 24th St #24 | 0.05mi | 3/2.0 | 1,539 (-14%) | 16mo | $250,000 | $162 | 62 |
| 2015 24th St #11 | 0.13mi | 3/2.0 | 1,560 (-12%) | 20mo | $200,000 | $128 | 56 |
| 2015 24th St #33 | 0.07mi | 2/2.0 (-1) | 1,564 (-12%) | 22mo | $255,000 | $163 | 53 |
| 425 Chuckanut Dr #16 | 0.67mi | 2/2.0 (-1) | 1,604 (-10%) | 15mo | $134,000 | $84 | 35 |
Match score weights: distance 35% · size 25% · config 20% · recency 20%. Top-matched comps best support the ARV.
Projected returns pro-forma
-3.0% appreciation · 2.67% rent growth · sell at horizon
- IRR
- -2.8%
- Equity multiple
- 0.89×
- Total profit
- $-8,661
- Equity at exit
- $43,225
- IRR
- 6.5%
- Equity multiple
- 1.48×
- Total profit
- $38,753
- Equity at exit
- $25,065
Cash invested: $81,172 (down + closing). Projections, not guarantees.
Landlord ↔ Tenant lean methodology
- Overall (STATE)
- 28 Tenant-Leaning
- State Washington
- 28 Tenant-Leaning · D+8
- County
- — inherits STATE
- City
- — inherits STATE
ZIP-level market 98225
- Rents YoY
- 2.7%
- Active inventory
- 235
- Price-to-rent
- 7.9×
Monthly cashflow live
- Estimated rent
- $3,067 high interval (Pro) →
- Mortgage (P&I)
- −$1,520
- Tax from tax record
- −$163 /mo · $1,955/yr
- Insurance
- −$121
- HOA
- −$0
- Vacancy / Maint / Mgmt
- −$644
- Net cashflow
- $619
Break-even live
UW: 25.0% down · 7.5% · 30yr · 1.5% tax · 5.0% vac · 8.0% maint · 8.0% mgmt
Financing live
Cash to close
- Down payment
- $72,475
- Closing costs
- $8,697
- Reserves months
- —
- Total cash needed
- —
Loan-product check · same deal, 3 products live
Conventional
25% down · 7.5% · 30yr
- Down + closing
- —
- Monthly P&I
- —
- Monthly cashflow
- —
- DSCR
- —
- Eligible?
- —
Personal DTI + credit; lowest rate.
DSCR
20% down · 8.5% · 30yr
- Down + closing
- —
- Monthly P&I
- —
- Monthly cashflow
- —
- DSCR
- —
- Eligible?
- —
No personal income docs; deal must DSCR.
Hard money
10% down · 12.0% · 12mo
- Down + closing
- —
- Monthly P&I
- —
- Monthly cashflow
- —
- DSCR
- —
- Eligible?
- —
Short-term bridge; refi at stabilization.
Rent comps 9 comps
| Address | Beds | Baths | Sqft | Rent | $/sqft | DOM | Units | Dist |
|---|---|---|---|---|---|---|---|---|
| 1326 22nd St Bellingham, WA | 4.0 | 2.0 | 1296 | $3,450 | $2.66 | 21d | 1 | 0.47mi |
| 1324 22nd St Bellingham, WA | 4.0 | 2.0 | 1296 | $3,450 | $2.66 | 21d | 1 | 0.47mi |
| 1310 22nd St Bellingham, WA | 4.0 | 2.0 | 1296 | $3,450 | $2.66 | 21d | 1 | 0.51mi |
| 2120 Harris Ave Bellingham, WA | 4.0 | 2.0 | 1296 | $3,450 | $2.66 | 21d | 1 | 0.52mi |
| 919 24th St Bellingham, WA | 4.0 | 2.0 | 1322 | $3,195 | $2.42 | 13d | 1 | 0.80mi |
| 2305 Douglas Ave Bellingham, WA | 1.0–4.0 | 1.0–4.0 | 1089 | $2,898 | $2.66 | 13d | 16 | 0.81mi |
| 1002 21st St Bellingham, WA | 3.0 | 2.0 | 1300 | $2,550 | $1.96 | 21d | 1 | 0.81mi |
| 506 Cypress Rd Bellingham, WA | 3.0 | 2.0 | 1950 | $3,320 | $1.70 | 13d | 1 | 0.98mi |
| 3805 Elwood Ave Bellingham, WA | 4.0 | 1.0–2.5 | 1213 | $3,079 | $2.54 | 13d | 49 | 1.46mi |
Listing history 4 events
-
2026-06-01statusdays on market $289,900 Pending 13 DOM
-
2026-05-31days on market $289,900 Active Under Contract 12 DOM
-
2026-05-30days on market $289,900 Active Under Contract 11 DOM
-
2026-05-19$289,900 Active
ⓘ Source: listings_history table (triggers on properties + properties_extension) + one-shot
backfill from property_details.listing_events for pre-trigger history.
Tax reassessment forecast WA · Resets to sale price
- Current annual tax
- $1,955 · $163/mo
- Projected year-2 tax
- $2,841 · $237/mo
- Expected delta
- +$886/yr (+$74/mo · 45.3%)
ⓘ Screening estimate from a state-policy table — verify with the county assessor before closing.
Climate risk First Street
- Flood 1/10 Low FEMA zone X (unshaded) · 0% chance over 30 yrs
- Wildfire 2/10 Low
- Heat 3/10 Moderate 8 d/yr ≥83°F today · 20 d/yr by 30 yrs out
- Wind 1/10 Low
- Air quality 6/10 Major 9 unhealthy d/yr today · 10 by 30 yrs out
Nearby sold comps map
Loading sold comps map…
Walkable amenities ~0.75 mi
Loading nearby amenities…
Taxation est. · year 1
- Rental income
- $36,800
- − Mortgage interest
- −$16,239
- − Property taxes
- −$1,955
- − Insurance
- −$1,450
- − Repairs & maintenance
- −$2,944
- − Management
- −$2,944
- − Depreciation
- −$8,433
- Taxable income
- $2,835
- Est. tax owed @ 24.0%
- −$681
- After-tax cash flow
- $6,744/yr
For passive investors: Depreciation is non-cash, so a rental often shows a tax loss while cash-flowing — sheltering income. Rental losses are passive: they offset passive income freely, and up to $25,000/yr can offset ordinary (W-2) income if you actively participate and your MAGI is under $100k (phasing out to $0 by $150k); unused losses carry forward. On sale, claimed depreciation is recaptured at up to 25%, and gains may owe capital-gains tax (a 1031 exchange can defer both). Figures are a year-1 estimate at your 24.0% rate — not tax advice; consult a CPA.
Schools (NCES district)
- District
- Bellingham School District
- NCES district ID
- 5300420
- Math proficiency
- 47% ▼ -6.00%
- Reading proficiency
- 63% ▼ -1.00%
- Median HH income
- $47,678
- Composite
- 48.49/100
- National rank
- #4632
- State rank
- #106 of 291 in WA
Livability — Bellingham
- Score
- 80/100
- State rank
- #102
- US rank
- #1947
Category grades
Schools grade is shown separately in the Schools card above.
Census & demographics
- Census place
- Bellingham, WA
- County
- Whatcom County · 209,776 people
- City population
- 130,296
- Metro
- Bellingham, WA
- Population (ZIP)
- 50,216
- Household income
- $63,941
- Rent vs Own
- Severe rent burden
- 4351.0
Population outlook (Whatcom County) Hauer SSP2
- Today (2025)
- 240,408 people
- By 2030
- 254,667 · +5.9%
- By 2040
- 281,365 · +17.0%
- By 2050
- 307,592 · +27.9%
- By 2075
- 375,576 · +56.2%
- By 2100
- 421,637 · +75.4%
Race, ethnicity, and origin ACS 2023
- Neighborhood character
- Predominantly White (78%)
- Race & ethnicity
- White 78% Hispanic / Latino 10% Two or more races 9% Asian 4% Black 1%
- Hispanic origin (detail)
- Mexican 5%
- Common ancestry
- Italian 5% Portuguese 5% Slovak 4%
- Foreign-born
- 7% · Canada, China, Vietnam
- Languages at home
- 89% English-only · Spanish 6% Chinese 1% Other Indo-European 1%
Political lean MEDSL · Whatcom
- 2024 margin
- Strong D (+24.9) · D 60.8% · R 35.9% · Other 3.3%
- 2008→2024 swing
- +6.9pp toward D · 2008: 18.0pp · 2024: 24.9pp
- All cycles
- 2024: D+24.9 2020: D+23.9 2016: D+17.7 2012: D+12.1 2008: D+18.0
Not yet ingested
- Civics
- —
Market trends
- HPI YoY
- ▼ -1126.32%
- Current HPI
- 463.2721
- Rent YoY
- ▲ 2.67%
- Metro
- Bellingham, WA
- State GDP YoY
- ▲ 4.65%
- F500 in state
- 22
Industry mix (Fortune 500 HQ in WA)
| Industry | F500 HQs | Revenue |
|---|---|---|
| Retail | 2 | $269B |
|
||
| Technology / Retail | 1 | $638B |
|
||
| Technology | 1 | $245B |
|
||
| Telecommunications | 1 | $38B |
|
||
| Food / Beverage | 1 | $36B |
|
||
| Automotive / Trucks | 1 | $34B |
|
||
Price history
1 event — show timeline
- 2026-05-19 Listed $289,900 NWMLS as Distributed by MLS Grid
Property tax history
+6.3%/yrLatest (2026): $1,955 · +63.2% YoY. Source: county tax records.
Cash-flow waterfall
monthlySold comps — $/sqft
last 12 mo · ≤1 miLoading sold comps…