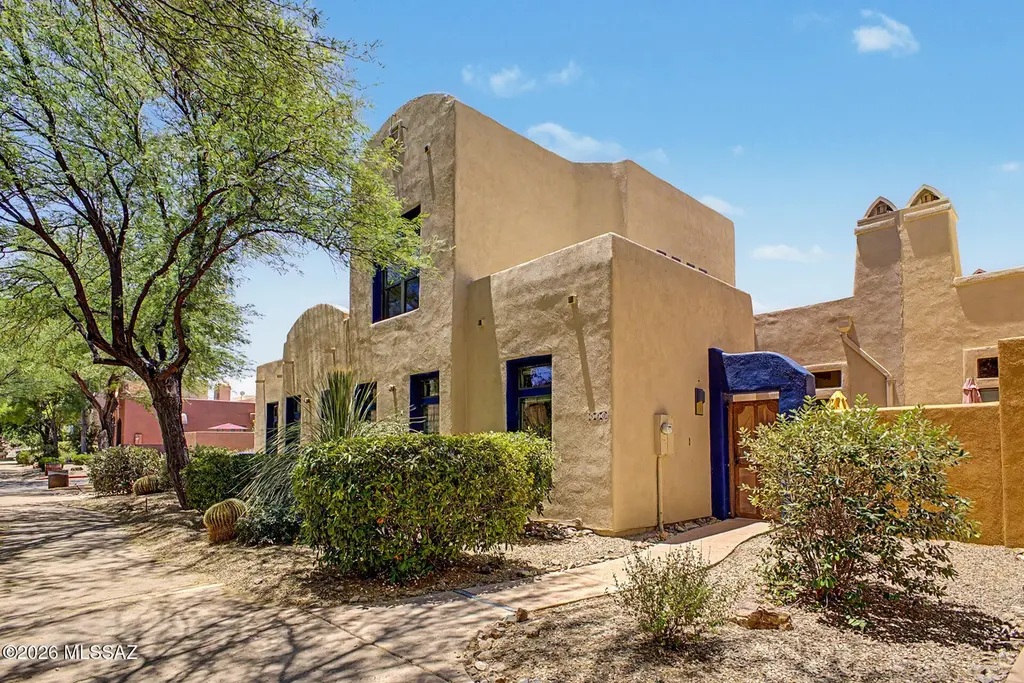
510 Post Way · Tubac, AZ
Flood risk 1/10 · Minimal
- FEMA flood zone
- X (unshaded)
- Chance of flooding over 30 yrs
- 0.0%
- Est. flood insurance / yr
- $507 – $1,088
Fire risk 7/10 · Major
- Est. fire insurance / yr
- $610 – $1,132
Heat risk 7/10 · Major
- Hot days now (above 101°F)
- 7 days/yr
- Hot days in 30 yrs
- 20 days/yr
Wind risk 1/10 · Minimal
- Chance of severe wind over 30 yrs
- —
Air-quality risk 1/10 · Minimal
- Unhealthy air days now
- 0 days/yr
- Unhealthy air days in 30 yrs
- 0 days/yr
Risk factors via First Street. Map © Google.
Why this score? — see what drove the B+ grade
The composite is a weighted blend of 9 inputs, each scored 0–100. Each bar is that input's sub-score; the figure is the points it added to the 100-point composite (weight × sub-score).
- Cash flow +30.0/30.0
- ARV discount +15.0/15.0
- DSCR +10.0/10.0
- 1% rule +9.6/10.0
- Appreciation +4.9/10.0
- Livability +3.4/5.0
- Rent growth +2.5/5.0
- Condition / age +2.5/5.0
- Schools +1.7/10.0
$274,000
🖨 Deal sheet 📄 Offer letter ✓ Due diligence
Listing remarks
Spacious Embarcadero townhome in Tubac Arizona! Interior highlights include tile flooring, beam ceilings, and kiva fireplace Enjoy Two primary suites with walk-in closets, one conveniently located on the main level, and another privately situated upstairs. Additional main floor bedroom and half bath adds versatility for guests, office, hobby space. Embarcadero amenities include fitness studio, pool, spa and walking trail connecting to the historic De Anza Trail with the Village of Tubac to the North and Tumacacori Mission to the South. Minutes away from the historic Tubac Village, consistently rated as one of the Best Small Town Arts Scenes by USA Today. Schedule your showing today!
Key facts
- Walking trail
- Tubac village
- Kiva fireplace
Tags
Property features AI
Finance
- HOA & community: Part of Embarcadero community; HOA includes common area and street maintenance; Quarterly HOA fee (monthly equivalent listed separately); Association amenities: park, pool, recreation room, spa/hot tub; Community features: pool, spa, fitness center, paved streets, sidewalks, walking trail
Exterior
- Parking: 1 covered/carport space
- Security: Smoke detectors; Wrought iron security door
- Utilities: Water from local water company; Sewer connected; Phone connected
- Home design: Townhouse; Two stories; Irregular lot dimensions; Facing east/west exposure
- Construction: Frame with stucco exterior; Stucco finish; Built-up roof
- Exterior features: Enclosed patio; Patio; Shrubs; East/West exposure; Paved road
Interior
- Kitchen: Dishwasher; Disposal; Refrigerator; Gas range; Microwave
- Bedrooms: Two-level townhouse layout
- Flooring: Carpet; Ceramic tile
- Bathrooms: 2 full bathrooms; 1 half bathroom
- Heating & cooling: Forced air heating; Central air conditioning; Ceiling fans
- Interior features: Beamed ceilings; Walk-in closet(s); High ceilings; Has fireplace (Beehive gas fireplace in great room)
- Laundry & utility: Laundry located in kitchen; Laundry closet
Neighborhood map
What this means for you Summary
Snapshot
- This is a 3-bed/2.5-bath townhouse listed at $274k.
Deal economics
- At list price, monthly cash flow is $1k ($14k/yr) — positive.
- The deal already cash-flows at list — no discount required.
- Meets the 1% rule at list price ($4k rent vs $274k).
- Recommended offer: $270k (1.5% below list) — sets the bar for market timing.
- Cap rate 11.5% vs local median 3.5% in Tubac — top-decile yield for the area; either an underpriced asset or a hidden risk that comps aren't pricing in. Stress-test before assuming the spread holds.
Location & tenants
- Location reads 67/100 on livability (#60 in AZ) — a middle-class / working-renter tenant base. Strengths: crime A+, employment A, housing A; Watch: health & safety C-, amenities F, commute F.
- Santa Cruz Valley Unified District (4458) (town): math 12% / reading 26% proficiency, ranked #184 of 249 in AZ (top 74%) — low school quality limits family demand, transient renter base, plan for 1-2y turnover; 62% free/reduced lunch — lower-income household profile, screen leases tightly.
- Zoned schools: San Cayetano Elementary School (math 2% / reading 32%, grade F, #810 of 1,109 statewide, top 73%, 393 students, 69% FRL); Coatimundi Middle School (math 16% / reading 32%, grade F, #109 of 218 statewide, top 51%, 473 students, 69% FRL); Rio Rico High School (math 13% / reading 21%, grade F, #252 of 381 statewide, top 67%, 1,414 students, 72% FRL).
- Market conditions: 155 active listings in the ZIP; 340 units permitted in Santa Cruz County in 2024 (0 in 5+ unit buildings).
Forward outlook
- In year one you build about $2k of equity ($2k loan paydown + $-389 appreciation (-0.1% local appreciation)).
- Santa Cruz County population projected at -22% by 2050 — secular population decline; favor cash flow + early exit over multi-decade hold.
- At projected returns (-0.1% appreciation + 3.0% rent growth), your $77k cash investment doubles in ~5 years — after that, you're playing with house money.
Negotiation context
- It's been on market 24 days — a 2% lower offer ($270k) is reasonable based on typical stale-listing flexibility.
- 12 sale attempts since 16y ago with the ask held roughly flat each time — persistent listings suggest the price (not the market) is what's stuck; bring a comps-based counter.
- Current owner paid $131k; list at $274k implies a 109% gain — meaningful room to come down on a strong offer.
Risks & watch-outs
- Climate carrying-cost: major wildfire risk; extreme-heat days projected 7→20/yr by 2055 (HVAC capex compounding) — expect insurance premiums to compound above CPI over the hold.
Questions for the listing agent
- What does the HOA fee cover, when was the last increase, and are there any pending special assessments or reserve-fund shortfalls?
- Is there a deadline driving the sale (1031 exchange, divorce, estate, relocation)? That informs how much negotiation room exists.
- What's the average days-on-market for RENTAL listings here right now (not sales)? A rising rental-DOM trend means longer vacancies and softer asking-rent achievability than the comps imply.
- What's the recent tenant-quality profile in this submarket — average credit score on applications, eviction rate, late-payment / NSF rate, and stable-employment percentage? A property-management company in the area should have these aggregated.
- How much new for-sale + rental construction is in the pipeline within 1–3 miles? Heavy new supply typically softens prices + rents 12–24 months out; constrained supply supports both.
Investment metrics
- 1% rule
- 1.46% ✓
- Cap rate
- 11.54%
- Cash-on-cash
- 18.74%
- DSCR
- 1.83
- GRM
- 5.7
CMA / ARV
- ARV (on-the-fly)
- $336,114
- Comps found
- 11
Show comp detail 11 sales within ~0.75 mi
| Address | Dist | Beds/Ba | Sqft | Sold | Price | $/sf | Match |
|---|---|---|---|---|---|---|---|
| 112 Post Way | 0.05mi | 3/2.0 | 1,489 (-6%) | 1mo | $280,000 | $188 | 86 |
| 1111 Lombard Way | 0.10mi | 3/2.0 | 1,607 (+2%) | 10mo | $285,000 | $177 | 82 |
| 901 Lombard Way | 0.08mi | 3/2.5 | 1,454 (-8%) | 3mo | $325,000 | $224 | 81 |
| 1611 Golden Gate Way | 0.25mi | 3/2.0 | 1,563 (-1%) | 14mo | $340,000 | $218 | 73 |
| 206 Post Way | 0.06mi | 3/2.5 | 1,480 (-6%) | 24mo | $315,000 | $213 | 67 |
| 134 Calle Barrio De Tubac | 0.05mi | 2/2.0 (-1) | 1,625 (+3%) | 24mo | $385,000 | $237 | 66 |
| 204 Post Way | 0.06mi | 2/2.5 (-1) | 1,354 (-14%) | 6mo | $280,000 | $207 | 64 |
| 114 Calle Barrio de Tubac | 0.05mi | 2/2.5 (-1) | 1,814 (+15%) | 9mo | $374,000 | $206 | 60 |
| 30 Circulo Diego Rivera | 0.40mi | 2/2.0 (-1) | 1,736 (+10%) | 1mo | $275,000 | $158 | 56 |
| 130 Calle Barrio De Tubac | 0.42mi | 2/2.0 (-1) | 1,462 (-7%) | 13mo | $425,000 | $291 | 50 |
| 2226 Paseo Tumacacori | 0.49mi | 2/2.0 (-1) | 1,804 (+14%) | 14mo | $425,000 | $236 | 34 |
Match score weights: distance 35% · size 25% · config 20% · recency 20%. Top-matched comps best support the ARV.
Projected returns pro-forma
-0.14% appreciation · 3.0% rent growth · sell at horizon
- IRR
- 18.1%
- Equity multiple
- 1.87×
- Total profit
- $66,556
- Equity at exit
- $77,623
- IRR
- 22.7%
- Equity multiple
- 3.48×
- Total profit
- $190,493
- Equity at exit
- $91,773
Cash invested: $76,720 (down + closing). Projections, not guarantees.
Landlord ↔ Tenant lean methodology
- Overall (STATE)
- 87 Strongly Landlord-Friendly
- State Arizona
- 87 Strongly Landlord-Friendly · R+3
- County
- — inherits STATE
- City
- — inherits STATE
ZIP-level market 85646
- Home prices YoY
- -0.1%
- Active inventory
- 155
- Price-to-rent
- 5.7×
Monthly cashflow live
- Estimated rent
- $3,987 medium interval (Pro) →
- Mortgage (P&I)
- −$1,437
- Tax from tax record
- −$207 /mo · $2,485/yr
- Insurance
- −$114
- HOA
- −$194
- Vacancy / Maint / Mgmt
- −$837
- Net cashflow
- $1,198
Break-even live
UW: 25.0% down · 7.5% · 30yr · 1.5% tax · 5.0% vac · 8.0% maint · 8.0% mgmt
Financing live
Cash to close
- Down payment
- $68,500
- Closing costs
- $8,220
- Reserves months
- —
- Total cash needed
- —
Loan-product check · same deal, 3 products live
Conventional
25% down · 7.5% · 30yr
- Down + closing
- —
- Monthly P&I
- —
- Monthly cashflow
- —
- DSCR
- —
- Eligible?
- —
Personal DTI + credit; lowest rate.
DSCR
20% down · 8.5% · 30yr
- Down + closing
- —
- Monthly P&I
- —
- Monthly cashflow
- —
- DSCR
- —
- Eligible?
- —
No personal income docs; deal must DSCR.
Hard money
10% down · 12.0% · 12mo
- Down + closing
- —
- Monthly P&I
- —
- Monthly cashflow
- —
- DSCR
- —
- Eligible?
- —
Short-term bridge; refi at stabilization.
HOA detail
- Monthly dues
- $194 · $2,328/yr
- Likely covers
- pool
Listing history 39 events
-
2026-06-18days on market $274,000 Active 24 DOM
-
2026-06-17days on market $274,000 Active 23 DOM
-
2026-06-16days on market $274,000 Active 22 DOM
-
2026-06-15days on market $274,000 Active 21 DOM
-
2026-06-13pricedays on market $274,000 Active 19 DOM
-
2026-06-10days on market $285,000 Active 16 DOM
-
2026-06-09days on market $285,000 Active 15 DOM
-
2026-06-08days on market $285,000 Active 14 DOM
-
2026-06-07days on market $285,000 Active 13 DOM
-
2026-06-05days on market $285,000 Active 10 DOM
-
2026-06-03days on market $285,000 Active 9 DOM
-
2026-06-02days on market $285,000 Active 8 DOM
-
2026-06-01days on market $285,000 Active 7 DOM
-
2026-05-31days on market $285,000 Active 6 DOM
-
2026-05-25$285,000 Active
-
2026-04-25historical
-
2025-10-01$295,000 Active
-
2023-09-20historical
-
2022-12-06$365,000 Active
-
2014-12-30soldstatus $131,000
-
2014-12-30soldstatus $131,000
-
2014-10-29$129,900
-
2014-09-13historical
-
2014-09-12historical
-
2013-09-13$135,000
-
2013-09-12$135,000
-
2013-08-14historical
-
2013-08-14historical
-
2013-03-11$137,500
-
2013-03-11$137,500
-
2012-10-18soldstatus $89,725
-
2012-10-18soldstatus $89,725
-
2012-06-07$109,900
-
2012-06-07$109,900
-
2011-08-30historical
-
2011-08-30historical
-
2010-08-30$195,000
-
2010-08-30$195,000
-
2006-10-20soldstatus $245,542
ⓘ Source: listings_history table (triggers on properties + properties_extension) + one-shot
backfill from property_details.listing_events for pre-trigger history.
Tax reassessment forecast AZ · Resets to sale price
- Current annual tax
- $2,485 · $207/mo
- Projected year-2 tax
- $2,485 · $207/mo
- Expected delta
- $0/yr ($0/mo · 0.0%)
ⓘ Screening estimate from a state-policy table — verify with the county assessor before closing.
Climate risk First Street
- Flood 1/10 Low FEMA zone X (unshaded) · 0% chance over 30 yrs
- Wildfire 7/10 Severe
- Heat 7/10 Severe 7 d/yr ≥101°F today · 20 d/yr by 30 yrs out
- Wind 1/10 Low
- Air quality 1/10 Low 0 unhealthy d/yr today · 0 by 30 yrs out
Nearby sold comps map
Loading sold comps map…
Walkable amenities ~0.75 mi
Loading nearby amenities…
Taxation est. · year 1
- Rental income
- $47,849
- − Mortgage interest
- −$15,348
- − Property taxes
- −$2,485
- − Insurance
- −$1,370
- − Repairs & maintenance
- −$3,828
- − Management
- −$3,828
- − HOA
- −$2,328
- − Depreciation
- −$7,971
- Taxable income
- $10,691
- Est. tax owed @ 24.0%
- −$2,566
- After-tax cash flow
- $11,809/yr
For passive investors: Depreciation is non-cash, so a rental often shows a tax loss while cash-flowing — sheltering income. Rental losses are passive: they offset passive income freely, and up to $25,000/yr can offset ordinary (W-2) income if you actively participate and your MAGI is under $100k (phasing out to $0 by $150k); unused losses carry forward. On sale, claimed depreciation is recaptured at up to 25%, and gains may owe capital-gains tax (a 1031 exchange can defer both). Figures are a year-1 estimate at your 24.0% rate — not tax advice; consult a CPA.
Schools (NCES district)
- District
- Santa Cruz Valley Unified District (4458)
- NCES district ID
- 0407520
- Math proficiency
- 12% ▼ -19.00%
- Reading proficiency
- 26% ▼ -9.00%
- Median HH income
- $48,019
- Composite
- 16.84/100
- National rank
- #9147
- State rank
- #184 of 249 in AZ
Livability — Tubac
- Score
- 67/100
- State rank
- #60
- US rank
- #10219
Category grades
Schools grade is shown separately in the Schools card above.
Census & demographics
- Census place
- Tubac, AZ
- City population
- 1,280
- Population (ZIP)
- 1,280
Population outlook (Santa Cruz County) Hauer SSP2
- Today (2025)
- 43,796 people
- By 2030
- 42,097 · -3.9%
- By 2040
- 38,235 · -12.7%
- By 2050
- 34,224 · -21.9%
- By 2075
- 26,014 · -40.6%
- By 2100
- 18,165 · -58.5%
Race, ethnicity, and origin ACS 2023
- Neighborhood character
- Predominantly White (75%)
- Race & ethnicity
- White 75% Hispanic / Latino 20% Two or more races 14% Native American 2%
- Hispanic origin (detail)
- Mexican 20%
- Common ancestry
- Slovak 5% Italian 2% Subsaharan African 2%
- Foreign-born
- 8% · Canada
- Languages at home
- 80% English-only · Spanish 20%
Political lean MEDSL · Santa Cruz
- 2024 margin
- D (+18.6) · D 58.9% · R 40.3%
- 2008→2024 swing
- -12.7pp toward R · 2008: 31.3pp · 2024: 18.6pp
- All cycles
- 2024: D+18.6 2020: D+35.5 2016: D+47.1 2012: D+37.8 2008: D+31.3
Not yet ingested
- Civics
- —
Market trends
- HPI YoY
- ▼ -0.14%
- Current HPI
- 298.5755
- Rent YoY
- —
- Metro
- —
- State GDP YoY
- ▲ 4.54%
- F500 in state
- 20
Industry mix (Fortune 500 HQ in AZ)
| Industry | F500 HQs | Revenue |
|---|---|---|
| Technology | 2 | $13B |
|
||
| Mining / Metals | 1 | $23B |
|
||
| Environmental Services | 1 | $16B |
|
||
| Metals / Steel | 1 | $14B |
|
||
| Technology Distribution | 1 | $9B |
|
||
| Homebuilding | 1 | $8B |
|
||
Price history
+16.1% since first listed25 events — show timeline
- 2026-05-25 Listed $285,000 MLSSAZ
- 2026-04-25 Listing Removed — MLSSAZ
- 2025-10-01 Listed $295,000 MLSSAZ
- 2023-09-20 Listing Removed — MLSSAZ
- 2022-12-06 Listed $365,000 MLSSAZ
- 2014-12-30 Sold (Public Records) $131,000 Public Records
- 2014-12-30 Sold (MLS) $131,000 MLSSAZ
- 2014-10-29 Listed $129,900 MLSSAZ
- 2014-09-13 Listing Removed — MLSSAZ
- 2014-09-12 Listing Removed — MLSSAZ
- 2013-09-13 Listed $135,000 MLSSAZ
- 2013-09-12 Listed $135,000 MLSSAZ
- 2013-08-14 Listing Removed — MLSSAZ
- 2013-08-14 Listing Removed — MLSSAZ
- 2013-03-11 Listed $137,500 MLSSAZ
- 2013-03-11 Listed $137,500 MLSSAZ
- 2012-10-18 Sold (MLS) $89,725 MLSSAZ
- 2012-10-18 Sold (MLS) $89,725 MLSSAZ
- 2012-06-07 Listed $109,900 MLSSAZ
- 2012-06-07 Listed $109,900 MLSSAZ
- 2011-08-30 Listing Removed — MLSSAZ
- 2011-08-30 Listing Removed — MLSSAZ
- 2010-08-30 Listed $195,000 MLSSAZ
- 2010-08-30 Listed $195,000 MLSSAZ
- 2006-10-20 Sold (Public Records) $245,542 Public Records
Property tax history
+2.9%/yrLatest (2025): $2,485 · +6.0% YoY. Source: county tax records.
Cash-flow waterfall
monthlySold comps — $/sqft
last 12 mo · ≤1 miLoading sold comps…