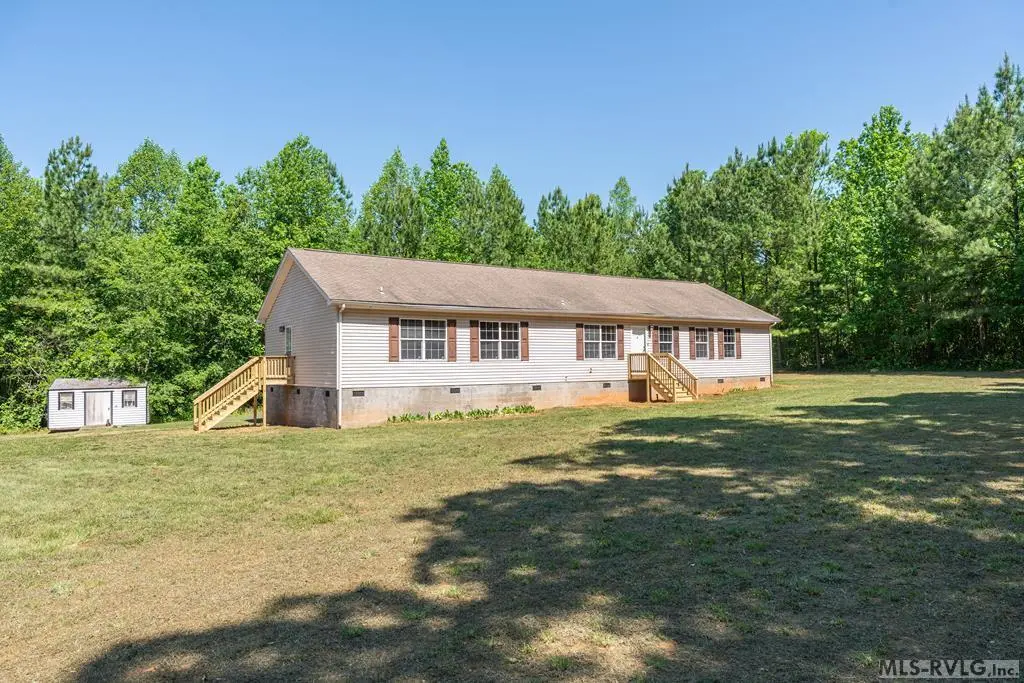
1085 Renrut Rd · Brodnax, VA
Flood risk 1/10 · Minimal
- FEMA flood zone
- X (unshaded)
- Chance of flooding over 30 yrs
- 0.0%
- Est. flood insurance / yr
- $507 – $1,088
Fire risk 4/10 · Minor
- Est. fire insurance / yr
- $666 – $1,236
Heat risk 6/10 · Moderate
- Hot days now (above 106°F)
- 7 days/yr
- Hot days in 30 yrs
- 16 days/yr
Wind risk 5/10 · Moderate
- Chance of severe wind over 30 yrs
- 25.0%
Air-quality risk 1/10 · Minimal
- Unhealthy air days now
- 0 days/yr
- Unhealthy air days in 30 yrs
- 0 days/yr
Risk factors via First Street. Map © Google.
Why this score? — see what drove the D- grade
The composite is a weighted blend of 9 inputs, each scored 0–100. Each bar is that input's sub-score; the figure is the points it added to the 100-point composite (weight × sub-score).
- Cash flow +9.5/30.0
- ARV discount +7.5/15.0
- Appreciation +6.5/10.0
- Schools +3.9/10.0
- Livability +3.1/5.0
- DSCR +2.7/10.0
- Rent growth +2.5/5.0
- Condition / age +2.5/5.0
- 1% rule +1.6/10.0
$265,000
🖨 Deal sheet 📄 Offer letter ✓ Due diligence
Listing remarks
Looking for a home that checks all the boxes for peaceful rural living? 1085 Renrut Rd delivers space, comfort, and country charm - all at an affordable price! This property is move-in ready and full of space, this beautifully maintained home sits on 4.83 acres and offers 2,280 square feet of comfortable living. Inside, you'll find 3 bedrooms, 3 full bathrooms, a BONUS room, a formal living room, formal dining room, and a cozy family room featuring a gas fireplace. The spacious primary suite includes a private retreat or office area, walk-in closet, and an oversized bath. Enjoy an open kitchen with abundant granite countertop space, ample cabinetry, and room for entertaining. Laminate, viny
Key facts
- 4.83 acres
- Gas fireplace
- Open kitchen
Tags
Property features AI
Exterior
- Security: Smoke detectors
- Utilities: Private well water; Septic tank sewer
- Home design: One-level home; Manufactured home (modular on frame)
- Construction: Vinyl siding; Composition roof
- Exterior features: Front porch; Side porch; Has view; Storage structure on property; Generator
Interior
- Kitchen: Electric oven; Electric range; Refrigerator; Dishwasher
- Bedrooms: Total rooms: 7
- Flooring: Tile; Vinyl; Laminate
- Bathrooms: 3 full bathrooms
- Heating & cooling: Heat pump heating; Central air conditioning
- Interior features: Walk-in closets; Granite counters; Fireplace in the family room
Neighborhood map
What this means for you Summary
Snapshot
- This is a 4-bed/3.0-bath single-family listed at $265k.
Deal economics
- At list price, monthly cash flow is $-184 ($-2k/yr) — negative.
- To cash-flow at today's rent, offer at most $232k (12.3% below list).
- To meet the 1% rule (rent ≥ 1% of price), the offer needs to be $176k (33.6% below list).
- Recommended offer: $176k (33.6% below list) — sets the bar for 1% rule.
Location & tenants
- Location reads 62/100 on livability (#403 in VA) — a middle-class / working-renter tenant base. Strengths: cost of living A+, housing A+, employment B; Watch: amenities F, commute F, health & safety D-.
- Lunenburg County Public School District (rural): math 33% / reading 60% proficiency, ranked #110 of 131 in VA (top 84%) — families likely to look elsewhere, expect single-tenant / working-renter base with shorter leases; 60% free/reduced lunch — lower-income household profile, screen leases tightly.
- Zoned schools: Lunenburg Middle (math 23% / reading 63%, grade D-, #288 of 342 statewide, top 85%, 332 students, 98% FRL) — zoned schools average 98% FRL vs 60% district-wide (38 pts higher); higher-poverty schools than district average — tighter screening recommended.
- Market conditions: 23 active listings in the ZIP; 25 units permitted in Lunenburg County in 2024 (0 in 5+ unit buildings).
Forward outlook
- In year one you build about $10k of equity ($2k loan paydown + $8k appreciation (3.0% local appreciation)).
- Lunenburg County population projected at -27% by 2050 — secular population decline; favor cash flow + early exit over multi-decade hold.
- By year 4, paydown + projected appreciation supports a ~$33k cash-out refi (75% LTV) — recoverable capital for the next deal without selling this one.
Negotiation context
- Only 14 days on market — expect competitive offers; lowballing is unlikely to land.
- 4 sale attempts with the ask held roughly flat each time — persistent listings suggest the price (not the market) is what's stuck; bring a comps-based counter.
- Current owner paid $20k; list at $265k implies a 1225% gain — meaningful room to come down on a strong offer.
Risks & watch-outs
- Climate carrying-cost: moderate wind risk, 25% chance of damaging wind over 30y; extreme-heat days projected 7→16/yr by 2055 (HVAC capex compounding) — expect insurance premiums to compound above CPI over the hold.
Questions for the listing agent
- What do current leases actually rent for vs. the listed asking? Can we see a recent rent roll and the last 12 months of T-12 income?
- Is there a deadline driving the sale (1031 exchange, divorce, estate, relocation)? That informs how much negotiation room exists.
- Schools are F-rated, which usually means shorter tenancies and higher turnover. Who's the typical renter profile here, and what's been the actual vacancy rate?
- The area grade is low — what's the realistic commute time and amenity access for the typical tenant pool here? Any planned neighborhood developments (good or bad) we should know about?
- What's the average days-on-market for RENTAL listings here right now (not sales)? A rising rental-DOM trend means longer vacancies and softer asking-rent achievability than the comps imply.
- What's the recent tenant-quality profile in this submarket — average credit score on applications, eviction rate, late-payment / NSF rate, and stable-employment percentage? A property-management company in the area should have these aggregated.
- How much new for-sale + rental construction is in the pipeline within 1–3 miles? Heavy new supply typically softens prices + rents 12–24 months out; constrained supply supports both.
Investment metrics
- 1% rule
- 0.66% ✗
- Cap rate
- 5.46%
- Cash-on-cash
- -2.98%
- DSCR
- 0.87
- GRM
- 12.6
CMA / ARV
No comps found within radius.
Projected returns pro-forma
3.03% appreciation · 3.0% rent growth · sell at horizon
- IRR
- 4.8%
- Equity multiple
- 1.28×
- Total profit
- $20,508
- Equity at exit
- $119,637
- IRR
- 7.9%
- Equity multiple
- 2.20×
- Total profit
- $88,752
- Equity at exit
- $184,751
Cash invested: $74,200 (down + closing). Projections, not guarantees.
Landlord ↔ Tenant lean methodology
- Overall (STATE)
- 55 Moderately Landlord-Leaning
- State Virginia
- 55 Moderately Landlord-Leaning · D+2
- County
- — inherits STATE
- City
- — inherits STATE
ZIP-level market 23920
- Home prices YoY
- 3.3%
- Active inventory
- 23
- Price-to-rent
- 12.6×
Monthly cashflow live
- Estimated rent
- $1,758 medium interval (Pro) →
- Mortgage (P&I)
- −$1,390
- Tax from tax record
- −$73 /mo · $879/yr
- Insurance
- −$110
- HOA
- −$0
- Vacancy / Maint / Mgmt
- −$369
- Net cashflow
- $-184
Break-even live
UW: 25.0% down · 7.5% · 30yr · 1.5% tax · 5.0% vac · 8.0% maint · 8.0% mgmt
Financing live
Cash to close
- Down payment
- $66,250
- Closing costs
- $7,950
- Reserves months
- —
- Total cash needed
- —
Loan-product check · same deal, 3 products live
Conventional
25% down · 7.5% · 30yr
- Down + closing
- —
- Monthly P&I
- —
- Monthly cashflow
- —
- DSCR
- —
- Eligible?
- —
Personal DTI + credit; lowest rate.
DSCR
20% down · 8.5% · 30yr
- Down + closing
- —
- Monthly P&I
- —
- Monthly cashflow
- —
- DSCR
- —
- Eligible?
- —
No personal income docs; deal must DSCR.
Hard money
10% down · 12.0% · 12mo
- Down + closing
- —
- Monthly P&I
- —
- Monthly cashflow
- —
- DSCR
- —
- Eligible?
- —
Short-term bridge; refi at stabilization.
Listing history 12 events
-
2026-06-05days on market $265,000 Active 14 DOM
-
2026-06-03days on market $265,000 Active 13 DOM
-
2026-06-02days on market $265,000 Active 12 DOM
-
2026-06-01days on market $265,000 Active 11 DOM
-
2026-05-31days on market $265,000 Active 10 DOM
-
2026-05-31days on market $265,000 Active 9 DOM
-
2026-05-21$265,000 Active
-
2025-11-20historical
-
2025-09-28$284,000 Active
-
2025-09-28$284,000 Active
-
2025-03-08$299,000 Active
-
2007-12-12soldstatus $20,000
ⓘ Source: listings_history table (triggers on properties + properties_extension) + one-shot
backfill from property_details.listing_events for pre-trigger history.
Tax reassessment forecast VA · Resets to sale price
- Current annual tax
- $879 · $73/mo
- Projected year-2 tax
- $2,173 · $181/mo
- Expected delta
- +$1,294/yr (+$108/mo · 147.1%)
ⓘ Screening estimate from a state-policy table — verify with the county assessor before closing.
Climate risk First Street
- Flood 1/10 Low FEMA zone X (unshaded) · 0% chance over 30 yrs
- Wildfire 4/10 Moderate
- Heat 6/10 Major 7 d/yr ≥106°F today · 16 d/yr by 30 yrs out
- Wind 5/10 Major 25% chance of damaging wind over 30 yrs
- Air quality 1/10 Low 0 unhealthy d/yr today · 0 by 30 yrs out
Nearby sold comps map
Loading sold comps map…
Walkable amenities ~0.75 mi
Loading nearby amenities…
Taxation est. · year 1
- Rental income
- $21,101
- − Mortgage interest
- −$14,844
- − Property taxes
- −$879
- − Insurance
- −$1,325
- − Repairs & maintenance
- −$1,688
- − Management
- −$1,688
- − Depreciation
- −$7,709
- Taxable loss
- −$7,033
- Est. tax savings @ 24.0%
- +$1,688
- After-tax cash flow
- $-523/yr
For passive investors: Depreciation is non-cash, so a rental often shows a tax loss while cash-flowing — sheltering income. Rental losses are passive: they offset passive income freely, and up to $25,000/yr can offset ordinary (W-2) income if you actively participate and your MAGI is under $100k (phasing out to $0 by $150k); unused losses carry forward. On sale, claimed depreciation is recaptured at up to 25%, and gains may owe capital-gains tax (a 1031 exchange can defer both). Figures are a year-1 estimate at your 24.0% rate — not tax advice; consult a CPA.
Schools (NCES district)
- District
- Lunenburg County Public School District
- NCES district ID
- 5102310
- Math proficiency
- 33% ▼ -41.00%
- Reading proficiency
- 60% ▼ -13.00%
- Median HH income
- $37,728
- Composite
- 38.6/100
- National rank
- #4162
- State rank
- #110 of 131 in VA
Livability — Brodnax
- Score
- 62/100
- State rank
- #403
- US rank
- #16750
Category grades
Schools grade is shown separately in the Schools card above.
Census & demographics
- Population (ZIP)
- 3,080
Population outlook (Lunenburg County) Hauer SSP2
- Today (2025)
- 11,367 people
- By 2030
- 10,757 · -5.4%
- By 2040
- 9,464 · -16.7%
- By 2050
- 8,329 · -26.7%
- By 2075
- 6,292 · -44.6%
- By 2100
- 4,575 · -59.8%
Race, ethnicity, and origin ACS 2023
- Neighborhood character
- Majority White (62%)
- Race & ethnicity
- White 62% Black 33% Hispanic / Latino 3% Two or more races 2% Asian 1%
- Common ancestry
- Iranian 1%
- Foreign-born
- 3% · Canada, South Korea
- Languages at home
- 96% English-only · Spanish 2% Korean 1% German/W. Germanic 1%
Political lean MEDSL · Lunenburg
- 2024 margin
- Strong R (+22.8) · D 38.3% · R 61.1%
- 2008→2024 swing
- -19.3pp toward R · 2008: -3.5pp · 2024: -22.8pp
- All cycles
- 2024: R+22.8 2020: R+18.6 2016: R+17.6 2012: R+5.0 2008: R+3.5
Not yet ingested
- Civics
- —
Market trends
- HPI YoY
- ▲ 3.03%
- Current HPI
- 93.8737
- Rent YoY
- —
- Metro
- —
- State GDP YoY
- ▲ 2.40%
- F500 in state
- 50
Industry mix (Fortune 500 HQ in VA)
| Industry | F500 HQs | Revenue |
|---|---|---|
| Aerospace / Defense | 4 | $236B |
|
||
| Technology / Defense | 3 | $32B |
|
||
| Financial Services | 2 | $176B |
|
||
| Utilities | 2 | $27B |
|
||
| Insurance | 2 | $25B |
|
||
| Technology | 2 | $15B |
|
||
Price history
+1225.0% since first listed6 events — show timeline
- 2026-05-21 Listed $265,000 RVLG
- 2025-11-20 Listing Removed — BRIGHT MLS
- 2025-09-28 Listed $284,000 RVLG
- 2025-09-28 Listed $284,000 BRIGHT MLS
- 2025-03-08 Listed $299,000 SCAR
- 2007-12-12 Sold (Public Records) $20,000 Public Records
Property tax history
+2.3%/yrLatest (2026): $879 · +12.1% YoY. Source: county tax records.
Cash-flow waterfall
monthlySold comps — $/sqft
last 12 mo · ≤1 miLoading sold comps…