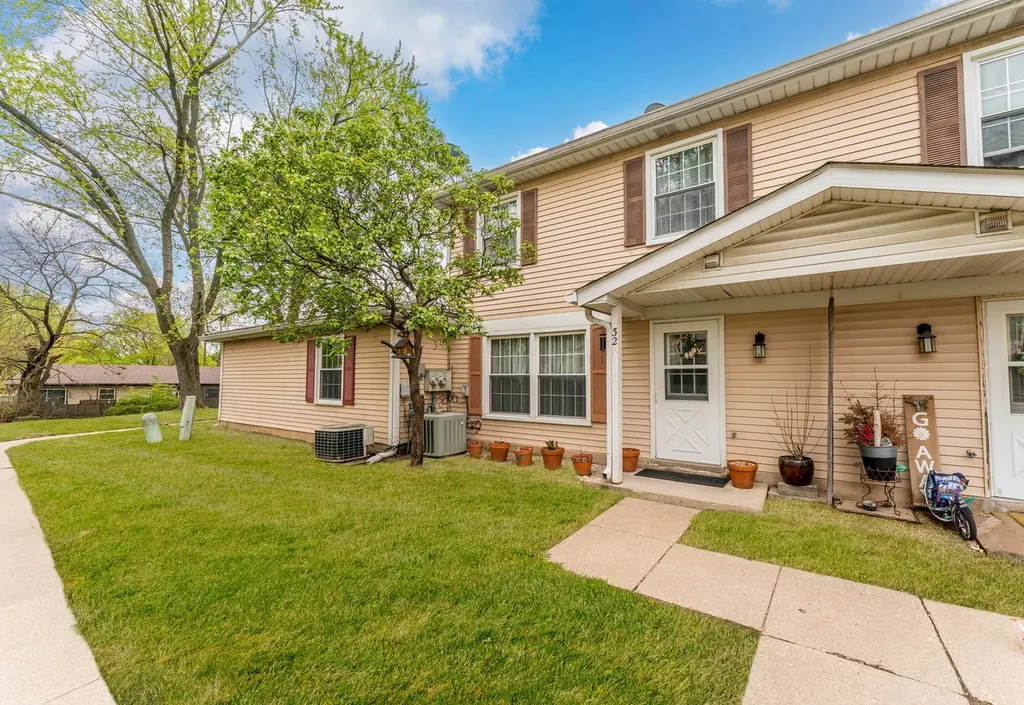
32 Wildwood Lane G · Bolingbrook, IL
Flood risk 1/10 · Minimal
- FEMA flood zone
- X (unshaded)
- Chance of flooding over 30 yrs
- 0.0%
- Est. flood insurance / yr
- $473 – $860
Fire risk 1/10 · Minimal
- Est. fire insurance / yr
- $804 – $1,492
Heat risk 3/10 · Minor
- Hot days now (above 103°F)
- 7 days/yr
- Hot days in 30 yrs
- 15 days/yr
Wind risk 2/10 · Minimal
- Chance of severe wind over 30 yrs
- —
Air-quality risk 4/10 · Minor
- Unhealthy air days now
- 4 days/yr
- Unhealthy air days in 30 yrs
- 6 days/yr
Risk factors via First Street. Map © Google.
Why this score? — see what drove the C- grade
The composite is a weighted blend of 9 inputs, each scored 0–100. Each bar is that input's sub-score; the figure is the points it added to the 100-point composite (weight × sub-score).
- Cash flow +14.3/30.0
- ARV discount +13.3/15.0
- 1% rule +6.4/10.0
- DSCR +4.4/10.0
- Livability +3.8/5.0
- Rent growth +3.5/5.0
- Condition / age +2.5/5.0
- Schools +2.3/10.0
- Appreciation +0.0/10.0
$220,000
🖨 Deal sheet (PDF) 📄 Offer letter ✓ Due diligence
Listing remarks
autiful two-story townhouse featuring 3 spacious bedrooms and 1.5 baths, thoughtfully designed for comfortable living. This well-maintained home offers a bright and functional layout, abundant storage throughout, and a convenient one-car garage. Move-in ready with nothing to do but unpack and enjoy. Ideally located in a highly desirable area with top-rated schools, this is a wonderful opportunity to own in an A-rated school district.
Key facts
- $280 HOA
- Garage
- Built 1972
Property features AI
Finance
- Other: Five units in the building; Living area is an estimate
- HOA & community: Monthly association fee of $280 covering lawn care and snow removal; Pets allowed (cats and dogs OK, max pet weight 100 lbs)
Exterior
- Parking: Attached garage (1 garage space, 1 total parking space)
- Utilities: Public water; Public sewer
- Home design: Attached single property; Townhouse — 2 story; Entry level: 1; Fee simple ownership
- Construction: Aluminum siding; Built approximately 51–60 years ago; Built before 1978
- Exterior features: Lot dimensions approximately 25 x 125; School bus service
Interior
- Kitchen: Kitchen on main level (16 x 18)
- Bedrooms: Three bedrooms; Master bedroom located on second floor (18 x 20); Second bedroom located on second floor (14 x 19); Third bedroom located on second floor (16 x 18)
- Bathrooms: One full bathroom; One half bathroom
- Heating & cooling: Natural gas heating; Central air conditioning
- Interior features: Six total rooms; Kitchen/dining combo
- Laundry & utility: In-unit laundry (laundry room on main level, 10 x 8)
Neighborhood map
What this means for you Summary
Snapshot
- This is a 3-bed/1.5-bath townhouse listed at $220k.
Deal economics
- At list price, monthly cash flow is $41 ($488/yr) — positive.
- The deal already cash-flows at list — no discount required.
- Meets the 1% rule at list price ($3k rent vs $220k).
- Recommended offer: $217k (1.5% below list) — sets the bar for market timing.
- Cap rate 6.5% vs local median 4.9% in Bolingbrook — top-decile yield for the area; either an underpriced asset or a hidden risk that comps aren't pricing in. Stress-test before assuming the spread holds.
Location & tenants
- Location reads 76/100 on livability (#199 in IL, #3,692 nationally) — a middle-class / working-renter tenant base. Strengths: employment A+, housing A+, crime A; Watch: schools D+, amenities F, health & safety F.
- Valley View CUSD 365U (suburban): math 21% / reading 28% proficiency, ranked #289 of 620 in IL (top 47%) — low school quality limits family demand, transient renter base, plan for 1-2y turnover.
- Market conditions: Rents rising fast (+4.1%/yr); 74 active listings in the ZIP; 9 comparable units currently listed for rent nearby; rentals at typical pace (median 26d on market — plan ~3-4 weeks tenant-placement turnaround); solid renter incomes; 2,028 units permitted in Will County in 2024 (530 in 5+ unit buildings).
- This rent runs 32% of the median local income ($93k/yr) — at the standard rent-burdened threshold; future hikes will face affordability resistance.
Forward outlook
- Local home prices are declining (-3.0%/yr); year-one equity from $2k of loan paydown is wiped out by about $7k of value loss. Plan a longer hold.
- Will County population projected to shrink 4% by 2050 — rents likely to lag national; underwrite the cash flow, not the appreciation.
Negotiation context
- It's been on market 28 days — a 2% lower offer ($217k) is reasonable based on typical stale-listing flexibility.
Questions for the listing agent
- Built in 1972 — when were the roof, HVAC, electrical panel, plumbing, and water heater last replaced?
- What does the HOA fee cover, when was the last increase, and are there any pending special assessments or reserve-fund shortfalls?
- Is there a deadline driving the sale (1031 exchange, divorce, estate, relocation)? That informs how much negotiation room exists.
- Schools are D-rated, which usually means shorter tenancies and higher turnover. Who's the typical renter profile here, and what's been the actual vacancy rate?
- What's the average days-on-market for RENTAL listings here right now (not sales)? A rising rental-DOM trend means longer vacancies and softer asking-rent achievability than the comps imply.
- What's the recent tenant-quality profile in this submarket — average credit score on applications, eviction rate, late-payment / NSF rate, and stable-employment percentage? A property-management company in the area should have these aggregated.
- How much new for-sale + rental construction is in the pipeline within 1–3 miles? Heavy new supply typically softens prices + rents 12–24 months out; constrained supply supports both.
Investment metrics
- 1% rule
- 1.14% ✓
- Cap rate
- 6.51%
- Cash-on-cash
- 0.79%
- DSCR
- 1.04
- GRM
- 7.3
CMA / ARV
- ARV (median comp)
- $252,258
- List price
- $220,000
- Delta
- -12.79%
- Verdict
- UNDERPRICED
- Comps
- 20 within 1.0 mi
Show comp detail 12 sales within ~0.75 mi
| Address | Dist | Beds/Ba | Sqft | Sold | Price | $/sf | Match |
|---|---|---|---|---|---|---|---|
| 23 Wildwood Ln Unit G | 0.04mi | 3/1.5 | 1,034 (0%) | 4mo | $218,000 | $211 | 94 |
| 13 Marywood Ln Unit C | 0.13mi | 3/1.0 | 1,097 (+6%) | 3mo | $225,000 | $205 | 79 |
| 20 Elm Ct #2 | 0.09mi | 3/1.5 | 1,180 (+14%) | 6mo | $215,000 | $182 | 68 |
| 238 Algonquin Ct Unit D | 0.59mi | 3/1.0 | 1,108 (+7%) | 6mo | $214,225 | $193 | 53 |
| 227 Elkhorn Ct Unit D | 0.73mi | 3/1.0 | 1,108 (+7%) | 0mo | $213,100 | $192 | 52 |
| 234 Dakota Ct Unit C | 0.63mi | 3/1.0 | 968 (-6%) | 8mo | $212,000 | $219 | 51 |
| 336 Ozark Dr | 0.52mi | 4/2.0 (+1) | 1,149 (+11%) | 1mo | $280,000 | $244 | 50 |
| 236 Algonquin Ct Unit D | 0.61mi | 3/1.0 | 950 (-8%) | 9mo | $195,000 | $205 | 49 |
| 226 Elkhorn Ct Unit B | 0.72mi | 2/1.0 (-1) | 968 (-6%) | 1mo | $203,000 | $210 | 48 |
| 225 Foxhead Ct Unit B | 0.74mi | 2/1.0 (-1) | 968 (-6%) | 1mo | $215,000 | $222 | 47 |
| 316 Pueblo Dr | 0.71mi | 2/1.0 (-1) | 1,092 (+6%) | 7mo | $190,000 | $174 | 44 |
| 240 Algonquin Ct Unit A | 0.58mi | 2/1.0 (-1) | 1,146 (+11%) | 10mo | $205,000 | $179 | 39 |
Match score weights: distance 35% · size 25% · config 20% · recency 20%. Top-matched comps best support the ARV.
Projected returns pro-forma
-3.0% appreciation · 4.1% rent growth · sell at horizon
- IRR
- -13.3%
- Equity multiple
- 0.51×
- Total profit
- $-29,966
- Equity at exit
- $32,803
- IRR
- -2.2%
- Equity multiple
- 0.84×
- Total profit
- $-9,821
- Equity at exit
- $19,022
Cash invested: $61,600 (down + closing). Projections, not guarantees.
Landlord ↔ Tenant lean methodology
- Overall (STATE)
- 43 Moderately Tenant-Leaning
- State Illinois
- 43 Moderately Tenant-Leaning · D+7
- County
- — inherits STATE
- City
- — inherits STATE
ZIP-level market 60440
- Rents YoY
- 4.1%
- Active inventory
- 74
- Price-to-rent
- 7.3×
Monthly cashflow live
- Estimated rent
- $2,502 high interval (Pro) →
- Mortgage (P&I)
- −$1,154
- Tax from tax record
- −$410 /mo · $4,925/yr
- Insurance
- −$92
- HOA
- −$280
- Vacancy / Maint / Mgmt
- −$525
- Net cashflow
- $41
Break-even live
Sensitivity live
| Price | -10% $165 | -5% $103 | +0% $41 | +5% $-22 | +10% $-84 |
|---|---|---|---|---|---|
| Rent | -10% $-157 | -5% $-58 | +0% $41 | +5% $140 | +10% $238 |
| Rate | -1.0pp $151 | -0.5pp $97 | base $41 | +0.5pp $-16 | +1.0pp $-74 |
UW: 25.0% down · 7.5% · 30yr · 1.5% tax · 5.0% vac · 8.0% maint · 8.0% mgmt
Financing live
Cash to close
- Down payment
- $55,000
- Closing costs
- $6,600
- Reserves months
- —
- Total cash needed
- —
Loan-product check · same deal, 3 products live
Conventional
25% down · 7.5% · 30yr
- Down + closing
- —
- Monthly P&I
- —
- Monthly cashflow
- —
- DSCR
- —
- Eligible?
- —
Personal DTI + credit; lowest rate.
DSCR
20% down · 8.5% · 30yr
- Down + closing
- —
- Monthly P&I
- —
- Monthly cashflow
- —
- DSCR
- —
- Eligible?
- —
No personal income docs; deal must DSCR.
Hard money
10% down · 12.0% · 12mo
- Down + closing
- —
- Monthly P&I
- —
- Monthly cashflow
- —
- DSCR
- —
- Eligible?
- —
Short-term bridge; refi at stabilization.
Rent comps 9 comps
| Address | Beds | Baths | Sqft | Rent | $/sqft | DOM | Units | Dist |
|---|---|---|---|---|---|---|---|---|
| 238 Algonquin Ct Unit D Bolingbrook, IL | 3.0 | 1.0 | 1108 | $2,250 | $2.03 | 8d | 1 | 0.59mi |
| 231 Dakota Ct Unit B Bolingbrook, IL | 2.0 | 1.0 | 968 | $1,850 | $1.91 | 44d | 1 | 0.65mi |
| 230 Dakota Ct Unit B Bolingbrook, IL | 3.0 | 1.0 | 1400 | $2,200 | $1.57 | 25d | 1 | 0.65mi |
| 176 Fairwood Dr Bolingbrook, IL | 3.0 | 1.5 | 1162 | $2,166 | $1.86 | 44d | 1 | 0.74mi |
| 239 Malibu Dr Bolingbrook, IL | 3.0 | 1.5 | 975 | $2,550 | $2.62 | 20d | 1 | 0.77mi |
| 131 Enclave Cir Unit C Bolingbrook, IL | 2.0 | 1.5 | 1498 | $2,499 | $1.67 | 21d | 1 | 0.79mi |
| 513 Monroe Rd Bolingbrook, IL | 2.0 | 2.5 | 1200 | $2,495 | $2.08 | 25d | 1 | 1.01mi |
| 228 Monroe Rd Bolingbrook, IL | 3.0 | 1.5 | 1180 | $2,600 | $2.20 | 44d | 1 | 1.03mi |
| 451 Yorkshire Sq Unit 451 Bolingbrook, IL | 3.0 | 1.5 | 1470 | $2,400 | $1.63 | 8d | 1 | 1.30mi |
HOA detail
- Monthly dues
- $280 · $3,360/yr
Listing history 4 events
-
2026-06-13statusdays on market $220,000 Pending 28 DOM
-
2026-04-30$220,000 Active 437-char remark
-
2006-10-02soldstatus $143,900
-
1987-05-01soldstatus $36,000
ⓘ Source: listings_history table (triggers on properties + properties_extension) + one-shot
backfill from property_details.listing_events for pre-trigger history.
Tax reassessment forecast IL · Partial reset (capped growth)
- Current annual tax
- $4,925 · $410/mo
- Projected year-2 tax
- $4,959 · $413/mo
- Expected delta
- +$35/yr (+$3/mo · 0.7%)
ⓘ Screening estimate from a state-policy table — verify with the county assessor before closing.
Climate risk First Street
- Flood 1/10 Low FEMA zone X (unshaded) · 0% chance over 30 yrs
- Wildfire 1/10 Low
- Heat 3/10 Moderate 7 d/yr ≥103°F today · 15 d/yr by 30 yrs out
- Wind 2/10 Low
- Air quality 4/10 Moderate 4 unhealthy d/yr today · 6 by 30 yrs out
Nearby sold comps map
Loading sold comps map…
Walkable amenities ~0.75 mi
Loading nearby amenities…
Taxation est. · year 1
- Rental income
- $30,022
- − Mortgage interest
- −$12,323
- − Property taxes
- −$4,925
- − Insurance
- −$1,100
- − Repairs & maintenance
- −$2,402
- − Management
- −$2,402
- − HOA
- −$3,360
- − Depreciation
- −$6,400
- Taxable loss
- −$2,890
- Est. tax savings @ 24.0%
- +$694
- After-tax cash flow
- $1,182/yr
For passive investors: Depreciation is non-cash, so a rental often shows a tax loss while cash-flowing — sheltering income. Rental losses are passive: they offset passive income freely, and up to $25,000/yr can offset ordinary (W-2) income if you actively participate and your MAGI is under $100k (phasing out to $0 by $150k); unused losses carry forward. On sale, claimed depreciation is recaptured at up to 25%, and gains may owe capital-gains tax (a 1031 exchange can defer both). Figures are a year-1 estimate at your 24.0% rate — not tax advice; consult a CPA.
Schools (NCES district)
- District
- Valley View CUSD 365U
- NCES district ID
- 1740070
- Math proficiency
- 21% ▼ -15.00%
- Reading proficiency
- 28% ▼ -10.00%
- Median HH income
- $69,424
- Composite
- 23.48/100
- National rank
- #7875
- State rank
- #289 of 620 in IL
Livability — Bolingbrook
- Score
- 76/100
- State rank
- #199
- US rank
- #3692
Category grades
Schools grade is shown separately in the Schools card above.
Census & demographics
- Census place
- Bolingbrook, IL
- County
- Will County · 412,448 people
- City population
- 74,096
- Metro
- Chicago-Naperville-Elgin, IL-IN-WI
- Population (ZIP)
- 51,940
- Household income
- $93,494
- Rent vs Own
- Severe rent burden
- 1149.0
Population outlook (Will County) Hauer SSP2
- Today (2025)
- 705,368 people
- By 2030
- 708,154 · +0.4%
- By 2040
- 702,692 · -0.4%
- By 2050
- 680,249 · -3.6%
- By 2075
- 611,990 · -13.2%
- By 2100
- 516,215 · -26.8%
Race, ethnicity, and origin ACS 2023
- Neighborhood character
- Highly diverse neighborhood (Simpson 0.72)
- Race & ethnicity
- White 36% Hispanic / Latino 33% Black 19% Two or more races 15% Asian 10%
- Hispanic origin (detail)
- Mexican 30%
- Common ancestry
- Romanian 7% Lithuanian 1% Italian 1%
- Foreign-born
- 23% · Canada, China, South Korea
- Languages at home
- 62% English-only · Spanish 26% Other Indo-European 5% Tagalog/Filipino 2%
Political lean MEDSL · Will
- 2024 margin
- Toss-up / Even · D 50.1% · R 48.5% · Other 1.4%
- 2008→2024 swing
- -11.6pp toward R · 2008: 13.2pp · 2024: 1.6pp
- All cycles
- 2024: D+1.6 2020: D+8.3 2016: D+5.7 2012: D+3.7 2008: D+13.2
Not yet ingested
- Civics
- —
Market trends
- HPI YoY
- ▼ -256.14%
- Current HPI
- 246.1906
- Rent YoY
- ▲ 4.10%
- Metro
- Chicago-Naperville-Elgin, IL-IN-WI
- State GDP YoY
- ▲ 1.59%
- F500 in state
- 60
Industry mix (Fortune 500 HQ in IL)
| Industry | F500 HQs | Revenue |
|---|---|---|
| Insurance | 4 | $201B |
|
||
| Consumer Goods | 4 | $87B |
|
||
| Industrial Machinery | 3 | $64B |
|
||
| Healthcare | 2 | $55B |
|
||
| Retail / Pharmacy | 1 | $148B |
|
||
| Agriculture / Food | 1 | $86B |
|
||
Price history
+511.1% since first listed7 events — show timeline
- 2026-06-15 Sold (MLS) $220,000 MRED as Distributed by MLS Grid
- 2026-06-11 Pending — MRED as Distributed by MLS Grid
- 2026-05-29 Sold (MLS) $220,000 MRED as Distributed by MLS Grid
- 2026-05-21 Contingent — MRED as Distributed by MLS Grid
- 2026-04-30 Listed $220,000 MRED as Distributed by MLS Grid
- 2006-10-02 Sold (Public Records) $143,900 Public Records
- 1987-05-01 Sold (Public Records) $36,000 Public Records
Property tax history
+4.0%/yrLatest (2024): $4,925 · +7.6% YoY. Source: county tax records.
Cash-flow waterfall
monthlySold comps — $/sqft
last 12 mo · ≤1 miLoading sold comps…