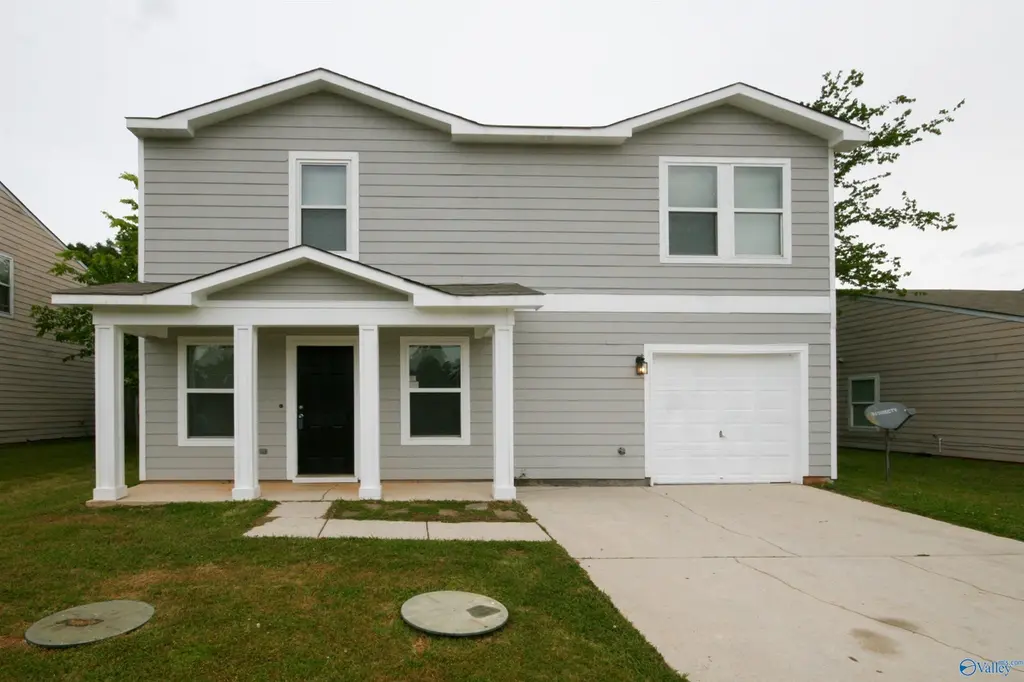
138 Bayside Ln · Harvest, AL
Flood risk 1/10 · Minimal
- FEMA flood zone
- X (unshaded)
- Chance of flooding over 30 yrs
- 0.0%
- Est. flood insurance / yr
- $507 – $1,088
Fire risk 3/10 · Minor
- Est. fire insurance / yr
- $916 – $1,700
Heat risk 5/10 · Moderate
- Hot days now (above 104°F)
- 7 days/yr
- Hot days in 30 yrs
- 19 days/yr
Wind risk 4/10 · Minor
- Chance of severe wind over 30 yrs
- 17.0%
Air-quality risk 1/10 · Minimal
- Unhealthy air days now
- 0 days/yr
- Unhealthy air days in 30 yrs
- 0 days/yr
Risk factors via First Street. Map © Google.
Why this score? — see what drove the D- grade
The composite is a weighted blend of 9 inputs, each scored 0–100. Each bar is that input's sub-score; the figure is the points it added to the 100-point composite (weight × sub-score).
- Appreciation +10.0/10.0
- Cash flow +8.2/30.0
- ARV discount +4.0/15.0
- Schools +3.7/10.0
- Livability +3.6/5.0
- Rent growth +2.5/5.0
- Condition / age +2.5/5.0
- DSCR +2.2/10.0
- 1% rule +1.5/10.0
$224,900
🖨 Deal sheet (PDF) 📄 Offer letter ✓ Due diligence
Listing remarks
138 BAYSIDE LANE, TONEY AL 35773 - Incredible 2-story home with an open floor plan - This home offers 3 bedrooms, 2 full baths, LVP Flooring on main level - Outside features include a large rear yard, one car garage and near shopping and schools - This home is eligible for no-money down with Rural Development - Call for private showing!
Key facts
- 9,300 sq ft lot
- Garage
- Built 2008
Property features AI
Finance
- Other: Lot dimensions approximately 155 x 60; Living area approximately 1,500 square feet
- HOA & community: No homeowners association; Subdivision: Carillo Bay
Exterior
- Parking: One-car garage facing front
- Utilities: Public water; Septic tank
- Home design: Single-family residence; Residential property; Built in 2008; Frame construction
- Construction: Slab foundation
- Exterior features: Public water; Septic tank
Interior
- Kitchen: Range; Dishwasher; Microwave; Refrigerator
- Bathrooms: 2 full bathrooms
- Heating & cooling: Central heating; Central cooling
- Interior features: Two levels; No fireplaces
Neighborhood map
What this means for you Summary
Snapshot
- This is a 3-bed/1.0-bath single-family listed at $225k.
Deal economics
- At list price, monthly cash flow is $-210 ($-3k/yr) — negative.
- To cash-flow at today's rent, offer at most $188k (16.5% below list).
- To meet the 1% rule (rent ≥ 1% of price), the offer needs to be $147k (34.5% below list).
- Recommended offer: $147k (34.5% below list) — sets the bar for 1% rule.
- Cap rate 5.2% vs local median 3.5% in Harvest — top-decile yield for the area; either an underpriced asset or a hidden risk that comps aren't pricing in. Stress-test before assuming the spread holds.
Location & tenants
- Location reads 72/100 on livability (#27 in AL) — a middle-class / working-renter tenant base. Strengths: crime A+, employment A+, cost of living A+; Watch: amenities F, commute F, health & safety F.
- Madison County (rural): math 27% / reading 56% proficiency, ranked #19 of 129 in AL (top 15%) — families likely to look elsewhere, expect single-tenant / working-renter base with shorter leases.
- Zoned schools: Madison Cross Roads Elementary School (math 14% / reading 48%, grade F, #360 of 627 statewide, top 58%, 1,035 students, 59% FRL); Sparkman Middle School (math 18% / reading 53%, grade F, #81 of 257 statewide, top 33%, 859 students, 60% FRL); Sparkman High School (math 28% / reading 37%, grade F, #58 of 305 statewide, top 19%, 1,738 students, 37% FRL) — zoned schools average 52% FRL vs 29% district-wide (23 pts higher); higher-poverty schools than district average — tighter screening recommended.
- Market conditions: 326 active listings in the ZIP; 5 comparable units currently listed for rent nearby; rentals lingering (median 46d on market — plan ~5-8 weeks vacancy on turnover, expect pricing pressure); 80% of comp listings sitting > 30 days — soft ceiling on asking rent; 4,709 units permitted in Madison County in 2024 (1,186 in 5+ unit buildings).
Forward outlook
- In year one you build about $24k of equity ($2k loan paydown + $22k appreciation (10.0% local appreciation)).
- Madison County population projected at +18% by 2050 — long-run rental-demand tailwind backs the buy-and-hold thesis.
- By year 2, paydown + projected appreciation supports a ~$39k cash-out refi (75% LTV) — recoverable capital for the next deal without selling this one.
Negotiation context
- It's been on market 32 days — a 3% lower offer ($218k) is reasonable based on typical stale-listing flexibility.
- 4 sale attempts since 11y ago with the ask held roughly flat each time — persistent listings suggest the price (not the market) is what's stuck; bring a comps-based counter.
- Current owner paid $129k; list at $225k implies a 74% gain — meaningful room to come down on a strong offer.
Risks & watch-outs
- Climate carrying-cost: extreme-heat days projected 7→19/yr by 2055 (HVAC capex compounding) — expect insurance premiums to compound above CPI over the hold.
Questions for the listing agent
- What do current leases actually rent for vs. the listed asking? Can we see a recent rent roll and the last 12 months of T-12 income?
- It's been on market 32 days. Have you received any prior offers? Is the seller open to a 35% concession, seller financing, or rate buy-down credit?
- Is there a deadline driving the sale (1031 exchange, divorce, estate, relocation)? That informs how much negotiation room exists.
- The area grade is low — what's the realistic commute time and amenity access for the typical tenant pool here? Any planned neighborhood developments (good or bad) we should know about?
- What's the average days-on-market for RENTAL listings here right now (not sales)? A rising rental-DOM trend means longer vacancies and softer asking-rent achievability than the comps imply.
- What's the recent tenant-quality profile in this submarket — average credit score on applications, eviction rate, late-payment / NSF rate, and stable-employment percentage? A property-management company in the area should have these aggregated.
- How much new for-sale + rental construction is in the pipeline within 1–3 miles? Heavy new supply typically softens prices + rents 12–24 months out; constrained supply supports both.
Investment metrics
- 1% rule
- 0.65% ✗
- Cap rate
- 5.17%
- Cash-on-cash
- -4.00%
- DSCR
- 0.82
- GRM
- 12.7
CMA / ARV
- ARV (on-the-fly)
- $208,500
- Comps found
- 7
Show comp detail 7 sales within ~0.75 mi
| Address | Dist | Beds/Ba | Sqft | Sold | Price | $/sf | Match |
|---|---|---|---|---|---|---|---|
| 139 Carillo Ln | 0.08mi | 3/2.0 | 1,481 (-1%) | 0mo | $228,000 | $154 | 90 |
| 151 Carillo Ln | 0.13mi | 3/2.0 | 1,448 (-4%) | 3mo | $221,500 | $153 | 82 |
| 159 Bayside Ln | 0.13mi | 3/2.0 | 1,435 (-4%) | 20mo | $199,900 | $139 | 66 |
| 151 Bayside Ln | 0.08mi | 3/2.5 | 1,704 (+14%) | 10mo | $215,000 | $126 | 59 |
| 188 Bayside Ln | 0.23mi | 3/2.0 | 1,680 (+12%) | 24mo | $224,000 | $133 | 46 |
| 112 Springbok Dr | 0.37mi | 3/2.5 | 1,652 (+10%) | 19mo | $223,800 | $135 | 44 |
| 305 Counterpoint Dr | 0.50mi | 3/2.5 | 1,667 (+11%) | 17mo | $235,000 | $141 | 38 |
Match score weights: distance 35% · size 25% · config 20% · recency 20%. Top-matched comps best support the ARV.
Projected returns pro-forma
10.0% appreciation · 3.0% rent growth · sell at horizon
- IRR
- 21.4%
- Equity multiple
- 2.73×
- Total profit
- $109,040
- Equity at exit
- $202,608
- IRR
- 19.3%
- Equity multiple
- 6.26×
- Total profit
- $331,431
- Equity at exit
- $436,931
Cash invested: $62,972 (down + closing). Projections, not guarantees.
Landlord ↔ Tenant lean methodology
- Overall (STATE)
- 90 Strongly Landlord-Friendly
- State Alabama
- 90 Strongly Landlord-Friendly · R+15
- County
- — inherits STATE
- City
- — inherits STATE
ZIP-level market 35773
- Home prices YoY
- 28.8%
- Active inventory
- 326
- Price-to-rent
- 12.7×
Monthly cashflow live
- Estimated rent
- $1,473 high interval (Pro) →
- Mortgage (P&I)
- −$1,179
- Tax from tax record
- −$100 /mo · $1,202/yr
- Insurance
- −$94
- HOA
- −$0
- Vacancy / Maint / Mgmt
- −$309
- Net cashflow
- $-210
Break-even live
Sensitivity live
| Price | -10% $-82 | -5% $-146 | +0% $-210 | +5% $-273 | +10% $-337 |
|---|---|---|---|---|---|
| Rent | -10% $-326 | -5% $-268 | +0% $-210 | +5% $-152 | +10% $-93 |
| Rate | -1.0pp $-96 | -0.5pp $-153 | base $-210 | +0.5pp $-268 | +1.0pp $-327 |
UW: 25.0% down · 7.5% · 30yr · 1.5% tax · 5.0% vac · 8.0% maint · 8.0% mgmt
Financing live
Cash to close
- Down payment
- $56,225
- Closing costs
- $6,747
- Reserves months
- —
- Total cash needed
- —
Loan-product check · same deal, 3 products live
Conventional
25% down · 7.5% · 30yr
- Down + closing
- —
- Monthly P&I
- —
- Monthly cashflow
- —
- DSCR
- —
- Eligible?
- —
Personal DTI + credit; lowest rate.
DSCR
20% down · 8.5% · 30yr
- Down + closing
- —
- Monthly P&I
- —
- Monthly cashflow
- —
- DSCR
- —
- Eligible?
- —
No personal income docs; deal must DSCR.
Hard money
10% down · 12.0% · 12mo
- Down + closing
- —
- Monthly P&I
- —
- Monthly cashflow
- —
- DSCR
- —
- Eligible?
- —
Short-term bridge; refi at stabilization.
Rent comps 5 comps
| Address | Beds | Baths | Sqft | Rent | $/sqft | DOM | Units | Dist |
|---|---|---|---|---|---|---|---|---|
| 165 Cloverbrook Dr Harvest, AL | 3.0 | 2.0 | 1212 | $1,520 | $1.25 | 45d | 1 | 0.43mi |
| 183 Cloverbrook Dr Harvest, AL | 3.0 | 2.0 | 1200 | $1,373 | $1.14 | 45d | 1 | 0.44mi |
| 321 Counter Point Dr Harvest, AL | 3.0 | 2.5 | 2200 | $1,506 | $0.68 | 45d | 1 | 0.46mi |
| 198 Cloverbrook Dr Harvest, AL | 3.0 | 2.0 | 1397 | $1,375 | $0.98 | 25d | 1 | 0.49mi |
| 674 Harvest Rd Harvest, AL | 4.0 | 2.0 | 1661 | $1,850 | $1.11 | 45d | 1 | 1.49mi |
Listing history 24 events
-
2026-06-22days on market $224,900 Active 32 DOM
-
2026-06-18days on market $224,900 Active 29 DOM
-
2026-06-17days on market $224,900 Active 28 DOM
-
2026-06-16days on market $224,900 Active 27 DOM
-
2026-06-15days on market $224,900 Active 26 DOM
-
2026-06-14days on market $224,900 Active 24 DOM
-
2026-06-10days on market $224,900 Active 21 DOM
-
2026-06-09days on market $224,900 Active 20 DOM
-
2026-06-08days on market $224,900 Active 19 DOM
-
2026-06-07days on market $224,900 Active 18 DOM
-
2026-06-02days on market $224,900 Active 13 DOM
-
2026-06-01days on market $224,900 Active 12 DOM
-
2026-05-31days on market $224,900 Active 11 DOM
-
2026-05-30days on market $224,900 Active 10 DOM
-
2026-05-20$224,900 Active
-
2020-05-22soldstatus $129,000
-
2020-04-15historical
-
2020-04-05$129,900 Active
-
2020-03-27historical
-
2020-02-17$129,000
-
2016-06-07soldstatus $411,000
-
2016-03-10soldstatus $56,000
-
2016-03-08soldstatus $56,000
-
2015-10-21$59,900
ⓘ Source: listings_history table (triggers on properties + properties_extension) + one-shot
backfill from property_details.listing_events for pre-trigger history.
Tax reassessment forecast AL · Resets to sale price
- Current annual tax
- $1,202 · $100/mo
- Projected year-2 tax
- $1,202 · $100/mo
- Expected delta
- $0/yr ($0/mo · 0.0%)
ⓘ Screening estimate from a state-policy table — verify with the county assessor before closing.
Climate risk First Street
- Flood 1/10 Low FEMA zone X (unshaded) · 0% chance over 30 yrs
- Wildfire 3/10 Moderate
- Heat 5/10 Major 7 d/yr ≥104°F today · 19 d/yr by 30 yrs out
- Wind 4/10 Moderate 17% chance of damaging wind over 30 yrs
- Air quality 1/10 Low 0 unhealthy d/yr today · 0 by 30 yrs out
Nearby sold comps map
Loading sold comps map…
Walkable amenities ~0.75 mi
Loading nearby amenities…
Taxation est. · year 1
- Rental income
- $17,675
- − Mortgage interest
- −$12,598
- − Property taxes
- −$1,202
- − Insurance
- −$1,124
- − Repairs & maintenance
- −$1,414
- − Management
- −$1,414
- − Depreciation
- −$6,543
- Taxable loss
- −$6,621
- Est. tax savings @ 24.0%
- +$1,589
- After-tax cash flow
- $-928/yr
For passive investors: Depreciation is non-cash, so a rental often shows a tax loss while cash-flowing — sheltering income. Rental losses are passive: they offset passive income freely, and up to $25,000/yr can offset ordinary (W-2) income if you actively participate and your MAGI is under $100k (phasing out to $0 by $150k); unused losses carry forward. On sale, claimed depreciation is recaptured at up to 25%, and gains may owe capital-gains tax (a 1031 exchange can defer both). Figures are a year-1 estimate at your 24.0% rate — not tax advice; consult a CPA.
Schools (NCES district)
- District
- Madison County
- NCES district ID
- 0102220
- Math proficiency
- 27% ▼ -32.00%
- Reading proficiency
- 56% ▼ -1.00%
- Median HH income
- $66,058
- Composite
- 37.15/100
- National rank
- #4483
- State rank
- #19 of 129 in AL
Livability — Harvest
- Score
- 72/100
- State rank
- #27
- US rank
- #5986
Category grades
Schools grade is shown separately in the Schools card above.
Census & demographics
- City population
- 30,710
- Population (ZIP)
- 13,977
Population outlook (Madison County) Hauer SSP2
- Today (2025)
- 392,086 people
- By 2030
- 409,788 · +4.5%
- By 2040
- 440,557 · +12.4%
- By 2050
- 460,990 · +17.6%
- By 2075
- 502,872 · +28.3%
- By 2100
- 513,623 · +31.0%
Race, ethnicity, and origin ACS 2023
- Neighborhood character
- Predominantly White (72%)
- Race & ethnicity
- White 72% Black 17% Hispanic / Latino 7% Two or more races 3% Asian 2%
- Hispanic origin (detail)
- Mexican 5%
- Common ancestry
- Italian 3% Slovak 1% Serbian 1%
- Foreign-born
- 2% · Canada
- Languages at home
- 95% English-only · Spanish 4%
Political lean MEDSL · Madison
- 2024 margin
- Lean R (+9.0) · D 44.7% · R 53.7% · Other 1.6%
- 2008→2024 swing
- +6.0pp toward D · 2008: -14.9pp · 2024: -9.0pp
- All cycles
- 2024: R+9.0 2020: R+8.0 2016: R+16.8 2012: R+18.7 2008: R+14.9
Not yet ingested
- Civics
- —
Market trends
- HPI YoY
- ▲ 149.14%
- Current HPI
- 666.8602
- Rent YoY
- —
- Metro
- —
- State GDP YoY
- ▲ 2.94%
- F500 in state
- 4
Industry mix (Fortune 500 HQ in AL)
| Industry | F500 HQs | Revenue |
|---|---|---|
| Financial Services | 1 | $8B |
|
||
| Healthcare | 1 | $5B |
|
||
Price history
+275.5% since first listed10 events — show timeline
- 2026-05-20 Listed $224,900 VMLS
- 2020-05-22 Sold (Public Records) $129,000 Public Records
- 2020-04-15 Delisted — VMLS
- 2020-04-05 Listed $129,900 VMLS
- 2020-03-27 Delisted — VMLS
- 2020-02-17 Listed $129,000 VMLS
- 2016-06-07 Sold (Public Records) $411,000 Public Records
- 2016-03-10 Sold (Public Records) $56,000 Public Records
- 2016-03-08 Sold (MLS) $56,000 VMLS
- 2015-10-21 Listed $59,900 VMLS
Property tax history
+16.2%/yrLatest (2024): $1,202 · +0.0% YoY. Source: county tax records.
Cash-flow waterfall
monthlySold comps — $/sqft
last 12 mo · ≤1 miLoading sold comps…