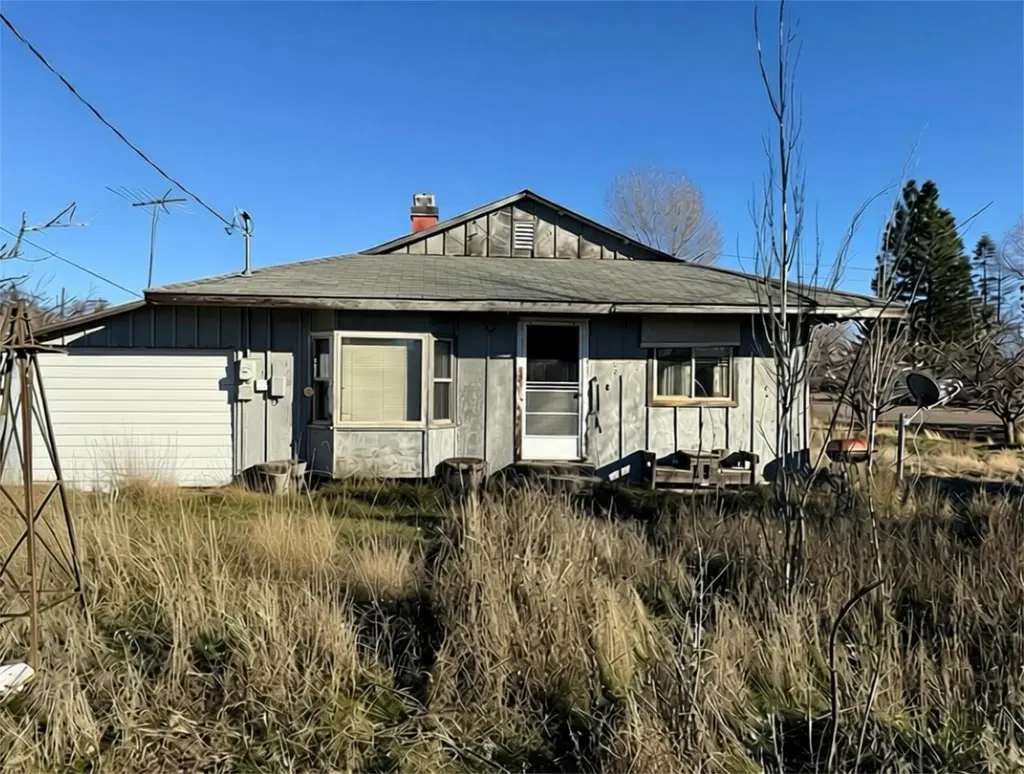
209 Second St · Bieber, CA
Flood risk 4/10 · Minor
- FEMA flood zone
- X (unshaded)
- Chance of flooding over 30 yrs
- 0.17%
- Est. flood insurance / yr
- $507 – $1,088
Fire risk 7/10 · Major
- Est. fire insurance / yr
- $659 – $1,223
Heat risk 4/10 · Minor
- Hot days now (above 91°F)
- 7 days/yr
- Hot days in 30 yrs
- 17 days/yr
Wind risk 1/10 · Minimal
- Chance of severe wind over 30 yrs
- —
Air-quality risk 10/10 · Severe
- Unhealthy air days now
- 25 days/yr
- Unhealthy air days in 30 yrs
- 27 days/yr
Risk factors via First Street. Map © Google.
Why this score? — see what drove the B- grade
The composite is a weighted blend of 9 inputs, each scored 0–100. Each bar is that input's sub-score; the figure is the points it added to the 100-point composite (weight × sub-score).
- Cash flow +25.0/30.0
- ARV discount +15.0/15.0
- DSCR +8.2/10.0
- 1% rule +5.6/10.0
- Appreciation +4.8/10.0
- Livability +2.8/5.0
- Schools +2.7/10.0
- Rent growth +2.5/5.0
- Condition / age +2.5/5.0
$125,000
🖨 Deal sheet 📄 Offer letter ✓ Due diligence
Listing remarks MLS
This a wonderful opportunity for an investor or for a family willing to put in some sweat equity! This charming property at 209 Second St. Bieber, CA - offers a unique ability to own a home in a peaceful, small-town setting. Nestled in the heart of Bieber, this residence combines rustic charm with comfortable living, perfect for those seeking tranquility and a close-knit community atmosphere. Located conveniently near local amenities, schools, and natural attractions, 209 Second St. is ideal for buyers looking for a serene lifestyle with easy access to essential services. Whether you're looking for a permanent residence or a weekend retreat, this property presents a fantastic opportunity in the scenic surroundings of Bieber, CA.
Key facts
- Scenic surroundings
- 0.32 acre lot
- Garage
Tags
Neighborhood map
What this means for you Summary
Snapshot
- This is a 3-bed/1.0-bath single-family listed at $125k.
Deal economics
- At list price, monthly cash flow is $273 ($3k/yr) — positive.
- The deal already cash-flows at list — no discount required.
- Meets the 1% rule at list price ($1k rent vs $125k).
- Recommended offer: $110k (12.0% below list) — sets the bar for market timing.
Location & tenants
- Location reads 56/100 on livability (#813 in CA) — a working-class tenant base; expect higher turnover. Strengths: health & safety A+, crime A; Watch: employment D+, schools F, amenities F.
- Big Valley Joint Unified (rural): math 20% / reading 35% proficiency, ranked #1,113 of 1,400 in CA (top 80%) — low school quality limits family demand, transient renter base, plan for 1-2y turnover.
- Market conditions: 11 active listings in the ZIP; 6 units permitted in Lassen County in 2024 (0 in 5+ unit buildings).
Forward outlook
- In year one you build about $479 of equity ($864 loan paydown + $-385 appreciation (-0.3% local appreciation)).
- Lassen County population projected at -14% by 2050 — secular population decline; favor cash flow + early exit over multi-decade hold.
- At projected returns (-0.3% appreciation + 3.0% rent growth), your $35k cash investment doubles in ~7 years — after that, you're playing with house money.
Negotiation context
- It's been on market 148 days — a 12% lower offer ($110k) is reasonable based on typical stale-listing flexibility.
- Current owner paid $45k; list at $125k implies a 178% gain — meaningful room to come down on a strong offer.
Risks & watch-outs
- Climate carrying-cost: major wildfire risk — expect insurance premiums to compound above CPI over the hold.
Questions for the listing agent
- It's been on market 148 days. Have you received any prior offers? Is the seller open to a 12% concession, seller financing, or rate buy-down credit?
- Built in 1971 — when were the roof, HVAC, electrical panel, plumbing, and water heater last replaced?
- Why hasn't it sold? Are there any deal-killer items the seller is aware of (foundation, flood, title, zoning, code violations)?
- Is there a deadline driving the sale (1031 exchange, divorce, estate, relocation)? That informs how much negotiation room exists.
- Schools are F-rated, which usually means shorter tenancies and higher turnover. Who's the typical renter profile here, and what's been the actual vacancy rate?
- What's the average days-on-market for RENTAL listings here right now (not sales)? A rising rental-DOM trend means longer vacancies and softer asking-rent achievability than the comps imply.
- What's the recent tenant-quality profile in this submarket — average credit score on applications, eviction rate, late-payment / NSF rate, and stable-employment percentage? A property-management company in the area should have these aggregated.
- How much new for-sale + rental construction is in the pipeline within 1–3 miles? Heavy new supply typically softens prices + rents 12–24 months out; constrained supply supports both.
Investment metrics
- 1% rule
- 1.06% ✓
- Cap rate
- 8.91%
- Cash-on-cash
- 9.35%
- DSCR
- 1.42
- GRM
- 7.9
CMA / ARV
- ARV (median comp)
- $162,319
- List price
- $125,000
- Delta
- -22.99%
- Verdict
- UNDERPRICED
- Comps
- 11 within 1.0 mi
Projected returns pro-forma
-0.31% appreciation · 3.0% rent growth · sell at horizon
- IRR
- 7.3%
- Equity multiple
- 1.34×
- Total profit
- $11,878
- Equity at exit
- $34,382
- IRR
- 12.7%
- Equity multiple
- 2.34×
- Total profit
- $46,958
- Equity at exit
- $39,831
Cash invested: $35,000 (down + closing). Projections, not guarantees.
Landlord ↔ Tenant lean methodology
- Overall (STATE)
- 18 Strongly Tenant-Friendly
- State California
- 18 Strongly Tenant-Friendly · D+13
- County
- — inherits STATE
- City
- — inherits STATE
ZIP-level market 96009
- Home prices YoY
- -0.2%
- Active inventory
- 11
- Price-to-rent
- 7.9×
Monthly cashflow live
- Estimated rent
- $1,324 medium interval (Pro) →
- Mortgage (P&I)
- −$656
- Tax from tax record
- −$66 /mo · $790/yr
- Insurance
- −$52
- HOA
- −$0
- Vacancy / Maint / Mgmt
- −$278
- Net cashflow
- $273
Break-even live
UW: 25.0% down · 7.5% · 30yr · 1.5% tax · 5.0% vac · 8.0% maint · 8.0% mgmt
Financing live
Cash to close
- Down payment
- $31,250
- Closing costs
- $3,750
- Reserves months
- —
- Total cash needed
- —
Loan-product check · same deal, 3 products live
Conventional
25% down · 7.5% · 30yr
- Down + closing
- —
- Monthly P&I
- —
- Monthly cashflow
- —
- DSCR
- —
- Eligible?
- —
Personal DTI + credit; lowest rate.
DSCR
20% down · 8.5% · 30yr
- Down + closing
- —
- Monthly P&I
- —
- Monthly cashflow
- —
- DSCR
- —
- Eligible?
- —
No personal income docs; deal must DSCR.
Hard money
10% down · 12.0% · 12mo
- Down + closing
- —
- Monthly P&I
- —
- Monthly cashflow
- —
- DSCR
- —
- Eligible?
- —
Short-term bridge; refi at stabilization.
Listing history 19 events
-
2026-06-19days on market $125,000 Active 148 DOM
-
2026-06-18days on market $125,000 Active 147 DOM
-
2026-06-17days on market $125,000 Active 146 DOM
-
2026-06-16days on market $125,000 Active 145 DOM
-
2026-06-15days on market $125,000 Active 144 DOM
-
2026-06-14days on market $125,000 Active 142 DOM
-
2026-06-12days on market $125,000 Active 141 DOM
-
2026-06-09days on market $125,000 Active 138 DOM
-
2026-06-08days on market $125,000 Active 137 DOM
-
2026-06-07days on market $125,000 Active 136 DOM
-
2026-06-07days on market $125,000 Active 135 DOM
-
2026-06-04days on market $125,000 Active 132 DOM
-
2026-06-02days on market $125,000 Active 131 DOM
-
2026-06-01days on market $125,000 Active 130 DOM
-
2026-05-31days on market $125,000 Active 129 DOM
-
2026-05-31days on market $125,000 Active 128 DOM
-
2026-02-04price $125,000 742-char remark
Show marketing remark (742 chars)
This a wonderful opportunity for an investor or for a family willing to put in some sweat equity! This charming property at 209 Second St. Bieber, CA - offers a unique ability to own a home in a peaceful, small-town setting. Nestled in the heart of Bieber, this residence combines rustic charm with comfortable living, perfect for those seeking tranquility and a close-knit community atmosphere. Located conveniently near local amenities, schools, and natural attractions, 209 Second St. is ideal for buyers looking for a serene lifestyle with easy access to essential services. Whether you're looking for a permanent residence or a weekend retreat, this property presents a fantastic opportunity in the scenic surroundings of Bieber, CA.
-
2026-01-22$155,000 Active 742-char remark
Show marketing remark (742 chars)
This a wonderful opportunity for an investor or for a family willing to put in some sweat equity! This charming property at 209 Second St. Bieber, CA - offers a unique ability to own a home in a peaceful, small-town setting. Nestled in the heart of Bieber, this residence combines rustic charm with comfortable living, perfect for those seeking tranquility and a close-knit community atmosphere. Located conveniently near local amenities, schools, and natural attractions, 209 Second St. is ideal for buyers looking for a serene lifestyle with easy access to essential services. Whether you're looking for a permanent residence or a weekend retreat, this property presents a fantastic opportunity in the scenic surroundings of Bieber, CA.
-
1992-06-01soldstatus $45,000
ⓘ Source: listings_history table (triggers on properties + properties_extension) + one-shot
backfill from property_details.listing_events for pre-trigger history.
Tax reassessment forecast CA · Resets to sale price
- Current annual tax
- $790 · $66/mo
- Projected year-2 tax
- $950 · $79/mo
- Expected delta
- +$160/yr (+$13/mo · 20.2%)
ⓘ Screening estimate from a state-policy table — verify with the county assessor before closing.
Climate risk First Street
- Flood 4/10 Moderate FEMA zone X (unshaded) · 17% chance over 30 yrs
- Wildfire 7/10 Severe
- Heat 4/10 Moderate 7 d/yr ≥91°F today · 17 d/yr by 30 yrs out
- Wind 1/10 Low
- Air quality 10/10 Extreme 25 unhealthy d/yr today · 27 by 30 yrs out
Nearby sold comps map
Loading sold comps map…
Walkable amenities ~0.75 mi
Loading nearby amenities…
Taxation est. · year 1
- Rental income
- $15,891
- − Mortgage interest
- −$7,002
- − Property taxes
- −$790
- − Insurance
- −$625
- − Repairs & maintenance
- −$1,271
- − Management
- −$1,271
- − Depreciation
- −$3,636
- Taxable income
- $1,295
- Est. tax owed @ 24.0%
- −$311
- After-tax cash flow
- $2,962/yr
For passive investors: Depreciation is non-cash, so a rental often shows a tax loss while cash-flowing — sheltering income. Rental losses are passive: they offset passive income freely, and up to $25,000/yr can offset ordinary (W-2) income if you actively participate and your MAGI is under $100k (phasing out to $0 by $150k); unused losses carry forward. On sale, claimed depreciation is recaptured at up to 25%, and gains may owe capital-gains tax (a 1031 exchange can defer both). Figures are a year-1 estimate at your 24.0% rate — not tax advice; consult a CPA.
Schools (NCES district)
- District
- Big Valley Joint Unified
- NCES district ID
- 0605010
- Math proficiency
- 20% ▲ 14.00%
- Reading proficiency
- 35% ▲ 15.00%
- Median HH income
- $45,860
- Composite
- 26.64/100
- National rank
- #12589
- State rank
- #1113 of 1400 in CA
Livability — Bieber
- Score
- 56/100
- State rank
- #813
- US rank
- #22934
Category grades
Schools grade is shown separately in the Schools card above.
Census & demographics
- Census place
- Bieber, CA
- Population (ZIP)
- 380
Population outlook (Lassen County) Hauer SSP2
- Today (2025)
- 27,112 people
- By 2030
- 26,732 · -1.4%
- By 2040
- 25,536 · -5.8%
- By 2050
- 23,262 · -14.2%
- By 2075
- 18,620 · -31.3%
- By 2100
- 14,679 · -45.9%
Race, ethnicity, and origin ACS 2023
- Neighborhood character
- Predominantly White (91%)
- Race & ethnicity
- White 91% Hispanic / Latino 5% Two or more races 3% Asian 3%
- Hispanic origin (detail)
- Mexican 3%
- Common ancestry
- Slovak 28% Italian 5% Russian 2%
- Foreign-born
- 12% · Canada, Vietnam
- Languages at home
- 90% English-only · Spanish 4% Vietnamese 4% German/W. Germanic 2%
Political lean MEDSL · Lassen
- 2024 margin
- Solid R (+54.0) · D 21.8% · R 75.8% · Other 2.4%
- 2008→2024 swing
- -19.8pp toward R · 2008: -34.2pp · 2024: -54.0pp
- All cycles
- 2024: R+54.0 2020: R+51.5 2016: R+51.3 2012: R+39.8 2008: R+34.2
Not yet ingested
- Civics
- —
Market trends
- HPI YoY
- ▼ -0.31%
- Current HPI
- 150.8107
- Rent YoY
- —
- Metro
- —
- State GDP YoY
- ▲ 3.21%
- F500 in state
- 116
Industry mix (Fortune 500 HQ in CA)
| Industry | F500 HQs | Revenue |
|---|---|---|
| Technology | 27 | $1,492B |
|
||
| Financial Services | 3 | $174B |
|
||
| Retail | 3 | $44B |
|
||
| Insurance | 3 | $26B |
|
||
| Media / Entertainment | 2 | $115B |
|
||
| Pharmaceuticals / Biotech | 2 | $62B |
|
||
Price history
+177.8% since first listed3 events — show timeline
- 2026-02-04 Price Changed $125,000 SAOR
- 2026-01-22 Listed $155,000 SAOR
- 1992-06-01 Sold (Public Records) $45,000 Public Records
Property tax history
+2.9%/yrLatest (2025): $790 · +2.0% YoY. Source: county tax records.
Cash-flow waterfall
monthlySold comps — $/sqft
last 12 mo · ≤1 miLoading sold comps…