 Triplex
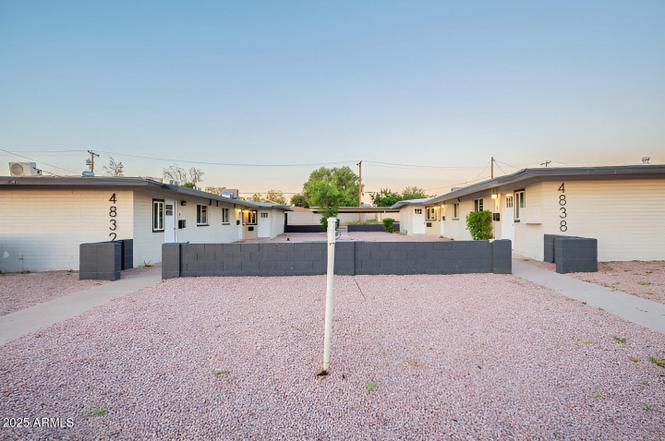
4838 E Willetta St · Phoenix, AZ
Flood risk 1/10 · Minimal
- FEMA flood zone
- X (shaded)
- Chance of flooding over 30 yrs
- 0.0%
- Est. flood insurance / yr
- $507 – $1,088
Fire risk 4/10 · Minor
- Est. fire insurance / yr
- $610 – $1,132
Heat risk 9/10 · Severe
- Hot days now (above 112°F)
- 7 days/yr
- Hot days in 30 yrs
- 19 days/yr
Wind risk 1/10 · Minimal
- Chance of severe wind over 30 yrs
- —
Air-quality risk 2/10 · Minimal
- Unhealthy air days now
- 1 days/yr
- Unhealthy air days in 30 yrs
- 1 days/yr
Risk factors via First Street. Map © Google.
Why this score? — see what drove the F grade
The composite is a weighted blend of 9 inputs, each scored 0–100. Each bar is that input's sub-score; the figure is the points it added to the 100-point composite (weight × sub-score).
- ARV discount +7.5/15.0
- Cash flow +6.0/30.0
- Livability +3.8/5.0
- Condition / age +2.5/5.0
- Rent growth +1.9/5.0
- 1% rule +1.3/10.0
- Schools +1.1/10.0
- DSCR +0.4/10.0
- Appreciation +0.0/10.0
$579,900
🖨 Deal sheet (PDF) 📄 Offer letter ✓ Due diligence
Multi-family units
County records classify this as Multi-Family (2-4 Unit). Listing-text estimate: 3 units. confirmed
Listing remarks
Discover a fully updated triplex in a prime Phoenix location—an exceptional investment opportunity you won't want to miss. This well-maintained building features two renovated 1-bed/1-bath units and one spacious and updated 2-bed/1-bath unit, offering strong rental versatility and appeal. Each unit has been thoughtfully refreshed with modern finishes, creating comfortable, move-in-ready living spaces. The property includes covered parking, low-maintenance landscaping, and easy access to some of the area's best amenities. Just minutes from Papago Park, the Phoenix Zoo, and SR-143, residents enjoy quick commutes, outdoor recreation, and countless attractions at their doorstep.
Key facts
- Quick commutes
- Renovated units
- Covered parking
Tags
Property features AI
Exterior
- Parking: 3 total parking spaces; 3 covered parking spaces; Carport
- Utilities: SRP electric service; Public sewer; Individual water meter
- Home design: Fee simple ownership; 1 building on the property
- Construction: Block construction; Painted exterior; Composition roof
- Exterior features: Painted block construction; Composition roof; Asphalt road access; No pool
Interior
- Bedrooms: 1 bedroom (unfurnished unit)
- Flooring: Vinyl floors
- Heating & cooling: Electric heating; Ceiling fan(s); Window/wall unit cooling
- Interior features: Ceiling fan(s); Window/wall cooling units; Electric heating; Vinyl flooring; Other appliances included
Neighborhood map
What this means for you Summary
Snapshot
- This is a 2×1bd/1.0ba + 1×2bd/1.0ba units multifamily listed at $580k.
Deal economics
- At list price, monthly cash flow is $-1k ($-13k/yr) — negative. Per door: $-369/mo.
- To cash-flow at today's rent, offer at most $420k (27.6% below list).
- To meet the 1% rule (rent ≥ 1% of price), the offer needs to be $367k (36.7% below list).
- Recommended offer: $367k (36.7% below list) — sets the bar for 1% rule.
- Cap rate 4.0% vs local median 3.3% in Phoenix — meaningfully above typical; check what's discounted (condition, days-on-market, listing class) to confirm the premium yield is real.
Location & tenants
- Location reads 75/100 on livability (#16 in AZ, #3,924 nationally) — a middle-class / working-renter tenant base. Strengths: amenities A+, commute A+, housing A+; Watch: health & safety C-, crime F.
- Phoenix Union High School District (4286) (urban): math 10% / reading 15% proficiency, ranked #224 of 249 in AZ (top 90%) — low school quality limits family demand, transient renter base, plan for 1-2y turnover.
- Zoned schools: Brunson-Lee Elementary School (math 7% / reading 16%, grade F, #971 of 1,109 statewide, top 88%, 443 students, 92% FRL); Pat Tillman Middle School (math 5% / reading 15%, grade F, #188 of 218 statewide, top 88%, 652 students, 100% FRL); Camelback High School (math 6% / reading 7%, grade F, #363 of 381 statewide, top 95%, 2,238 students, 86% FRL).
- Market conditions: Rents soft (-2.4%/yr); 176 active listings in the ZIP; 36,011 units permitted in Maricopa County in 2024 (12,801 in 5+ unit buildings).
- At $3,671/mo this rent would consume 66% of the median local household income ($66k/yr) (locally 2661% of renters already pay >50% of income on rent) — very limited rent-growth headroom before tenants either downsize or default.
Forward outlook
- Local home prices are declining (-3.0%/yr); year-one equity from $4k of loan paydown is wiped out by about $17k of value loss. Plan a longer hold.
- Maricopa County population projected at +38% by 2050 — long-run rental-demand tailwind backs the buy-and-hold thesis.
Negotiation context
- It's been on market 192 days — a 12% lower offer ($510k) is reasonable based on typical stale-listing flexibility.
- 9 sale attempts since 21y ago; this cycle's ask has dropped $70k (11%) from the opening price — seller is motivated, your offer sets the floor, not the list.
Risks & watch-outs
- Climate carrying-cost: extreme-heat days projected 7→19/yr by 2055 (HVAC capex compounding) — expect insurance premiums to compound above CPI over the hold.
Questions for the listing agent
- What do current leases actually rent for vs. the listed asking? Can we see a recent rent roll and the last 12 months of T-12 income?
- It's been on market 192 days. Have you received any prior offers? Is the seller open to a 37% concession, seller financing, or rate buy-down credit?
- Can we see the unit-by-unit rent roll, current vacancy, and any below-market leases? What's the average tenancy length?
- What capital expenditures (roof, boiler, parking lot, exteriors) have been made in the last 5 years, and what's planned in the next 2?
- Built in 1960 — when were the roof, HVAC, electrical panel, plumbing, and water heater last replaced?
- Why hasn't it sold? Are there any deal-killer items the seller is aware of (foundation, flood, title, zoning, code violations)?
- Is there a deadline driving the sale (1031 exchange, divorce, estate, relocation)? That informs how much negotiation room exists.
- Crime grade is F in this area — have there been break-ins, vandalism, or insurance claims at this property in the last 3 years? What carrier currently insures it and at what premium?
- The area grade is low — what's the realistic commute time and amenity access for the typical tenant pool here? Any planned neighborhood developments (good or bad) we should know about?
- What's the average days-on-market for RENTAL listings here right now (not sales)? A rising rental-DOM trend means longer vacancies and softer asking-rent achievability than the comps imply.
- What's the recent tenant-quality profile in this submarket — average credit score on applications, eviction rate, late-payment / NSF rate, and stable-employment percentage? A property-management company in the area should have these aggregated.
- How much new apartment / multifamily construction is in the pipeline within 1–3 miles? Heavy new supply (>2% of stock underway) typically softens rents 12–24 months out; light construction supports rent growth.
Investment metrics
- 1% rule
- 0.63% ✗
- Cap rate
- 4.00%
- Cash-on-cash
- -8.18%
- DSCR
- 0.64
- GRM
- 13.2
CMA / ARV
No comps found within radius.
Projected returns pro-forma
-3.0% appreciation · 0.0% rent growth · sell at horizon
- IRR
- -34.0%
- Equity multiple
- -0.08×
- Total profit
- $-175,207
- Equity at exit
- $86,465
- IRR
- -65.3%
- Equity multiple
- -0.75×
- Total profit
- $-284,744
- Equity at exit
- $50,139
Cash invested: $162,372 (down + closing). Projections, not guarantees.
Landlord ↔ Tenant lean methodology
- Overall (STATE)
- 87 Strongly Landlord-Friendly
- State Arizona
- 87 Strongly Landlord-Friendly · R+3
- County
- — inherits STATE
- City
- — inherits STATE
ZIP-level market 85008
- Rents YoY
- -2.4%
- Active inventory
- 176
- Price-to-rent
- 41.1×
Monthly cashflow live
- Estimated rent
- $3,671 high interval (Pro) →
- Mortgage (P&I)
- −$3,041
- Tax est. 1.5%
- −$725 /mo · $8,698/yr
- Insurance
- −$242
- HOA
- −$0
- Vacancy / Maint / Mgmt
- −$771
- Net cashflow
- $-1,107
Break-even live
Sensitivity live
| Price | -10% $-707 | -5% $-907 | +0% $-1,107 | +5% $-1,308 | +10% $-1,508 |
|---|---|---|---|---|---|
| Rent | -10% $-1,397 | -5% $-1,252 | +0% $-1,107 | +5% $-962 | +10% $-817 |
| Rate | -1.0pp $-815 | -0.5pp $-960 | base $-1,107 | +0.5pp $-1,258 | +1.0pp $-1,411 |
3-unit breakdown (identical units grouped — click to expand)
| Units | Beds | Baths | Est. rent |
|---|---|---|---|
| 2× units | 1 | 1 | $2,354 |
| #1 | 1 | 1 | $1,177 |
| #2 | 1 | 1 | $1,177 |
| 1× unit | 2 | 1 | $1,318 |
| Total (3 units) | $3,671 | ||
UW: 25.0% down · 7.5% · 30yr · 1.5% tax · 5.0% vac · 8.0% maint · 8.0% mgmt
Financing live
Cash to close
- Down payment
- $144,975
- Closing costs
- $17,397
- Reserves months
- —
- Total cash needed
- —
Loan-product check · same deal, 3 products live
Conventional
25% down · 7.5% · 30yr
- Down + closing
- —
- Monthly P&I
- —
- Monthly cashflow
- —
- DSCR
- —
- Eligible?
- —
Personal DTI + credit; lowest rate.
DSCR
20% down · 8.5% · 30yr
- Down + closing
- —
- Monthly P&I
- —
- Monthly cashflow
- —
- DSCR
- —
- Eligible?
- —
No personal income docs; deal must DSCR.
Hard money
10% down · 12.0% · 12mo
- Down + closing
- —
- Monthly P&I
- —
- Monthly cashflow
- —
- DSCR
- —
- Eligible?
- —
Short-term bridge; refi at stabilization.
Listing history 50 events
-
2026-06-21days on market $579,900 Active 192 DOM
-
2026-06-18days on market $579,900 Active 189 DOM
-
2026-06-17days on market $579,900 Active 188 DOM
-
2026-06-16days on market $579,900 Active 187 DOM
-
2026-06-15days on market $579,900 Active 186 DOM
-
2026-06-13days on market $579,900 Active 184 DOM
-
2026-06-09days on market $579,900 Active 180 DOM
-
2026-06-08days on market $579,900 Active 179 DOM
-
2026-06-07days on market $579,900 Active 178 DOM
-
2026-06-04days on market $579,900 Active 175 DOM
-
2026-06-03days on market $579,900 Active 174 DOM
-
2026-06-02days on market $579,900 Active 173 DOM
-
2026-06-01days on market $579,900 Active 172 DOM
-
2026-05-31days on market $579,900 Active 171 DOM
-
2026-05-21price $579,900
-
2026-04-21price $599,900
-
2026-03-19price $614,900
-
2026-02-19price $629,900
-
2025-12-09$649,900 Active
-
2025-03-28historical
-
2025-03-13price $800,000
-
2025-02-23price $585,000
-
2025-02-14$625,000 Active
-
2025-02-04historical
-
2025-01-28status Active
-
2025-01-28price $625,000
-
2025-01-21status Pending
-
2025-01-09$650,000 Active
-
2024-09-19historical
-
2024-06-28price $749,900
-
2024-05-10price $799,000
-
2024-05-08price $809,900
-
2024-04-22price $815,000
-
2024-04-10price $823,975
-
2024-03-22price $829,000
-
2024-03-11price $839,000
-
2024-02-27price $844,900
-
2024-02-22$849,900 Active
-
2024-02-05historical
-
2023-12-12price $849,000
-
2023-11-19$897,500 Active
-
2023-11-19price $897,500
-
2023-08-29soldstatus $650,000
-
2015-07-29soldstatus $262,000
-
2007-03-06historical
-
2006-08-31historical
-
2006-08-21$219,000
-
2006-06-21$215,000
-
2005-08-24historical
-
2005-05-13$198,000
ⓘ Source: listings_history table (triggers on properties + properties_extension) + one-shot
backfill from property_details.listing_events for pre-trigger history.
Climate risk First Street
- Flood 1/10 Low FEMA zone X (shaded) · 0% chance over 30 yrs
- Wildfire 4/10 Moderate
- Heat 9/10 Extreme 7 d/yr ≥112°F today · 19 d/yr by 30 yrs out
- Wind 1/10 Low
- Air quality 2/10 Low 1 unhealthy d/yr today · 1 by 30 yrs out
Nearby sold comps map
Loading sold comps map…
Walkable amenities ~0.75 mi
Loading nearby amenities…
Taxation est. · year 1
- Rental income
- $44,052
- − Mortgage interest
- −$32,483
- − Property taxes
- −$8,698
- − Insurance
- −$2,900
- − Repairs & maintenance
- −$3,524
- − Management
- −$3,524
- − Depreciation
- −$16,870
- Taxable loss
- −$23,948
- Est. tax savings @ 24.0%
- +$5,747
- After-tax cash flow
- $-7,542/yr
For passive investors: Depreciation is non-cash, so a rental often shows a tax loss while cash-flowing — sheltering income. Rental losses are passive: they offset passive income freely, and up to $25,000/yr can offset ordinary (W-2) income if you actively participate and your MAGI is under $100k (phasing out to $0 by $150k); unused losses carry forward. On sale, claimed depreciation is recaptured at up to 25%, and gains may owe capital-gains tax (a 1031 exchange can defer both). Figures are a year-1 estimate at your 24.0% rate — not tax advice; consult a CPA.
Schools (NCES district)
- District
- Phoenix Union High School District (4286)
- NCES district ID
- 0406330
- Math proficiency
- 10% ▼ -27.00%
- Reading proficiency
- 15% ▼ -18.00%
- Median HH income
- $39,055
- Composite
- 10.63/100
- National rank
- #9773
- State rank
- #224 of 249 in AZ
Livability — Phoenix
- Score
- 75/100
- State rank
- #16
- US rank
- #3924
Category grades
Schools grade is shown separately in the Schools card above.
Census & demographics
- Census place
- Phoenix, AZ
- County
- Maricopa County · 4,537,380 people
- City population
- 1,500,198
- Metro
- Phoenix-Mesa-Chandler, AZ
- Population (ZIP)
- 59,716
- Household income
- $66,353
- Rent vs Own
- Severe rent burden
- 2661.0
Population outlook (Maricopa County) Hauer SSP2
- Today (2025)
- 4,979,203 people
- By 2030
- 5,378,229 · +8.0%
- By 2040
- 6,156,598 · +23.6%
- By 2050
- 6,872,376 · +38.0%
- By 2075
- 8,401,270 · +68.7%
- By 2100
- 9,247,439 · +85.7%
Race, ethnicity, and origin ACS 2023
- Neighborhood character
- Diverse neighborhood (Simpson 0.60)
- Race & ethnicity
- Hispanic / Latino 57% Two or more races 36% White 26% Black 10% Native American 2% Asian 1%
- Hispanic origin (detail)
- Mexican 52%
- Common ancestry
- Romanian 2% Lithuanian 1% Slovak 1%
- Foreign-born
- 26% · Canada, Jamaica
- Languages at home
- 47% English-only · Spanish 46% Other Asian/Pacific 1% French/Haitian/Cajun 1%
Political lean MEDSL · Maricopa
- 2024 margin
- Toss-up / Even · D 47.7% · R 51.2% · Other 1.1%
- 2008→2024 swing
- +7.1pp toward D · 2008: -10.6pp · 2024: -3.5pp
- All cycles
- 2024: R+3.5 2020: D+2.2 2016: R+3.5 2012: R+12.0 2008: R+10.6
Not yet ingested
- Civics
- —
Market trends
- HPI YoY
- ▼ -278.09%
- Current HPI
- 485.9412
- Rent YoY
- ▼ -2.37%
- Metro
- Phoenix-Mesa-Chandler, AZ
- State GDP YoY
- ▲ 4.54%
- F500 in state
- 20
Industry mix (Fortune 500 HQ in AZ)
| Industry | F500 HQs | Revenue |
|---|---|---|
| Technology | 2 | $13B |
|
||
| Mining / Metals | 1 | $23B |
|
||
| Environmental Services | 1 | $16B |
|
||
| Metals / Steel | 1 | $14B |
|
||
| Technology Distribution | 1 | $9B |
|
||
| Homebuilding | 1 | $8B |
|
||
Price history
+200.5% since first listed39 events — show timeline
- 2026-05-21 Price Changed $579,900 ARMLS
- 2026-04-21 Price Changed $599,900 ARMLS
- 2026-03-19 Price Changed $614,900 ARMLS
- 2026-02-19 Price Changed $629,900 ARMLS
- 2025-12-09 Listed $649,900 ARMLS
- 2025-03-28 Listing Removed — ARMLS
- 2025-03-13 Price Changed $800,000 ARMLS
- 2025-02-23 Price Changed $585,000 ARMLS
- 2025-02-14 Listed $625,000 ARMLS
- 2025-02-04 Listing Removed — ARMLS
- 2025-01-28 Relisted — ARMLS
- 2025-01-28 Price Changed $625,000 ARMLS
- 2025-01-21 Pending — ARMLS
- 2025-01-09 Listed $650,000 ARMLS
- 2024-09-19 Listing Removed — ARMLS
- 2024-06-28 Price Changed $749,900 ARMLS
- 2024-05-10 Price Changed $799,000 ARMLS
- 2024-05-08 Price Changed $809,900 ARMLS
- 2024-04-22 Price Changed $815,000 ARMLS
- 2024-04-10 Price Changed $823,975 ARMLS
- 2024-03-22 Price Changed $829,000 ARMLS
- 2024-03-11 Price Changed $839,000 ARMLS
- 2024-02-27 Price Changed $844,900 ARMLS
- 2024-02-22 Listed $849,900 ARMLS
- 2024-02-05 Listing Removed — ARMLS
- 2023-12-12 Price Changed $849,000 ARMLS
- 2023-11-19 Listed $897,500 ARMLS
- 2023-11-19 Price Changed $897,500 ARMLS
- 2023-08-29 Sold (Public Records) $650,000 Public Records
- 2015-07-29 Sold (Public Records) $262,000 Public Records
- 2007-03-06 Listing Removed — ARMLS
- 2006-08-31 Listing Removed — ARMLS
- 2006-08-21 Listed $219,000 ARMLS
- 2006-06-21 Listed $215,000 ARMLS
- 2005-08-24 Listing Removed — ARMLS
- 2005-05-13 Listed $198,000 ARMLS
- 2000-09-08 Sold (Public Records) $90,000 Public Records
- 1991-07-31 Sold (Public Records) $38,000 Public Records
- 1988-04-22 Sold (Public Records) $193,000 Public Records
Property tax history
-3.2%/yrLatest (2025): $902 · +6.3% YoY. Source: county tax records.
Cash-flow waterfall
monthlySold comps — $/sqft
last 12 mo · ≤1 miLoading sold comps…