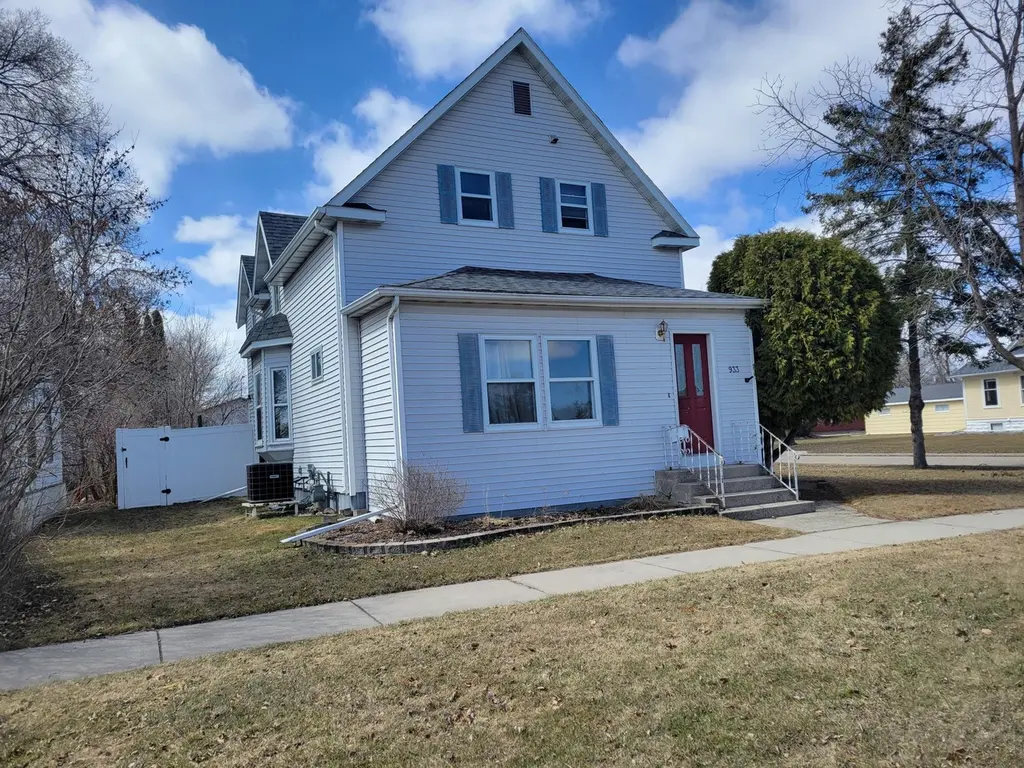
933 Labree Ave N · Thief River Falls, MN
Flood risk 1/10 · Minimal
- FEMA flood zone
- X (unshaded)
- Chance of flooding over 30 yrs
- 0.0%
- Est. flood insurance / yr
- $473 – $860
Fire risk 1/10 · Minimal
- Est. fire insurance / yr
- $888 – $1,650
Heat risk 1/10 · Minimal
- Hot days now (above 94°F)
- 7 days/yr
- Hot days in 30 yrs
- 12 days/yr
Wind risk 1/10 · Minimal
- Chance of severe wind over 30 yrs
- —
Air-quality risk 3/10 · Minor
- Unhealthy air days now
- 2 days/yr
- Unhealthy air days in 30 yrs
- 2 days/yr
Risk factors via First Street. Map © Google.
Why this score? — see what drove the D+ grade
The composite is a weighted blend of 9 inputs, each scored 0–100. Each bar is that input's sub-score; the figure is the points it added to the 100-point composite (weight × sub-score).
- ARV discount +15.0/15.0
- Cash flow +11.8/30.0
- Schools +3.7/10.0
- Livability +3.7/5.0
- 1% rule +3.5/10.0
- DSCR +3.5/10.0
- Rent growth +2.5/5.0
- Condition / age +2.5/5.0
- Appreciation +0.0/10.0
$162,500
🖨 Deal sheet (PDF) 📄 Offer letter ✓ Due diligence
Listing remarks
Welcome to this Spacious 4 Bed 2 Bath Home on a Corner lot with Nice size fenced in back yard. This Home offers so much Character. Lots of storage space. Newer Main floor Bathroom. Fresh Paint and Newer Flooring throughout. Recess Lighting in Kitchen. Nice Size Main Floor Laundry area.
Key facts
- Recess lighting
- Storage space
- Fenced in back yard
Tags
Property features AI
Exterior
- Parking: Attached 2-car garage with concrete driveway
- Utilities: City water connected; City sewer connected; Natural gas; Electric with circuit breakers
- Home design: Residential property; One-and-a-half story; Block foundation; Shingle roof (age over 8 years)
- Construction: Concrete construction components; Foundation area noted (block foundation)
- Exterior features: Vinyl siding; Full yard fencing; Porch; Storage shed; Corner lot (approx. 57 x 140)
Interior
- Kitchen: Dishwasher; Range; Refrigerator; Stainless steel appliances
- Bedrooms: 4 bedrooms (including a main-level bedroom)
- Bathrooms: 2 full bathrooms (one on the main floor and one on the upper level)
- Heating & cooling: Forced air heating; Central air conditioning
- Interior features: Open living/dining area; Four-season porch; Washer/dryer hookup; Concrete basement
- Laundry & utility: Main-level laundry
Neighborhood map
What this means for you Summary
Snapshot
- This is a 4-bed/2.0-bath single-family listed at $162k.
Deal economics
- At list price, monthly cash flow is $-44 ($-526/yr) — negative.
- To cash-flow at today's rent, offer at most $155k (4.8% below list).
- To meet the 1% rule (rent ≥ 1% of price), the offer needs to be $138k (15.4% below list).
- Recommended offer: $138k (15.4% below list) — sets the bar for 1% rule.
Location & tenants
- Location reads 74/100 on livability (#219 in MN, #4,606 nationally) — a middle-class / working-renter tenant base. Strengths: cost of living A+, housing A+, crime A; Watch: health & safety D+, amenities F, commute F.
- Thief River Falls School District (town): math 39% / reading 47% proficiency, ranked #201 of 301 in MN (top 67%) — families likely to look elsewhere, expect single-tenant / working-renter base with shorter leases.
- Zoned schools: Challenger Elementary (math 46% / reading 48%, grade D-, #492 of 857 statewide, top 61%, 783 students, 41% FRL); Franklin Middle (math 34% / reading 45%, grade F, #150 of 258 statewide, top 59%, 421 students, 37% FRL).
- Market conditions: 104 active listings in the ZIP; 1 comparable units currently listed for rent nearby; 11 units permitted in Pennington County in 2024 (0 in 5+ unit buildings).
Forward outlook
- Local home prices are declining (-3.0%/yr); year-one equity from $1k of loan paydown is wiped out by about $5k of value loss. Plan a longer hold.
- Pennington County population projected at +5% by 2050 — modest demand growth; plan on rents tracking national, not racing it.
Negotiation context
- It's been on market 62 days — a 6% lower offer ($153k) is reasonable based on typical stale-listing flexibility.
Risks & watch-outs
- Watch-outs: built in 1912 — expect roof / HVAC / electrical / plumbing capex.
Questions for the listing agent
- What do current leases actually rent for vs. the listed asking? Can we see a recent rent roll and the last 12 months of T-12 income?
- It's been on market 62 days. Have you received any prior offers? Is the seller open to a 15% concession, seller financing, or rate buy-down credit?
- Built in 1912 — when were the roof, HVAC, electrical panel, plumbing, and water heater last replaced?
- Why hasn't it sold? Are there any deal-killer items the seller is aware of (foundation, flood, title, zoning, code violations)?
- Is there a deadline driving the sale (1031 exchange, divorce, estate, relocation)? That informs how much negotiation room exists.
- Schools are B-rated — typically a magnet for longer-tenancy family renters. What's the average tenant stay here, and is there a school-zone premium baked into asking?
- The area grade is low — what's the realistic commute time and amenity access for the typical tenant pool here? Any planned neighborhood developments (good or bad) we should know about?
- What's the average days-on-market for RENTAL listings here right now (not sales)? A rising rental-DOM trend means longer vacancies and softer asking-rent achievability than the comps imply.
- What's the recent tenant-quality profile in this submarket — average credit score on applications, eviction rate, late-payment / NSF rate, and stable-employment percentage? A property-management company in the area should have these aggregated.
- How much new for-sale + rental construction is in the pipeline within 1–3 miles? Heavy new supply typically softens prices + rents 12–24 months out; constrained supply supports both.
Investment metrics
- 1% rule
- 0.85% ✗
- Cap rate
- 5.97%
- Cash-on-cash
- -1.15%
- DSCR
- 0.95
- GRM
- 9.8
CMA / ARV
- ARV (median comp)
- $232,173
- List price
- $162,500
- Delta
- -30.01%
- Verdict
- UNDERPRICED
- Comps
- 2 within 2.0 mi
Show comp detail 1 sale within ~0.75 mi
| Address | Dist | Beds/Ba | Sqft | Sold | Price | $/sf | Match |
|---|---|---|---|---|---|---|---|
| 601 State Ave N | 0.46mi | 3/2.0 (-1) | 1,601 (+8%) | 21mo | $47,600 | $30 | 42 |
Match score weights: distance 35% · size 25% · config 20% · recency 20%. Top-matched comps best support the ARV.
Projected returns pro-forma
-3.0% appreciation · 3.0% rent growth · sell at horizon
- IRR
- -18.2%
- Equity multiple
- 0.36×
- Total profit
- $-29,096
- Equity at exit
- $24,229
- IRR
- -10.4%
- Equity multiple
- 0.37×
- Total profit
- $-28,826
- Equity at exit
- $14,050
Cash invested: $45,500 (down + closing). Projections, not guarantees.
Landlord ↔ Tenant lean methodology
- Overall (STATE)
- 46 Balanced
- State Minnesota
- 46 Balanced · D+2
- County
- — inherits STATE
- City
- — inherits STATE
ZIP-level market 56701
- Active inventory
- 104
- Price-to-rent
- 9.8×
Monthly cashflow live
- Estimated rent
- $1,375 medium interval (Pro) →
- Mortgage (P&I)
- −$852
- Tax from tax record
- −$210 /mo · $2,522/yr
- Insurance
- −$68
- HOA
- −$0
- Vacancy / Maint / Mgmt
- −$289
- Net cashflow
- $-44
Break-even live
Sensitivity live
| Price | -10% $48 | -5% $2 | +0% $-44 | +5% $-90 | +10% $-136 |
|---|---|---|---|---|---|
| Rent | -10% $-152 | -5% $-98 | +0% $-44 | +5% $11 | +10% $65 |
| Rate | -1.0pp $38 | -0.5pp $-2 | base $-44 | +0.5pp $-86 | +1.0pp $-129 |
UW: 25.0% down · 7.5% · 30yr · 1.5% tax · 5.0% vac · 8.0% maint · 8.0% mgmt
Financing live
Cash to close
- Down payment
- $40,625
- Closing costs
- $4,875
- Reserves months
- —
- Total cash needed
- —
Loan-product check · same deal, 3 products live
Conventional
25% down · 7.5% · 30yr
- Down + closing
- —
- Monthly P&I
- —
- Monthly cashflow
- —
- DSCR
- —
- Eligible?
- —
Personal DTI + credit; lowest rate.
DSCR
20% down · 8.5% · 30yr
- Down + closing
- —
- Monthly P&I
- —
- Monthly cashflow
- —
- DSCR
- —
- Eligible?
- —
No personal income docs; deal must DSCR.
Hard money
10% down · 12.0% · 12mo
- Down + closing
- —
- Monthly P&I
- —
- Monthly cashflow
- —
- DSCR
- —
- Eligible?
- —
Short-term bridge; refi at stabilization.
Rent comps 1 comps
| Address | Beds | Baths | Sqft | Rent | $/sqft | DOM | Units | Dist |
|---|---|---|---|---|---|---|---|---|
| 231 Tindolph Ave N Thief River Falls, MN | 3.0 | 2.0 | 1000 | $1,375 | $1.38 | 45d | 1 | 0.75mi |
Listing history 22 events
-
2026-06-21days on market $162,500 Active 62 DOM
-
2026-06-21days on market $162,500 Active 61 DOM
-
2026-06-18days on market $162,500 Active 59 DOM
-
2026-06-17days on market $162,500 Active 58 DOM
-
2026-06-16days on market $162,500 Active 57 DOM
-
2026-06-15days on market $162,500 Active 56 DOM
-
2026-06-13days on market $162,500 Active 54 DOM
-
2026-06-12days on market $162,500 Active 53 DOM
-
2026-06-09days on market $162,500 Active 50 DOM
-
2026-06-08days on market $162,500 Active 49 DOM
-
2026-06-07pricedays on market $162,500 Active 48 DOM
-
2026-06-07days on market $172,900 Active 47 DOM
-
2026-06-04remarks 287-char remark
-
2026-06-04days on market $172,900 Active 44 DOM
-
2026-06-02days on market $172,900 Active 43 DOM
-
2026-06-01days on market $172,900 Active 42 DOM
-
2026-05-31days on market $172,900 Active 41 DOM
-
2026-05-31days on market $172,900 Active 40 DOM
-
2026-04-20$182,500 Active 251-char remark
-
2020-07-07soldstatus $160,000
-
2014-06-02soldstatus $147,200
-
2012-07-13soldstatus $121,000
ⓘ Source: listings_history table (triggers on properties + properties_extension) + one-shot
backfill from property_details.listing_events for pre-trigger history.
Tax reassessment forecast MN · Partial reset (capped growth)
- Current annual tax
- $2,522 · $210/mo
- Projected year-2 tax
- $2,522 · $210/mo
- Expected delta
- $0/yr ($0/mo · 0.0%)
ⓘ Screening estimate from a state-policy table — verify with the county assessor before closing.
Climate risk First Street
- Flood 1/10 Low FEMA zone X (unshaded) · 0% chance over 30 yrs
- Wildfire 1/10 Low
- Heat 1/10 Low 7 d/yr ≥94°F today · 12 d/yr by 30 yrs out
- Wind 1/10 Low
- Air quality 3/10 Moderate 2 unhealthy d/yr today · 2 by 30 yrs out
Nearby sold comps map
Loading sold comps map…
Walkable amenities ~0.75 mi
Loading nearby amenities…
Taxation est. · year 1
- Rental income
- $16,500
- − Mortgage interest
- −$9,103
- − Property taxes
- −$2,522
- − Insurance
- −$812
- − Repairs & maintenance
- −$1,320
- − Management
- −$1,320
- − Depreciation
- −$4,727
- Taxable loss
- −$3,304
- Est. tax savings @ 24.0%
- +$793
- After-tax cash flow
- $268/yr
For passive investors: Depreciation is non-cash, so a rental often shows a tax loss while cash-flowing — sheltering income. Rental losses are passive: they offset passive income freely, and up to $25,000/yr can offset ordinary (W-2) income if you actively participate and your MAGI is under $100k (phasing out to $0 by $150k); unused losses carry forward. On sale, claimed depreciation is recaptured at up to 25%, and gains may owe capital-gains tax (a 1031 exchange can defer both). Figures are a year-1 estimate at your 24.0% rate — not tax advice; consult a CPA.
Schools (NCES district)
- District
- Thief River Falls School District
- NCES district ID
- 2738850
- Math proficiency
- 39% ▼ -19.00%
- Reading proficiency
- 47% ▼ -13.00%
- Median HH income
- $49,239
- Composite
- 36.88/100
- National rank
- #4547
- State rank
- #201 of 301 in MN
Livability — Thief River Falls
- Score
- 74/100
- State rank
- #219
- US rank
- #4606
Category grades
Schools grade is shown separately in the Schools card above.
Census & demographics
- Census place
- Thief River Falls, MN
- City population
- 12,814
- Population (ZIP)
- 12,814
Population outlook (Pennington County) Hauer SSP2
- Today (2025)
- 14,800 people
- By 2030
- 15,030 · +1.6%
- By 2040
- 15,402 · +4.1%
- By 2050
- 15,601 · +5.4%
- By 2075
- 15,659 · +5.8%
- By 2100
- 14,231 · -3.8%
Race, ethnicity, and origin ACS 2023
- Neighborhood character
- Predominantly White (88%)
- Race & ethnicity
- White 88% Hispanic / Latino 5% Two or more races 4% Black 1% Asian 1%
- Hispanic origin (detail)
- Mexican 4%
- Common ancestry
- Portuguese 34% Romanian 4% Lithuanian 4%
- Foreign-born
- 3% · Canada
- Languages at home
- 94% English-only · Spanish 3% French/Haitian/Cajun 1% Russian/Polish/Slavic 1%
Political lean MEDSL · Pennington
- 2024 margin
- Solid R (+31.5) · D 33.1% · R 64.6% · Other 2.3%
- 2008→2024 swing
- -33.6pp toward R · 2008: 2.1pp · 2024: -31.5pp
- All cycles
- 2024: R+31.5 2020: R+27.0 2016: R+27.8 2012: R+4.3 2008: D+2.1
Not yet ingested
- Civics
- —
Market trends
- HPI YoY
- ▼ -123.53%
- Current HPI
- 136.4729
- Rent YoY
- —
- Metro
- —
- State GDP YoY
- ▲ 2.41%
- F500 in state
- 34
Industry mix (Fortune 500 HQ in MN)
| Industry | F500 HQs | Revenue |
|---|---|---|
| Healthcare | 2 | $407B |
|
||
| Retail | 2 | $150B |
|
||
| Consumer Goods | 2 | $32B |
|
||
| Industrial Machinery | 2 | $6B |
|
||
| Agriculture | 1 | $40B |
|
||
| Healthcare / Medical Devices | 1 | $32B |
|
||
Price history
+34.3% since first listed6 events — show timeline
- 2026-06-07 Price Changed $162,500 NORTHSTARMLS as Distributed by MLS Grid
- 2026-05-20 Price Changed $172,900 NORTHSTARMLS as Distributed by MLS Grid
- 2026-04-20 Listed $182,500 NORTHSTARMLS as Distributed by MLS Grid
- 2020-07-07 Sold (Public Records) $160,000 Public Records
- 2014-06-02 Sold (Public Records) $147,200 Public Records
- 2012-07-13 Sold (Public Records) $121,000 Public Records
Property tax history
+5.7%/yrLatest (2026): $2,522 · +0.8% YoY. Source: county tax records.
Cash-flow waterfall
monthlySold comps — $/sqft
last 12 mo · ≤1 miLoading sold comps…