 10-Plex
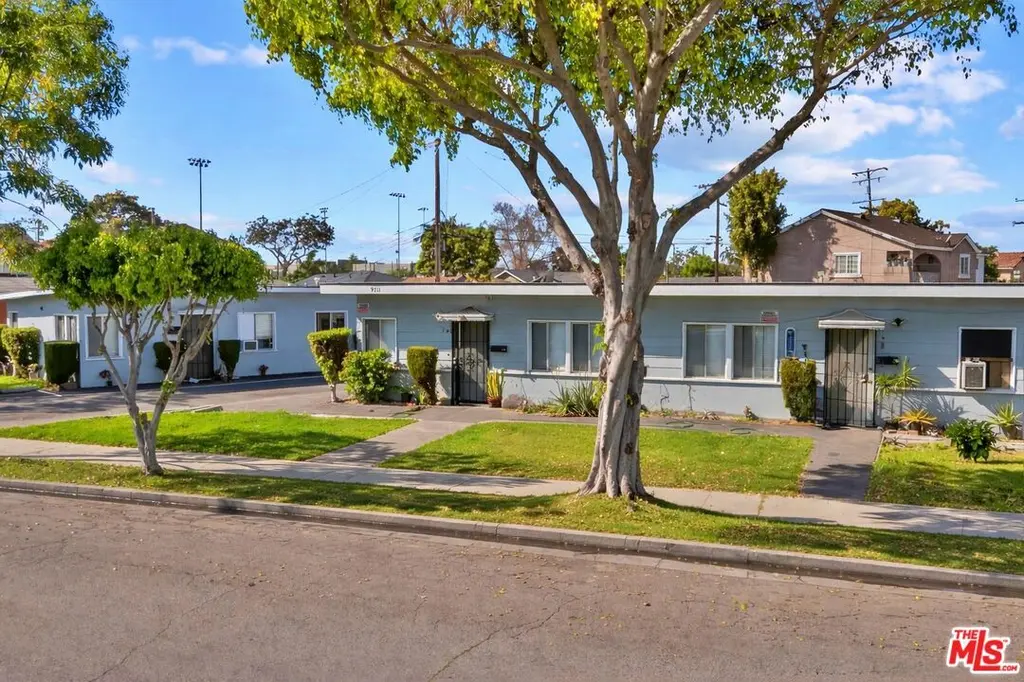
9711 Salt Lake Ave · South Gate, CA
Flood risk 3/10 · Minor
- FEMA flood zone
- X
- Chance of flooding over 30 yrs
- 0.2%
- Est. flood insurance / yr
- $507 – $1,088
Fire risk 1/10 · Minimal
- Est. fire insurance / yr
- $659 – $1,223
Heat risk 5/10 · Moderate
- Hot days now (above 92°F)
- 7 days/yr
- Hot days in 30 yrs
- 22 days/yr
Wind risk 1/10 · Minimal
- Chance of severe wind over 30 yrs
- —
Air-quality risk 6/10 · Moderate
- Unhealthy air days now
- 10 days/yr
- Unhealthy air days in 30 yrs
- 10 days/yr
Risk factors via First Street. Map © Google.
Why this score? — see what drove the D grade
The composite is a weighted blend of 9 inputs, each scored 0–100. Each bar is that input's sub-score; the figure is the points it added to the 100-point composite (weight × sub-score).
- Cash flow +15.0/30.0
- ARV discount +7.5/15.0
- DSCR +4.6/10.0
- 1% rule +3.9/10.0
- Rent growth +3.7/5.0
- Schools +3.6/10.0
- Livability +3.2/5.0
- Condition / age +2.5/5.0
- Appreciation +0.0/10.0
$2,295,000
🖨 Deal sheet (PDF) 📄 Offer letter ✓ Due diligence
Multi-family units
County records classify this as Multi-Family (5+ Unit). Listing-text estimate: 10 units. confirmed
5+ unit building — per-unit beds/baths from public records are typically unavailable; the breakdown below (if shown) is an estimate from the listing text.
Listing remarks MLS
Located in the heart of South Gate, 9711 Salt Lake Avenue presents an attractive investment opportunity featuring a well-maintained 10-unit apartment community situated on a 15,071 square foot lot. The property consists of three separate single-story residential structures, creating a comfortable, low-density layout that appeals to tenants seeking privacy and ease of access. Comprised entirely of one-bedroom/one-bath units, each apartment is separately metered for gas and electricity, enhancing the property's overall cash flow potential. The property also offers assigned onsite parking for each unit, a valuable amenity in this high-demand rental market. The property benefits from its central location within South Gate, providing convenient access to nearby retail centers, dining, and recreational amenities. Residents enjoy proximity to shopping destinations such as Azalea Regional Shopping Center, which features national retailers, grocery stores, restaurants, and entertainment options. Outdoor recreation and community events are easily accessible at South Gate Park, one of the largest parks in the area, offering sports fields, walking paths, and family-friendly amenities. Additionally, cultural dining, shopping, and entertainment can be found nearby at Plaza Mexico.
Key facts
- Central location
- 0.35 acre lot
- 10 parking spots
Tags
Neighborhood map
What this means for you Summary
Snapshot
- This is a 10 × 1-bed/1-bath units multifamily listed at $2.29M.
Deal economics
- At list price, monthly cash flow is $702 ($8k/yr) — positive. Per door: $70/mo.
- The deal already cash-flows at list — no discount required.
- To meet the 1% rule (rent ≥ 1% of price), the offer needs to be $2.03M (11.4% below list).
- Recommended offer: $2.03M (11.4% below list) — sets the bar for 1% rule.
- Cap rate 6.7% vs local median 2.7% in South Gate — top-decile yield for the area; either an underpriced asset or a hidden risk that comps aren't pricing in. Stress-test before assuming the spread holds.
Location & tenants
- Location reads 63/100 on livability (#459 in CA) — a middle-class / working-renter tenant base. Strengths: commute A+; Watch: health & safety C-, crime F, cost of living F.
- Los Angeles Unified (urban): math 29% / reading 54% proficiency, ranked #223 of 517 in CA (top 43%) — families likely to look elsewhere, expect single-tenant / working-renter base with shorter leases; 67% free/reduced lunch — lower-income household profile, screen leases tightly.
- Zoned schools: Tweedy Elementary (460 students, 88% FRL); South Gate Middle (1,342 students, 94% FRL); South East High (math 30% / reading 68%, grade D, #369 of 1,170 statewide, top 32%, 2,057 students, 94% FRL) — zoned schools average 92% FRL vs 67% district-wide (25 pts higher); higher-poverty schools than district average — tighter screening recommended.
- Market conditions: Rents rising fast (+5.0%/yr); 52 active listings in the ZIP; 8 comparable units currently listed for rent nearby; rentals at typical pace (median 26d on market — plan ~3-4 weeks tenant-placement turnaround); 19,697 units permitted in Los Angeles County in 2024 (9,426 in 5+ unit buildings).
- At $20,327/mo this rent would consume 327% of the median local household income ($75k/yr) (locally 4041% of renters already pay >50% of income on rent) — very limited rent-growth headroom before tenants either downsize or default.
Forward outlook
- Local home prices are declining (-3.0%/yr); year-one equity from $16k of loan paydown is wiped out by about $69k of value loss. Plan a longer hold.
- Los Angeles County population projected at +9% by 2050 — modest demand growth; plan on rents tracking national, not racing it.
Negotiation context
- It's been on market 84 days — a 6% lower offer ($2.16M) is reasonable based on typical stale-listing flexibility.
- 6 sale attempts since 9y ago with the ask held roughly flat each time — persistent listings suggest the price (not the market) is what's stuck; bring a comps-based counter.
Risks & watch-outs
- Watch-outs: built in 1950 — expect roof / HVAC / electrical / plumbing capex.
- Climate carrying-cost: extreme-heat days projected 7→22/yr by 2055 (HVAC capex compounding) — expect insurance premiums to compound above CPI over the hold.
Questions for the listing agent
- It's been on market 84 days. Have you received any prior offers? Is the seller open to a 11% concession, seller financing, or rate buy-down credit?
- Can we see the unit-by-unit rent roll, current vacancy, and any below-market leases? What's the average tenancy length?
- What capital expenditures (roof, boiler, parking lot, exteriors) have been made in the last 5 years, and what's planned in the next 2?
- Built in 1950 — when were the roof, HVAC, electrical panel, plumbing, and water heater last replaced?
- Why hasn't it sold? Are there any deal-killer items the seller is aware of (foundation, flood, title, zoning, code violations)?
- Is there a deadline driving the sale (1031 exchange, divorce, estate, relocation)? That informs how much negotiation room exists.
- Schools are D-rated, which usually means shorter tenancies and higher turnover. Who's the typical renter profile here, and what's been the actual vacancy rate?
- Crime grade is F in this area — have there been break-ins, vandalism, or insurance claims at this property in the last 3 years? What carrier currently insures it and at what premium?
- The area grade is low — what's the realistic commute time and amenity access for the typical tenant pool here? Any planned neighborhood developments (good or bad) we should know about?
- What's the average days-on-market for RENTAL listings here right now (not sales)? A rising rental-DOM trend means longer vacancies and softer asking-rent achievability than the comps imply.
- What's the recent tenant-quality profile in this submarket — average credit score on applications, eviction rate, late-payment / NSF rate, and stable-employment percentage? A property-management company in the area should have these aggregated.
- How much new apartment / multifamily construction is in the pipeline within 1–3 miles? Heavy new supply (>2% of stock underway) typically softens rents 12–24 months out; light construction supports rent growth.
Investment metrics
- 1% rule
- 0.89% ✗
- Cap rate
- 6.66%
- Cash-on-cash
- 1.31%
- DSCR
- 1.06
- GRM
- 9.4
CMA / ARV
- ARV (median comp)
- $1,110,193
- List price
- $2,295,000
- Delta
- 106.72%
- Verdict
- OVERPRICED
- Comps
- 3 within 1.0 mi
Show comp detail 2 sales within ~0.75 mi
| Address | Dist | Beds/Ba | Sqft | Sold | Price | $/sf | Match |
|---|---|---|---|---|---|---|---|
| 5142 Duncan Way | 0.22mi | 4/2.0 (+1) | 1,641 (-0%) | 17mo | $775,000 | $472 | 66 |
| 10127 Pinehurst | 0.51mi | 4/2.0 (+1) | 1,508 (-9%) | 1mo | $700,000 | $464 | 52 |
Match score weights: distance 35% · size 25% · config 20% · recency 20%. Top-matched comps best support the ARV.
Projected returns pro-forma
-3.0% appreciation · 4.95% rent growth · sell at horizon
- IRR
- -12.1%
- Equity multiple
- 0.55×
- Total profit
- $-286,528
- Equity at exit
- $342,192
- IRR
- -0.4%
- Equity multiple
- 0.97×
- Total profit
- $-18,329
- Equity at exit
- $198,430
Cash invested: $642,600 (down + closing). Projections, not guarantees.
Landlord ↔ Tenant lean methodology
- Overall (STATE)
- 18 Strongly Tenant-Friendly
- State California
- 18 Strongly Tenant-Friendly · D+13
- County
- — inherits STATE
- City
- — inherits STATE
ZIP-level market 90280
- Rents YoY
- 5.0%
- Active inventory
- 52
- Price-to-rent
- 94.1×
Monthly cashflow live
- Estimated rent
- $20,327 high interval (Pro) →
- Mortgage (P&I)
- −$12,035
- Tax from tax record
- −$2,365 /mo · $28,379/yr
- Insurance
- −$956
- HOA
- −$0
- Vacancy / Maint / Mgmt
- −$4,269
- Net cashflow
- $702
Break-even live
Sensitivity live
| Price | -10% $2,001 | -5% $1,352 | +0% $702 | +5% $52 | +10% $-597 |
|---|---|---|---|---|---|
| Rent | -10% $-904 | -5% $-101 | +0% $702 | +5% $1,505 | +10% $2,308 |
| Rate | -1.0pp $1,858 | -0.5pp $1,286 | base $702 | +0.5pp $107 | +1.0pp $-498 |
10-unit breakdown (identical units grouped — click to expand)
| Units | Beds | Baths | Est. rent |
|---|---|---|---|
| 10× units | 1 | 1 | $20,330 |
| #1 | 1 | 1 | $2,033 |
| #2 | 1 | 1 | $2,033 |
| #3 | 1 | 1 | $2,033 |
| #4 | 1 | 1 | $2,033 |
| #5 | 1 | 1 | $2,033 |
| #6 | 1 | 1 | $2,033 |
| #7 | 1 | 1 | $2,033 |
| #8 | 1 | 1 | $2,033 |
| #9 | 1 | 1 | $2,033 |
| #10 | 1 | 1 | $2,033 |
| Total (10 units) | $20,327 | ||
UW: 25.0% down · 7.5% · 30yr · 1.5% tax · 5.0% vac · 8.0% maint · 8.0% mgmt
Financing live
Cash to close
- Down payment
- $573,750
- Closing costs
- $68,850
- Reserves months
- —
- Total cash needed
- —
Loan-product check · same deal, 3 products live
Conventional
25% down · 7.5% · 30yr
- Down + closing
- —
- Monthly P&I
- —
- Monthly cashflow
- —
- DSCR
- —
- Eligible?
- —
Personal DTI + credit; lowest rate.
DSCR
20% down · 8.5% · 30yr
- Down + closing
- —
- Monthly P&I
- —
- Monthly cashflow
- —
- DSCR
- —
- Eligible?
- —
No personal income docs; deal must DSCR.
Hard money
10% down · 12.0% · 12mo
- Down + closing
- —
- Monthly P&I
- —
- Monthly cashflow
- —
- DSCR
- —
- Eligible?
- —
Short-term bridge; refi at stabilization.
Rent comps 8 comps
| Address | Beds | Baths | Sqft | Rent | $/sqft | DOM | Units | Dist |
|---|---|---|---|---|---|---|---|---|
| 5174 Los Flores Blvd Unit 5174 Lynwood, CA | 3.0 | 2.0 | 1500 | $2,975 | $1.98 | 20d | 1 | 0.96mi |
| 10414 Dorothy Ave South Gate, CA | 3.0 | 1.0 | 1271 | $3,900 | $3.07 | 20d | 1 | 1.02mi |
| 7459 Corey St Downey, CA | 2.0 | 2.0 | 1829 | $4,000 | $2.19 | 26d | 1 | 1.31mi |
| 5538 Gotham St Unit 5540 Bell Gardens, CA | 3.0 | 2.0 | 1240 | $3,200 | $2.58 | 26d | 1 | 1.31mi |
| 5538 Gotham St Unit 5540 Bell Gardens, CA | 3.0 | 2.0 | 1240 | $3,200 | $2.58 | 45d | 1 | 1.31mi |
| 7524 Stewart and Gray Rd Downey, CA | 2.0 | 1.0 | 1050 | $2,895 | $2.76 | 20d | 1 | 1.41mi |
| 7546 Stewart and Gray Rd Downey, CA | 1.0–2.0 | 1.0–2.0 | 925 | $2,000 | $2.16 | 3d | 2 | 1.45mi |
| 5143 Clara St Unit 5143 Cudahy, CA | 4.0 | 1.0 | 1100 | $3,500 | $3.18 | 26d | 1 | 1.49mi |
Listing history 23 events
-
2026-06-04days on market $2,295,000 Active 84 DOM
-
2026-06-03days on market $2,295,000 Active 83 DOM
-
2026-06-02days on market $2,295,000 Active 82 DOM
-
2026-06-01days on market $2,295,000 Active 81 DOM
-
2026-05-31days on market $2,295,000 Active 80 DOM
-
2026-04-20price $2,295,000 1287-char remark
Show marketing remark (1287 chars)
Located in the heart of South Gate, 9711 Salt Lake Avenue presents an attractive investment opportunity featuring a well-maintained 10-unit apartment community situated on a 15,071 square foot lot. The property consists of three separate single-story residential structures, creating a comfortable, low-density layout that appeals to tenants seeking privacy and ease of access. Comprised entirely of one-bedroom/one-bath units, each apartment is separately metered for gas and electricity, enhancing the property's overall cash flow potential. The property also offers assigned onsite parking for each unit, a valuable amenity in this high-demand rental market. The property benefits from its central location within South Gate, providing convenient access to nearby retail centers, dining, and recreational amenities. Residents enjoy proximity to shopping destinations such as Azalea Regional Shopping Center, which features national retailers, grocery stores, restaurants, and entertainment options. Outdoor recreation and community events are easily accessible at South Gate Park, one of the largest parks in the area, offering sports fields, walking paths, and family-friendly amenities. Additionally, cultural dining, shopping, and entertainment can be found nearby at Plaza Mexico.
-
2026-03-12$2,395,000 Active 1287-char remark
Show marketing remark (1287 chars)
Located in the heart of South Gate, 9711 Salt Lake Avenue presents an attractive investment opportunity featuring a well-maintained 10-unit apartment community situated on a 15,071 square foot lot. The property consists of three separate single-story residential structures, creating a comfortable, low-density layout that appeals to tenants seeking privacy and ease of access. Comprised entirely of one-bedroom/one-bath units, each apartment is separately metered for gas and electricity, enhancing the property's overall cash flow potential. The property also offers assigned onsite parking for each unit, a valuable amenity in this high-demand rental market. The property benefits from its central location within South Gate, providing convenient access to nearby retail centers, dining, and recreational amenities. Residents enjoy proximity to shopping destinations such as Azalea Regional Shopping Center, which features national retailers, grocery stores, restaurants, and entertainment options. Outdoor recreation and community events are easily accessible at South Gate Park, one of the largest parks in the area, offering sports fields, walking paths, and family-friendly amenities. Additionally, cultural dining, shopping, and entertainment can be found nearby at Plaza Mexico.
-
2024-01-30soldstatus $2,100,000
-
2017-09-05soldstatus $1,450,000 514-char remark
Show marketing remark (514 chars)
Marcus & Millichap is pleased to present to qualified investors 9711-9717 Salt Lake Avenue, located in South Gate California. This is a garden style, ten unit single story apartment building. The asset is conveniently located nearby job centers and schools as well as the commercial Atlantic Avenue corridor. The property offers a true added value opportunity by remodeling units and increasing rents to current market levels. The property is located in the heart of the industrial zone of the city providing s
-
2017-09-05soldstatus $1,450,000 Closed Sale
Show marketing remark (514 chars)
Marcus & Millichap is pleased to present to qualified investors 9711-9717 Salt Lake Avenue, located in South Gate California. This is a garden style, ten unit single story apartment building. The asset is conveniently located nearby job centers and schools as well as the commercial Atlantic Avenue corridor. The property offers a true added value opportunity by remodeling units and increasing rents to current market levels. The property is located in the heart of the industrial zone of the city providing s
-
2017-09-01soldstatus $1,360,000
-
2017-08-23status Pending Sale
-
2017-08-02historical Active Under Contract
-
2017-08-01$1,450,000 Active
Show marketing remark (514 chars)
Marcus & Millichap is pleased to present to qualified investors 9711-9717 Salt Lake Avenue, located in South Gate California. This is a garden style, ten unit single story apartment building. The asset is conveniently located nearby job centers and schools as well as the commercial Atlantic Avenue corridor. The property offers a true added value opportunity by remodeling units and increasing rents to current market levels. The property is located in the heart of the industrial zone of the city providing s
-
2017-08-01$1,450,000 514-char remark
Show marketing remark (514 chars)
Marcus & Millichap is pleased to present to qualified investors 9711-9717 Salt Lake Avenue, located in South Gate California. This is a garden style, ten unit single story apartment building. The asset is conveniently located nearby job centers and schools as well as the commercial Atlantic Avenue corridor. The property offers a true added value opportunity by remodeling units and increasing rents to current market levels. The property is located in the heart of the industrial zone of the city providing s
-
2017-03-31historical Expired
-
2017-03-31historical
-
2017-03-11status Active
-
2017-03-01historical Hold
-
2017-02-20price
-
2017-01-10Active
-
2017-01-03$1,750,000
-
1969-09-02soldstatus $45,000
ⓘ Source: listings_history table (triggers on properties + properties_extension) + one-shot
backfill from property_details.listing_events for pre-trigger history.
Tax reassessment forecast CA · Resets to sale price
- Current annual tax
- $28,379 · $2,365/mo
- Projected year-2 tax
- $28,379 · $2,365/mo
- Expected delta
- $0/yr ($0/mo · 0.0%)
ⓘ Screening estimate from a state-policy table — verify with the county assessor before closing.
Climate risk First Street
- Flood 3/10 Moderate FEMA zone X · 20% chance over 30 yrs
- Wildfire 1/10 Low
- Heat 5/10 Major 7 d/yr ≥92°F today · 22 d/yr by 30 yrs out
- Wind 1/10 Low
- Air quality 6/10 Major 10 unhealthy d/yr today · 10 by 30 yrs out
Nearby sold comps map
Loading sold comps map…
Walkable amenities ~0.75 mi
Loading nearby amenities…
Taxation est. · year 1
- Rental income
- $243,924
- − Mortgage interest
- −$128,556
- − Property taxes
- −$28,379
- − Insurance
- −$11,475
- − Repairs & maintenance
- −$19,514
- − Management
- −$19,514
- − Depreciation
- −$66,764
- Taxable loss
- −$30,277
- Est. tax savings @ 24.0%
- +$7,266
- After-tax cash flow
- $15,690/yr
For passive investors: Depreciation is non-cash, so a rental often shows a tax loss while cash-flowing — sheltering income. Rental losses are passive: they offset passive income freely, and up to $25,000/yr can offset ordinary (W-2) income if you actively participate and your MAGI is under $100k (phasing out to $0 by $150k); unused losses carry forward. On sale, claimed depreciation is recaptured at up to 25%, and gains may owe capital-gains tax (a 1031 exchange can defer both). Figures are a year-1 estimate at your 24.0% rate — not tax advice; consult a CPA.
Schools (NCES district)
- District
- Los Angeles Unified
- NCES district ID
- 0622710
- Math proficiency
- 29% ▼ -4.00%
- Reading proficiency
- 54% ▲ 10.00%
- Median HH income
- $50,403
- Composite
- 35.67/100
- National rank
- #4875
- State rank
- #223 of 517 in CA
Livability — South Gate
- Score
- 63/100
- State rank
- #459
- US rank
- #15665
Category grades
Schools grade is shown separately in the Schools card above.
Census & demographics
- Census place
- South Gate, CA
- County
- Los Angeles County · 9,444,647 people
- City population
- 91,365
- Metro
- Los Angeles-Long Beach-Anaheim, CA
- Population (ZIP)
- 91,365
- Household income
- $74,651
- Rent vs Own
- Severe rent burden
- 4041.0
Population outlook (Los Angeles County) Hauer SSP2
- Today (2025)
- 10,940,515 people
- By 2030
- 11,256,481 · +2.9%
- By 2040
- 11,729,929 · +7.2%
- By 2050
- 11,948,407 · +9.2%
- By 2075
- 11,818,114 · +8.0%
- By 2100
- 10,842,928 · -0.9%
Race, ethnicity, and origin ACS 2023
- Neighborhood character
- Predominantly Hispanic (95%)
- Race & ethnicity
- Hispanic / Latino 95% Two or more races 27% White 3% Native American 2%
- Hispanic origin (detail)
- Mexican 78%
- Foreign-born
- 42% · Canada
- Languages at home
- 16% English-only · Spanish 83%
Political lean MEDSL · Los Angeles
- 2024 margin
- Solid D (+32.9) · D 64.8% · R 31.9% · Other 3.3%
- 2008→2024 swing
- -7.4pp toward R · 2008: 40.4pp · 2024: 32.9pp
- All cycles
- 2024: D+32.9 2020: D+44.2 2016: D+48.0 2012: D+40.0 2008: D+40.4
Not yet ingested
- Civics
- —
Market trends
- HPI YoY
- ▼ -847.77%
- Current HPI
- 419.791
- Rent YoY
- ▲ 4.95%
- Metro
- Los Angeles-Long Beach-Anaheim, CA
- State GDP YoY
- ▲ 3.21%
- F500 in state
- 116
Industry mix (Fortune 500 HQ in CA)
| Industry | F500 HQs | Revenue |
|---|---|---|
| Technology | 27 | $1,492B |
|
||
| Financial Services | 3 | $174B |
|
||
| Retail | 3 | $44B |
|
||
| Insurance | 3 | $26B |
|
||
| Media / Entertainment | 2 | $115B |
|
||
| Pharmaceuticals / Biotech | 2 | $62B |
|
||
Price history
+5000.0% since first listed18 events — show timeline
- 2026-04-20 Price Changed $2,295,000 TheMLS
- 2026-03-12 Listed $2,395,000 TheMLS
- 2024-01-30 Sold (Public Records) $2,100,000 Public Records
- 2017-09-05 Sold (MLS) $1,450,000 CRMLS
- 2017-09-05 Sold (MLS) $1,450,000 SDMLS
- 2017-09-01 Sold (Public Records) $1,360,000 Public Records
- 2017-08-23 Pending — CRMLS
- 2017-08-02 Contingent — CRMLS
- 2017-08-01 Listed $1,450,000 CRMLS
- 2017-08-01 Listed $1,450,000 SDMLS
- 2017-03-31 Listing Removed — SDMLS
- 2017-03-31 Delisted — TheMLS
- 2017-03-11 Relisted — TheMLS
- 2017-03-01 Delisted — TheMLS
- 2017-02-20 Price Changed — TheMLS
- 2017-01-10 Listed — TheMLS
- 2017-01-03 Listed $1,750,000 SDMLS
- 1969-09-02 Sold (Public Records) $45,000 Public Records
Property tax history
+14.0%/yrLatest (2025): $28,379 · +36.2% YoY. Source: county tax records.
Cash-flow waterfall
monthlySold comps — $/sqft
last 12 mo · ≤1 miLoading sold comps…