6275 Smokey Ridge Rd · Cave Spring, VA
Flood risk 1/10 · Minimal
- FEMA flood zone
- X (unshaded)
- Chance of flooding over 30 yrs
- 0.0%
- Est. flood insurance / yr
- $473 – $860
Fire risk 3/10 · Minor
- Est. fire insurance / yr
- $666 – $1,236
Heat risk 4/10 · Minor
- Hot days now (above 98°F)
- 7 days/yr
- Hot days in 30 yrs
- 18 days/yr
Wind risk 2/10 · Minimal
- Chance of severe wind over 30 yrs
- 1.0%
Air-quality risk 2/10 · Minimal
- Unhealthy air days now
- 0 days/yr
- Unhealthy air days in 30 yrs
- 1 days/yr
Risk factors via First Street. Map © Google.
Why this score? — see what drove the F grade
The composite is a weighted blend of 9 inputs, each scored 0–100. Each bar is that input's sub-score; the figure is the points it added to the 100-point composite (weight × sub-score).
- Cash flow +9.4/30.0
- Schools +6.4/10.0
- ARV discount +4.0/15.0
- Livability +3.8/5.0
- Rent growth +3.2/5.0
- DSCR +2.6/10.0
- Condition / age +2.5/5.0
- 1% rule +2.2/10.0
- Appreciation +0.0/10.0
$319,000
🖨 Deal sheet 📄 Offer letter ✓ Due diligence
Listing remarks
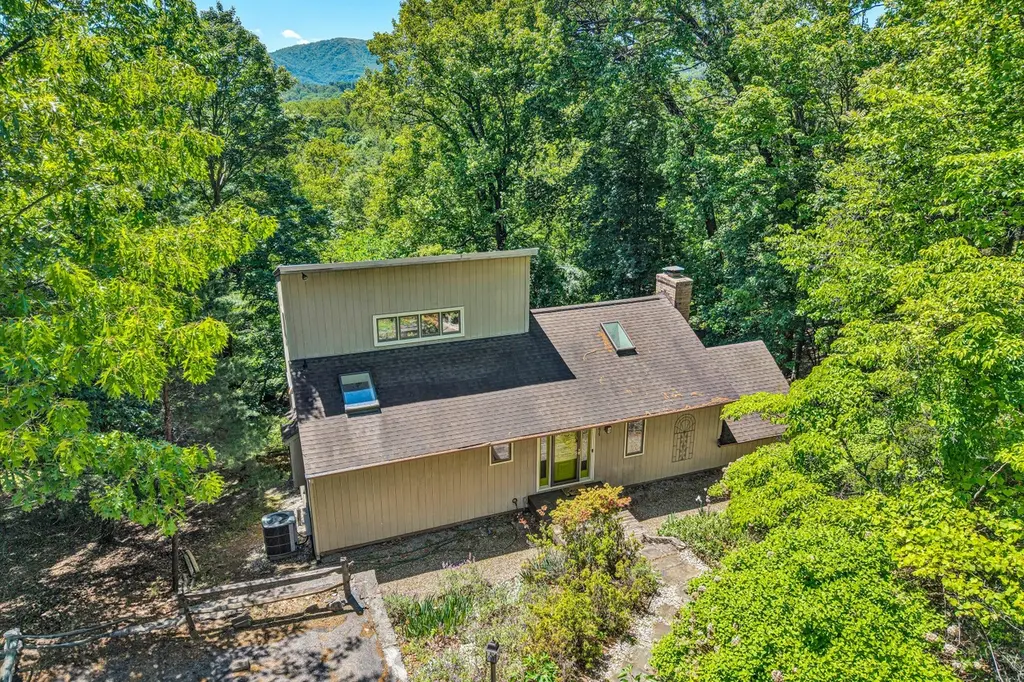
Contemporary home nestled in a peaceful wooded setting with beautiful mountain views! This 3-bedroom, 2.5-bath home offers the perfect blend of privacy and convenience, just minutes from hospitals, shopping, and restaurants. The spacious great room features a stunning masonry fireplace and cathedral ceiling with skylight, creating a warm and inviting atmosphere. The kitchen is filled with natural light from the skylight and includes a large pantry for added storage. Enjoy serene surroundings and comfortable living in this unique mountain retreat!
Key facts
- Masonry fireplace
- Natural light
- Wooded setting
Tags
Property features AI
Finance
- Other: Lot approximately 0.77 acres
- Financial info: Annual tax amount: $3,020
Exterior
- Parking: 2 open parking spaces; Off-street parking
- Utilities: Electric heat pump for heating and cooling
- Home design: Residential property
- Construction: Built in 1982
- Exterior features: Rear porch
Interior
- Bedrooms: 3 bedrooms
- Flooring: Tile flooring; Vinyl flooring; Wood flooring
- Bathrooms: 2 full bathrooms; 1 half bathroom
- Heating & cooling: Heat pump electric heating; Heat pump electric cooling; Has heating and cooling
- Interior features: 10 total rooms; Wood and metal interior doors; Insulated windows
Neighborhood map
What this means for you Summary
Snapshot
- This is a 3-bed/2.5-bath single-family listed at $319k.
Deal economics
- At list price, monthly cash flow is $-227 ($-3k/yr) — negative.
- To cash-flow at today's rent, offer at most $279k (12.6% below list).
- To meet the 1% rule (rent ≥ 1% of price), the offer needs to be $230k (27.9% below list).
- Recommended offer: $230k (27.9% below list) — sets the bar for 1% rule.
- Cap rate 5.4% vs local median 3.4% in Cave Spring — top-decile yield for the area; either an underpriced asset or a hidden risk that comps aren't pricing in. Stress-test before assuming the spread holds.
Location & tenants
- Location reads 76/100 on livability (#113 in VA, #3,513 nationally) — a middle-class / working-renter tenant base. Strengths: housing A+, health & safety A+, cost of living A-; Watch: amenities F, commute F.
- Roanoke County Public School District (suburban): math 71% / reading 78% proficiency, ranked #9 of 131 in VA (top 7%) — strong family-tenant draw, lease renewals of 3-5y typical.
- Zoned schools: Cave Spring Elementary (math 77% / reading 82%, grade A, #141 of 1,108 statewide, top 14%, 508 students, 24% FRL); Hidden Valley Middle (math 76% / reading 83%, grade A+, #28 of 342 statewide, top 8%, 578 students, 26% FRL); Hidden Valley High (math 90% / reading 92%, grade A+, #5 of 319 statewide, top 1%, 830 students, 24% FRL) — zoned schools at 25% FRL track the district average.
- Market conditions: Rents rising (+2.9%/yr); 333 active listings in the ZIP; 3 comparable units currently listed for rent nearby; rentals lingering (median 44d on market — plan ~5-8 weeks vacancy on turnover, expect pricing pressure); 67% of comp listings sitting > 30 days — soft ceiling on asking rent; solid renter incomes; 360 units permitted in Roanoke County in 2024 (228 in 5+ unit buildings).
- This rent runs 30% of the median local income ($91k/yr) — at the standard rent-burdened threshold; future hikes will face affordability resistance.
Forward outlook
- Local home prices are declining (-3.0%/yr); year-one equity from $2k of loan paydown is wiped out by about $10k of value loss. Plan a longer hold.
- Roanoke County population projected at +5% by 2050 — modest demand growth; plan on rents tracking national, not racing it.
Negotiation context
- It's been on market 17 days — a 2% lower offer ($314k) is reasonable based on typical stale-listing flexibility.
- Current owner paid $115k; list at $319k implies a 177% gain — meaningful room to come down on a strong offer.
Questions for the listing agent
- What do current leases actually rent for vs. the listed asking? Can we see a recent rent roll and the last 12 months of T-12 income?
- Is there a deadline driving the sale (1031 exchange, divorce, estate, relocation)? That informs how much negotiation room exists.
- Schools are A-rated — typically a magnet for longer-tenancy family renters. What's the average tenant stay here, and is there a school-zone premium baked into asking?
- The area grade is low — what's the realistic commute time and amenity access for the typical tenant pool here? Any planned neighborhood developments (good or bad) we should know about?
- What's the average days-on-market for RENTAL listings here right now (not sales)? A rising rental-DOM trend means longer vacancies and softer asking-rent achievability than the comps imply.
- What's the recent tenant-quality profile in this submarket — average credit score on applications, eviction rate, late-payment / NSF rate, and stable-employment percentage? A property-management company in the area should have these aggregated.
- How much new for-sale + rental construction is in the pipeline within 1–3 miles? Heavy new supply typically softens prices + rents 12–24 months out; constrained supply supports both.
Investment metrics
- 1% rule
- 0.72% ✗
- Cap rate
- 5.44%
- Cash-on-cash
- -3.05%
- DSCR
- 0.86
- GRM
- 11.6
CMA / ARV
- ARV (on-the-fly)
- $295,872
- Comps found
- 3
Show comp detail 3 sales within ~0.75 mi
| Address | Dist | Beds/Ba | Sqft | Sold | Price | $/sf | Match |
|---|---|---|---|---|---|---|---|
| 5712 Littlehorn Dr | 0.49mi | 3/2.0 | 1,680 (+4%) | 2mo | $260,000 | $155 | 66 |
| 5579 Cynthia Dr | 0.46mi | 3/2.0 | 1,538 (-4%) | 8mo | $309,950 | $202 | 62 |
| 5962 Two Ford Rd | 0.73mi | 3/2.0 | 1,824 (+13%) | 2mo | $335,000 | $184 | 40 |
Match score weights: distance 35% · size 25% · config 20% · recency 20%. Top-matched comps best support the ARV.
Projected returns pro-forma
-3.0% appreciation · 2.88% rent growth · sell at horizon
- IRR
- -21.5%
- Equity multiple
- 0.26×
- Total profit
- $-66,481
- Equity at exit
- $47,564
- IRR
- -15.5%
- Equity multiple
- 0.13×
- Total profit
- $-77,892
- Equity at exit
- $27,581
Cash invested: $89,320 (down + closing). Projections, not guarantees.
Landlord ↔ Tenant lean methodology
- Overall (STATE)
- 55 Moderately Landlord-Leaning
- State Virginia
- 55 Moderately Landlord-Leaning · D+2
- County
- — inherits STATE
- City
- — inherits STATE
ZIP-level market 24018
- Rents YoY
- 2.9%
- Active inventory
- 333
- Price-to-rent
- 11.6×
Monthly cashflow live
- Estimated rent
- $2,299 medium interval (Pro) →
- Mortgage (P&I)
- −$1,673
- Tax from tax record
- −$237 /mo · $2,845/yr
- Insurance
- −$133
- HOA
- −$0
- Vacancy / Maint / Mgmt
- −$483
- Net cashflow
- $-227
Break-even live
UW: 25.0% down · 7.5% · 30yr · 1.5% tax · 5.0% vac · 8.0% maint · 8.0% mgmt
Financing live
Cash to close
- Down payment
- $79,750
- Closing costs
- $9,570
- Reserves months
- —
- Total cash needed
- —
Loan-product check · same deal, 3 products live
Conventional
25% down · 7.5% · 30yr
- Down + closing
- —
- Monthly P&I
- —
- Monthly cashflow
- —
- DSCR
- —
- Eligible?
- —
Personal DTI + credit; lowest rate.
DSCR
20% down · 8.5% · 30yr
- Down + closing
- —
- Monthly P&I
- —
- Monthly cashflow
- —
- DSCR
- —
- Eligible?
- —
No personal income docs; deal must DSCR.
Hard money
10% down · 12.0% · 12mo
- Down + closing
- —
- Monthly P&I
- —
- Monthly cashflow
- —
- DSCR
- —
- Eligible?
- —
Short-term bridge; refi at stabilization.
Rent comps 3 comps
| Address | Beds | Baths | Sqft | Rent | $/sqft | DOM | Units | Dist |
|---|---|---|---|---|---|---|---|---|
| 5220 Lakeland Dr Roanoke, VA | 3.0 | 2.5 | 2000 | $2,695 | $1.35 | 44d | 1 | 1.01mi |
| 5204 Lakeland Dr Roanoke, VA | 3.0 | 2.5 | 2000 | $2,595 | $1.30 | 44d | 1 | 1.04mi |
| 4630 Roxbury Ln Cave Spring, VA | 1.0–2.0 | 1.0–1.5 | 930 | $1,625 | $1.75 | 13d | 7 | 1.19mi |
Listing history 10 events
-
2026-06-08statusdays on market $319,000 Pending 17 DOM
-
2026-06-05days on market $319,000 Active 14 DOM
-
2026-06-02days on market $319,000 Active 12 DOM
-
2026-06-01days on market $319,000 Active 11 DOM
-
2026-05-31days on market $319,000 Active 10 DOM
-
2026-05-30days on market $319,000 Active 9 DOM
-
2026-05-13status Pending
-
2026-05-08$319,000 Active
-
1988-11-01soldstatus $115,000
-
1985-03-01soldstatus $91,000
ⓘ Source: listings_history table (triggers on properties + properties_extension) + one-shot
backfill from property_details.listing_events for pre-trigger history.
Tax reassessment forecast VA · Resets to sale price
- Current annual tax
- $2,845 · $237/mo
- Projected year-2 tax
- $2,845 · $237/mo
- Expected delta
- $0/yr ($0/mo · 0.0%)
ⓘ Screening estimate from a state-policy table — verify with the county assessor before closing.
Climate risk First Street
- Flood 1/10 Low FEMA zone X (unshaded) · 0% chance over 30 yrs
- Wildfire 3/10 Moderate
- Heat 4/10 Moderate 7 d/yr ≥98°F today · 18 d/yr by 30 yrs out
- Wind 2/10 Low 100% chance of damaging wind over 30 yrs
- Air quality 2/10 Low 0 unhealthy d/yr today · 1 by 30 yrs out
Nearby sold comps map
Loading sold comps map…
Walkable amenities ~0.75 mi
Loading nearby amenities…
Taxation est. · year 1
- Rental income
- $27,585
- − Mortgage interest
- −$17,869
- − Property taxes
- −$2,845
- − Insurance
- −$1,595
- − Repairs & maintenance
- −$2,207
- − Management
- −$2,207
- − Depreciation
- −$9,280
- Taxable loss
- −$8,417
- Est. tax savings @ 24.0%
- +$2,020
- After-tax cash flow
- $-702/yr
For passive investors: Depreciation is non-cash, so a rental often shows a tax loss while cash-flowing — sheltering income. Rental losses are passive: they offset passive income freely, and up to $25,000/yr can offset ordinary (W-2) income if you actively participate and your MAGI is under $100k (phasing out to $0 by $150k); unused losses carry forward. On sale, claimed depreciation is recaptured at up to 25%, and gains may owe capital-gains tax (a 1031 exchange can defer both). Figures are a year-1 estimate at your 24.0% rate — not tax advice; consult a CPA.
Schools (NCES district)
- District
- Roanoke County Public School District
- NCES district ID
- 5103330
- Math proficiency
- 71% ▼ -19.00%
- Reading proficiency
- 78% ▼ -6.00%
- Median HH income
- $60,526
- Composite
- 64.08/100
- National rank
- #578
- State rank
- #9 of 131 in VA
Livability — Cave Spring
- Score
- 76/100
- State rank
- #113
- US rank
- #3513
Category grades
Schools grade is shown separately in the Schools card above.
Census & demographics
- Census place
- Cave Spring, VA
- County
- Roanoke County · 67,305 people
- Metro
- Roanoke, VA
- Population (ZIP)
- 38,720
- Household income
- $90,885
- Rent vs Own
- Severe rent burden
- 495.0
Population outlook (Roanoke County) Hauer SSP2
- Today (2025)
- 98,162 people
- By 2030
- 99,793 · +1.7%
- By 2040
- 101,965 · +3.9%
- By 2050
- 103,328 · +5.3%
- By 2075
- 108,641 · +10.7%
- By 2100
- 104,845 · +6.8%
Race, ethnicity, and origin ACS 2023
- Neighborhood character
- Predominantly White (83%)
- Race & ethnicity
- White 83% Asian 6% Hispanic / Latino 4% Two or more races 4% Black 4%
- Common ancestry
- Italian 4% Slovak 3% Serbian 3%
- Foreign-born
- 10% · Canada, China, Vietnam
- Languages at home
- 86% English-only · Spanish 5% Other Indo-European 3% Other Asian/Pacific 1%
Political lean MEDSL · Roanoke
- 2024 margin
- Strong R (+22.5) · D 38.2% · R 60.7% · Other 1.1%
- 2008→2024 swing
- -1.4pp toward R · 2008: -21.1pp · 2024: -22.5pp
- All cycles
- 2024: R+22.5 2020: R+21.8 2016: R+28.1 2012: R+25.6 2008: R+21.1
Not yet ingested
- Civics
- —
Market trends
- HPI YoY
- ▼ -266.18%
- Current HPI
- 176.0558
- Rent YoY
- ▲ 2.88%
- Metro
- Roanoke, VA
- State GDP YoY
- ▲ 2.40%
- F500 in state
- 50
Industry mix (Fortune 500 HQ in VA)
| Industry | F500 HQs | Revenue |
|---|---|---|
| Aerospace / Defense | 4 | $236B |
|
||
| Technology / Defense | 3 | $32B |
|
||
| Financial Services | 2 | $176B |
|
||
| Utilities | 2 | $27B |
|
||
| Insurance | 2 | $25B |
|
||
| Technology | 2 | $15B |
|
||
Price history
+250.5% since first listed4 events — show timeline
- 2026-05-13 Pending — MLSRV
- 2026-05-08 Listed $319,000 MLSRV
- 1988-11-01 Sold (Public Records) $115,000 Public Records
- 1985-03-01 Sold (Public Records) $91,000 Public Records
Property tax history
+2.6%/yrLatest (2025): $2,845 · +8.7% YoY. Source: county tax records.
Cash-flow waterfall
monthlySold comps — $/sqft
last 12 mo · ≤1 miLoading sold comps…