16810 S Inspiration Ave · Mammoth, AZ
Flood risk 1/10 · Minimal
- FEMA flood zone
- X (unshaded)
- Chance of flooding over 30 yrs
- 0.0%
- Est. flood insurance / yr
- $507 – $1,088
Fire risk 5/10 · Moderate
- Est. fire insurance / yr
- $610 – $1,132
Heat risk 8/10 · Major
- Hot days now (above 106°F)
- 7 days/yr
- Hot days in 30 yrs
- 20 days/yr
Wind risk 1/10 · Minimal
- Chance of severe wind over 30 yrs
- —
Air-quality risk 1/10 · Minimal
- Unhealthy air days now
- 0 days/yr
- Unhealthy air days in 30 yrs
- 0 days/yr
Risk factors via First Street. Map © Google.
Why this score? — see what drove the B grade
The composite is a weighted blend of 9 inputs, each scored 0–100. Each bar is that input's sub-score; the figure is the points it added to the 100-point composite (weight × sub-score).
- Cash flow +30.0/30.0
- DSCR +10.0/10.0
- 1% rule +8.7/10.0
- ARV discount +7.5/15.0
- Appreciation +5.0/10.0
- Schools +3.0/10.0
- Livability +3.0/5.0
- Rent growth +2.5/5.0
- Condition / age +2.5/5.0
$84,999
🖨 Deal sheet (PDF) 📄 Offer letter ✓ Due diligence
Listing remarks MLS
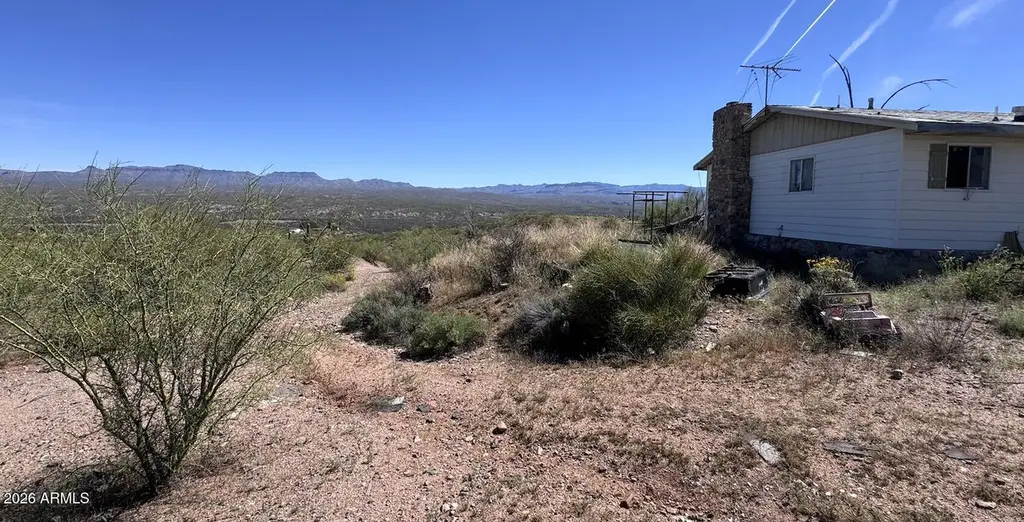
THE VIEW ALONE IS WORTH IT!! Land backs up to Government Land!!!! 2 Bedroom 1 Bath on over 3.472 Acres. There is a separate 1 car garage and Ready for your Farm Animals! WELL IS ALREADY DUG (pump is broken), and Electricity is on the side of the manufactured home with a fireplace!
Key facts
- Well is already dug
- Fireplace
- 3.47 acre lot
Tags
Neighborhood map
What this means for you Summary
Snapshot
- This is a 2-bed/1.0-bath single-family listed at $85k.
Deal economics
- At list price, monthly cash flow is $370 ($4k/yr) — positive.
- The deal already cash-flows at list — no discount required.
- Meets the 1% rule at list price ($1k rent vs $85k).
- Recommended offer: $77k (9.0% below list) — sets the bar for market timing.
Location & tenants
- Location reads 60/100 on livability (#186 in AZ) — a middle-class / working-renter tenant base. Strengths: cost of living A+, housing A+, crime A-; Watch: amenities F, commute F, employment F.
- Mammoth-San Manuel Unified District (4439) (rural): math 34% / reading 32% proficiency, ranked #262 of 501 in AZ (top 52%) — families likely to look elsewhere, expect single-tenant / working-renter base with shorter leases; 64% free/reduced lunch — lower-income household profile, screen leases tightly.
- Zoned schools: San Manuel Jr. High School (math 12% / reading 8%, grade F, #194 of 218 statewide, top 90%, 120 students, 0% FRL); San Manuel High School (math 10% / reading 10%, grade F, #298 of 381 statewide, top 90%, 183 students, 75% FRL) — zoned schools average 38% FRL vs 64% district-wide (27 pts lower); this property's tenant base skews higher-income than the district average.
- Zoned-school proficiency averages 10% at this address vs 33% district-wide (-23 pts) — the specific schools serving this property underperform the Mammoth-San Manuel Unified District (4439) average; the district grade overstates school quality for this exact location.
- Market conditions: 16 active listings in the ZIP; 9,504 units permitted in Pinal County in 2024 (776 in 5+ unit buildings).
Forward outlook
- In year one you build about $3k of equity ($587 loan paydown + $3k appreciation (3.0% local appreciation)).
- At projected returns (3.0% appreciation + 3.0% rent growth), your $24k cash investment doubles in ~3 years — after that, you're playing with house money.
- By year 10, paydown + projected appreciation supports a ~$30k cash-out refi (75% LTV) — recoverable capital for the next deal without selling this one.
Negotiation context
- It's been on market 102 days — a 9% lower offer ($77k) is reasonable based on typical stale-listing flexibility.
- 4 sale attempts since 10y ago with the ask held roughly flat each time — persistent listings suggest the price (not the market) is what's stuck; bring a comps-based counter.
- Current owner paid $22k; list at $85k implies a 278% gain — meaningful room to come down on a strong offer.
Risks & watch-outs
- Climate carrying-cost: moderate wildfire risk; extreme-heat days projected 7→20/yr by 2055 (HVAC capex compounding) — expect insurance premiums to compound above CPI over the hold.
Questions for the listing agent
- It's been on market 102 days. Have you received any prior offers? Is the seller open to a 9% concession, seller financing, or rate buy-down credit?
- Built in 1974 — when were the roof, HVAC, electrical panel, plumbing, and water heater last replaced?
- Why hasn't it sold? Are there any deal-killer items the seller is aware of (foundation, flood, title, zoning, code violations)?
- Is there a deadline driving the sale (1031 exchange, divorce, estate, relocation)? That informs how much negotiation room exists.
- Schools are F-rated, which usually means shorter tenancies and higher turnover. Who's the typical renter profile here, and what's been the actual vacancy rate?
- What's the average days-on-market for RENTAL listings here right now (not sales)? A rising rental-DOM trend means longer vacancies and softer asking-rent achievability than the comps imply.
- What's the recent tenant-quality profile in this submarket — average credit score on applications, eviction rate, late-payment / NSF rate, and stable-employment percentage? A property-management company in the area should have these aggregated.
- How much new for-sale + rental construction is in the pipeline within 1–3 miles? Heavy new supply typically softens prices + rents 12–24 months out; constrained supply supports both.
Investment metrics
- 1% rule
- 1.37% ✓
- Cap rate
- 11.51%
- Cash-on-cash
- 18.63%
- DSCR
- 1.83
- GRM
- 6.1
CMA / ARV
No comps found within radius.
Projected returns pro-forma
3.0% appreciation · 3.0% rent growth · sell at horizon
- IRR
- 25.0%
- Equity multiple
- 2.42×
- Total profit
- $33,772
- Equity at exit
- $38,219
- IRR
- 25.8%
- Equity multiple
- 4.67×
- Total profit
- $87,243
- Equity at exit
- $58,900
Cash invested: $23,800 (down + closing). Projections, not guarantees.
Landlord ↔ Tenant lean methodology
- Overall (STATE)
- 87 Strongly Landlord-Friendly
- State Arizona
- 87 Strongly Landlord-Friendly · R+3
- County
- — inherits STATE
- City
- — inherits STATE
ZIP-level market 85618
- Active inventory
- 16
- Price-to-rent
- 6.1×
Monthly cashflow live
- Estimated rent
- $1,163 medium interval (Pro) →
- Mortgage (P&I)
- −$446
- Tax from tax record
- −$68 /mo · $820/yr
- Insurance
- −$35
- HOA
- −$0
- Vacancy / Maint / Mgmt
- −$244
- Net cashflow
- $370
Break-even live
Sensitivity live
| Price | -10% $418 | -5% $394 | +0% $370 | +5% $346 | +10% $321 |
|---|---|---|---|---|---|
| Rent | -10% $278 | -5% $324 | +0% $370 | +5% $416 | +10% $461 |
| Rate | -1.0pp $412 | -0.5pp $391 | base $370 | +0.5pp $348 | +1.0pp $325 |
UW: 25.0% down · 7.5% · 30yr · 1.5% tax · 5.0% vac · 8.0% maint · 8.0% mgmt
Financing live
Cash to close
- Down payment
- $21,250
- Closing costs
- $2,550
- Reserves months
- —
- Total cash needed
- —
Loan-product check · same deal, 3 products live
Conventional
25% down · 7.5% · 30yr
- Down + closing
- —
- Monthly P&I
- —
- Monthly cashflow
- —
- DSCR
- —
- Eligible?
- —
Personal DTI + credit; lowest rate.
DSCR
20% down · 8.5% · 30yr
- Down + closing
- —
- Monthly P&I
- —
- Monthly cashflow
- —
- DSCR
- —
- Eligible?
- —
No personal income docs; deal must DSCR.
Hard money
10% down · 12.0% · 12mo
- Down + closing
- —
- Monthly P&I
- —
- Monthly cashflow
- —
- DSCR
- —
- Eligible?
- —
Short-term bridge; refi at stabilization.
Listing history 34 events
-
2026-06-22days on market $84,999 Active 102 DOM
-
2026-06-21days on market $84,999 Active 101 DOM
-
2026-06-19days on market $84,999 Active 99 DOM
-
2026-06-18days on market $84,999 Active 98 DOM
-
2026-06-17days on market $84,999 Active 97 DOM
-
2026-06-16days on market $84,999 Active 96 DOM
-
2026-06-15days on market $84,999 Active 95 DOM
-
2026-06-14days on market $84,999 Active 93 DOM
-
2026-06-12days on market $84,999 Active 92 DOM
-
2026-06-09days on market $84,999 Active 89 DOM
-
2026-06-08days on market $84,999 Active 88 DOM
-
2026-06-07days on market $84,999 Active 87 DOM
-
2026-06-05days on market $84,999 Active 85 DOM
-
2026-06-04days on market $84,999 Active 83 DOM
-
2026-06-02days on market $84,999 Active 82 DOM
-
2026-06-01days on market $84,999 Active 81 DOM
-
2026-05-31days on market $84,999 Active 80 DOM
-
2026-05-31days on market $84,999 Active 79 DOM
-
2026-03-12$84,999 Active 282-char remark
Show marketing remark (282 chars)
THE VIEW ALONE IS WORTH IT!! Land backs up to Government Land!!!! 2 Bedroom 1 Bath on over 3.472 Acres. There is a separate 1 car garage and Ready for your Farm Animals! WELL IS ALREADY DUG (pump is broken), and Electricity is on the side of the manufactured home with a fireplace!
-
2017-06-27soldstatus $22,500 Closed 124-char remark
Show marketing remark (124 chars)
High on a hill - over three acres - site built home on rock foundation- large garage - views of town below - fix up property
-
2017-06-27soldstatus $25,000 Closed
Show marketing remark (124 chars)
High on a hill - over three acres - site built home on rock foundation- large garage - views of town below - fix up property
-
2017-06-19status Pending 124-char remark
Show marketing remark (124 chars)
High on a hill - over three acres - site built home on rock foundation- large garage - views of town below - fix up property
-
2017-06-13status Pending
-
2017-05-31price $31,500 124-char remark
Show marketing remark (124 chars)
High on a hill - over three acres - site built home on rock foundation- large garage - views of town below - fix up property
-
2017-05-08price $31,500
-
2017-02-28price $36,000
-
2017-02-21status Active
-
2017-02-14status Pending
-
2017-02-04price $40,000
-
2016-11-30price $45,000
Show marketing remark (124 chars)
High on a hill - over three acres - site built home on rock foundation- large garage - views of town below - fix up property
-
2016-11-30price $45,000 124-char remark
Show marketing remark (124 chars)
High on a hill - over three acres - site built home on rock foundation- large garage - views of town below - fix up property
-
2016-10-29$50,000 Active 124-char remark
Show marketing remark (124 chars)
High on a hill - over three acres - site built home on rock foundation- large garage - views of town below - fix up property
-
2016-10-27$50,000 Active
-
1987-08-19soldstatus $65,000
ⓘ Source: listings_history table (triggers on properties + properties_extension) + one-shot
backfill from property_details.listing_events for pre-trigger history.
Tax reassessment forecast AZ · Resets to sale price
- Current annual tax
- $820 · $68/mo
- Projected year-2 tax
- $820 · $68/mo
- Expected delta
- $0/yr ($0/mo · 0.0%)
ⓘ Screening estimate from a state-policy table — verify with the county assessor before closing.
Climate risk First Street
- Flood 1/10 Low FEMA zone X (unshaded) · 0% chance over 30 yrs
- Wildfire 5/10 Major
- Heat 8/10 Severe 7 d/yr ≥106°F today · 20 d/yr by 30 yrs out
- Wind 1/10 Low
- Air quality 1/10 Low 0 unhealthy d/yr today · 0 by 30 yrs out
Nearby sold comps map
Loading sold comps map…
Walkable amenities ~0.75 mi
Loading nearby amenities…
Taxation est. · year 1
- Rental income
- $13,960
- − Mortgage interest
- −$4,761
- − Property taxes
- −$820
- − Insurance
- −$425
- − Repairs & maintenance
- −$1,117
- − Management
- −$1,117
- − Depreciation
- −$2,473
- Taxable income
- $3,248
- Est. tax owed @ 24.0%
- −$779
- After-tax cash flow
- $3,655/yr
For passive investors: Depreciation is non-cash, so a rental often shows a tax loss while cash-flowing — sheltering income. Rental losses are passive: they offset passive income freely, and up to $25,000/yr can offset ordinary (W-2) income if you actively participate and your MAGI is under $100k (phasing out to $0 by $150k); unused losses carry forward. On sale, claimed depreciation is recaptured at up to 25%, and gains may owe capital-gains tax (a 1031 exchange can defer both). Figures are a year-1 estimate at your 24.0% rate — not tax advice; consult a CPA.
Schools (NCES district)
- District
- Mammoth-San Manuel Unified District (4439)
- NCES district ID
- 0404570
- Math proficiency
- 34% ▲ 11.00%
- Reading proficiency
- 32% ▲ 1.00%
- Median HH income
- $40,112
- Composite
- 30.46/100
- National rank
- #11500
- State rank
- #262 of 501 in AZ
Livability — Mammoth
- Score
- 60/100
- State rank
- #186
- US rank
- #19449
Category grades
Schools grade is shown separately in the Schools card above.
Census & demographics
- Population (ZIP)
- 1,347
Population outlook (Pinal County) Hauer SSP2
- Today (2025)
- 437,574 people
- By 2030
- 446,903 · +2.1%
- By 2040
- 452,589 · +3.4%
- By 2050
- 444,126 · +1.5%
- By 2075
- 430,300 · -1.7%
- By 2100
- 393,536 · -10.1%
Race, ethnicity, and origin ACS 2023
- Neighborhood character
- Predominantly Hispanic (68%)
- Race & ethnicity
- Hispanic / Latino 68% White 30% Two or more races 21%
- Hispanic origin (detail)
- Mexican 61%
- Common ancestry
- Lithuanian 3% Portuguese 2% Slovak 2%
- Foreign-born
- 8% · Canada
- Languages at home
- 60% English-only · Spanish 40%
Political lean MEDSL · Pinal
- 2024 margin
- Strong R (+22.1) · D 38.5% · R 60.6%
- 2008→2024 swing
- -7.6pp toward R · 2008: -14.5pp · 2024: -22.1pp
- All cycles
- 2024: R+22.1 2020: R+17.3 2016: R+19.3 2012: R+17.1 2008: R+14.5
Not yet ingested
- Civics
- —
Market trends
- HPI YoY
- —
- Current HPI
- —
- Rent YoY
- —
- Metro
- —
- State GDP YoY
- ▲ 4.54%
- F500 in state
- 20
Industry mix (Fortune 500 HQ in AZ)
| Industry | F500 HQs | Revenue |
|---|---|---|
| Technology | 2 | $13B |
|
||
| Mining / Metals | 1 | $23B |
|
||
| Environmental Services | 1 | $16B |
|
||
| Metals / Steel | 1 | $14B |
|
||
| Technology Distribution | 1 | $9B |
|
||
| Homebuilding | 1 | $8B |
|
||
Price history
+30.8% since first listed16 events — show timeline
- 2026-03-12 Listed $84,999 ARMLS
- 2017-06-27 Sold (MLS) $25,000 ARMLS
- 2017-06-27 Sold (MLS) $22,500 MLSSAZ
- 2017-06-19 Pending — MLSSAZ
- 2017-06-13 Pending — ARMLS
- 2017-05-31 Price Changed $31,500 MLSSAZ
- 2017-05-08 Price Changed $31,500 ARMLS
- 2017-02-28 Price Changed $36,000 ARMLS
- 2017-02-21 Relisted — ARMLS
- 2017-02-14 Pending — ARMLS
- 2017-02-04 Price Changed $40,000 ARMLS
- 2016-11-30 Price Changed $45,000 ARMLS
- 2016-11-30 Price Changed $45,000 MLSSAZ
- 2016-10-29 Listed $50,000 MLSSAZ
- 2016-10-27 Listed $50,000 ARMLS
- 1987-08-19 Sold (Public Records) $65,000 Public Records
Property tax history
+2.2%/yrLatest (2025): $820 · +4.1% YoY. Source: county tax records.
Cash-flow waterfall
monthlySold comps — $/sqft
last 12 mo · ≤1 miLoading sold comps…