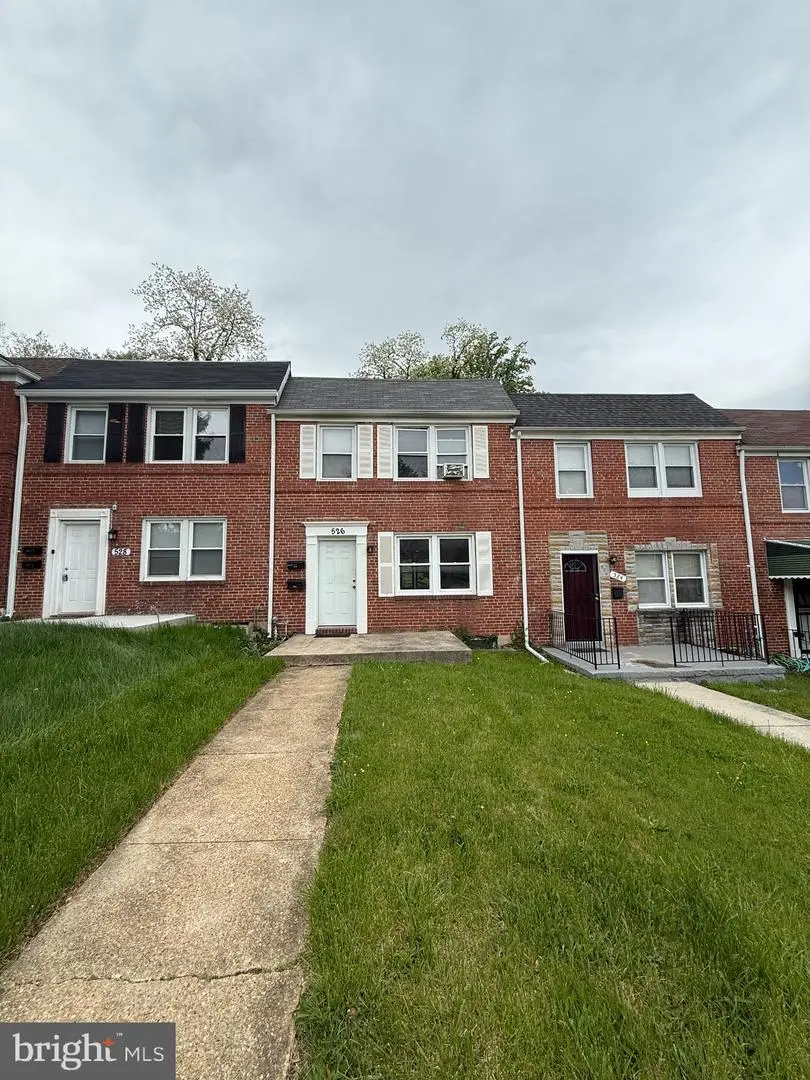
526 Random Rd · Baltimore, MD
Flood risk 1/10 · Minimal
- FEMA flood zone
- X (unshaded)
- Chance of flooding over 30 yrs
- 0.0%
- Est. flood insurance / yr
- $473 – $860
Fire risk 1/10 · Minimal
- Est. fire insurance / yr
- $755 – $1,403
Heat risk 7/10 · Major
- Hot days now (above 103°F)
- 7 days/yr
- Hot days in 30 yrs
- 15 days/yr
Wind risk 5/10 · Moderate
- Chance of severe wind over 30 yrs
- 24.0%
Air-quality risk 3/10 · Minor
- Unhealthy air days now
- 3 days/yr
- Unhealthy air days in 30 yrs
- 4 days/yr
Risk factors via First Street. Map © Google.
Why this score? — see what drove the C- grade
The composite is a weighted blend of 9 inputs, each scored 0–100. Each bar is that input's sub-score; the figure is the points it added to the 100-point composite (weight × sub-score).
- Cash flow +17.7/30.0
- ARV discount +11.7/15.0
- DSCR +5.5/10.0
- 1% rule +4.9/10.0
- Rent growth +3.8/5.0
- Livability +3.8/5.0
- Condition / age +2.5/5.0
- Schools +1.0/10.0
- Appreciation +0.0/10.0
$189,900
🖨 Deal sheet (PDF) 📄 Offer letter ✓ Due diligence
Listing remarks MLS
Versatile townhouse with built-in income potential! Currently set up with the upper level rented, this home offers immediate returns while the improved main level sits vacant and ready for its next chapter. Ideal for investors, house hackers, or buyers seeking flexible living options. Live in one space and offset your mortgage, or maximize rental income across both levels.
Key facts
- Built 1947
- Listed 64 days
Neighborhood map
What this means for you Summary
Snapshot
- This is a 3-bed/2.0-bath townhouse listed at $190k.
Deal economics
- At list price, monthly cash flow is $152 ($2k/yr) — positive.
- The deal already cash-flows at list — no discount required.
- To meet the 1% rule (rent ≥ 1% of price), the offer needs to be $188k (0.8% below list).
- Recommended offer: $179k (6.0% below list) — sets the bar for market timing.
- Cap rate 7.3% vs local median 6.0% in Baltimore — meaningfully above typical; check what's discounted (condition, days-on-market, listing class) to confirm the premium yield is real.
Location & tenants
- Location reads 76/100 on livability (#90 in MD, #3,396 nationally) — a middle-class / working-renter tenant base. Strengths: amenities A+, commute A+, housing A+; Watch: crime F.
- Baltimore City Public Schools (urban): math 7% / reading 16% proficiency, ranked #24 of 24 in MD (top 100%) — low school quality limits family demand, transient renter base, plan for 1-2y turnover; 79% free/reduced lunch — lower-income household profile, screen leases tightly.
- Zoned schools: Elmer A. Henderson: A Johns Hopkins Partnership (math 2% / reading 16%, grade F, #650 of 860 statewide, top 77%, 642 students, 80% FRL); Baltimore Polytechnic Institute (math 71% / reading 84%, grade A-, #22 of 222 statewide, top 10%, 1,555 students, 43% FRL) — zoned schools average 62% FRL vs 79% district-wide (17 pts lower); this property's tenant base skews higher-income than the district average.
- Zoned-school proficiency averages 43% at this address vs 12% district-wide (+32 pts) — the actual schools serving this property are materially stronger than the Baltimore City Public Schools average implies; a family-tenant draw the district grade alone would hide.
- Market conditions: Rents rising fast (+5.4%/yr); 256 active listings in the ZIP; 40 comparable units currently listed for rent nearby; rentals at typical pace (median 26d on market — plan ~3-4 weeks tenant-placement turnaround); 1,273 units permitted in Baltimore city in 2024 (1,104 in 5+ unit buildings).
- This rent runs 38% of the median local income ($60k/yr) — at the standard rent-burdened threshold; future hikes will face affordability resistance.
Forward outlook
- Local home prices are declining (-3.0%/yr); year-one equity from $1k of loan paydown is wiped out by about $6k of value loss. Plan a longer hold.
- Baltimore County population projected to shrink 4% by 2050 — rents likely to lag national; underwrite the cash flow, not the appreciation.
Negotiation context
- It's been on market 64 days — a 6% lower offer ($179k) is reasonable based on typical stale-listing flexibility.
- Current owner paid $95k; list at $190k implies a 100% gain — meaningful room to come down on a strong offer.
Risks & watch-outs
- Watch-outs: built in 1947 — expect roof / HVAC / electrical / plumbing capex.
- Climate carrying-cost: moderate wind risk, 24% chance of damaging wind over 30y; extreme-heat days projected 7→15/yr by 2055 (HVAC capex compounding) — expect insurance premiums to compound above CPI over the hold.
Questions for the listing agent
- It's been on market 64 days. Have you received any prior offers? Is the seller open to a 6% concession, seller financing, or rate buy-down credit?
- Built in 1947 — when were the roof, HVAC, electrical panel, plumbing, and water heater last replaced?
- Why hasn't it sold? Are there any deal-killer items the seller is aware of (foundation, flood, title, zoning, code violations)?
- Is there a deadline driving the sale (1031 exchange, divorce, estate, relocation)? That informs how much negotiation room exists.
- Schools are D-rated, which usually means shorter tenancies and higher turnover. Who's the typical renter profile here, and what's been the actual vacancy rate?
- Crime grade is F in this area — have there been break-ins, vandalism, or insurance claims at this property in the last 3 years? What carrier currently insures it and at what premium?
- What's the average days-on-market for RENTAL listings here right now (not sales)? A rising rental-DOM trend means longer vacancies and softer asking-rent achievability than the comps imply.
- What's the recent tenant-quality profile in this submarket — average credit score on applications, eviction rate, late-payment / NSF rate, and stable-employment percentage? A property-management company in the area should have these aggregated.
- How much new for-sale + rental construction is in the pipeline within 1–3 miles? Heavy new supply typically softens prices + rents 12–24 months out; constrained supply supports both.
Investment metrics
- 1% rule
- 0.99% ✗
- Cap rate
- 7.25%
- Cash-on-cash
- 3.43%
- DSCR
- 1.15
- GRM
- 8.4
CMA / ARV
- ARV (median comp)
- $209,653
- List price
- $189,900
- Delta
- -9.42%
- Verdict
- FAIR
- Comps
- 20 within 1.0 mi
Show comp detail 12 sales within ~0.75 mi
| Address | Dist | Beds/Ba | Sqft | Sold | Price | $/sf | Match |
|---|---|---|---|---|---|---|---|
| 5170 Stafford Rd | 0.09mi | 3/1.5 | 1,450 (+2%) | 2mo | $125,000 | $86 | 89 |
| 4420 Parkton St | 0.58mi | 3/2.0 | 1,450 (+2%) | 1mo | $140,000 | $97 | 69 |
| 748 Bethnal Rd | 0.62mi | 3/1.5 | 1,408 (-1%) | 2mo | $183,000 | $130 | 65 |
| 642 Queensgate Rd | 0.34mi | 3/2.0 | 1,260 (-12%) | 0mo | $234,444 | $186 | 65 |
| 542 Lucia Ave | 0.54mi | 3/2.0 | 1,344 (-6%) | 1mo | $205,000 | $153 | 64 |
| 4516 Pen Lucy Rd | 0.74mi | 3/2.0 | 1,416 (-1%) | 2mo | $205,000 | $145 | 63 |
| 4626 Frederick Ave | 0.50mi | 3/2.0 | 1,568 (+10%) | 2mo | $165,000 | $105 | 59 |
| 4702 Vancouver Rd | 0.50mi | 4/2.0 (+1) | 1,512 (+6%) | 4mo | $225,000 | $149 | 58 |
| 4865 Melbourne Rd | 0.42mi | 2/2.0 (-1) | 1,232 (-14%) | 2mo | $214,000 | $174 | 51 |
| 40 Hillvale Rd | 0.64mi | 3/2.0 | 1,224 (-14%) | 2mo | $230,000 | $188 | 45 |
| 48 Hillvale Rd | 0.65mi | 3/1.5 | 1,224 (-14%) | 2mo | $180,000 | $147 | 43 |
| 38 Hillvale Rd | 0.65mi | 3/1.0 | 1,224 (-14%) | 3mo | $160,000 | $131 | 40 |
Match score weights: distance 35% · size 25% · config 20% · recency 20%. Top-matched comps best support the ARV.
Projected returns pro-forma
-3.0% appreciation · 5.38% rent growth · sell at horizon
- IRR
- -8.2%
- Equity multiple
- 0.69×
- Total profit
- $-16,441
- Equity at exit
- $28,315
- IRR
- 4.2%
- Equity multiple
- 1.34×
- Total profit
- $18,208
- Equity at exit
- $16,419
Cash invested: $53,172 (down + closing). Projections, not guarantees.
Landlord ↔ Tenant lean methodology
- Overall (CITY)
- 12 Strongly Tenant-Friendly
- State Maryland
- 27 Tenant-Leaning · D+14
- County
- — inherits STATE
- City Baltimore
- 12 Strongly Tenant-Friendly · D+58
ZIP-level market 21229
- Rents YoY
- 5.4%
- Active inventory
- 256
- Price-to-rent
- 8.4×
Monthly cashflow live
- Estimated rent
- $1,884 high interval (Pro) →
- Mortgage (P&I)
- −$996
- Tax from tax record
- −$261 /mo · $3,137/yr
- Insurance
- −$79
- HOA
- −$0
- Vacancy / Maint / Mgmt
- −$396
- Net cashflow
- $152
Break-even live
Sensitivity live
| Price | -10% $259 | -5% $206 | +0% $152 | +5% $98 | +10% $44 |
|---|---|---|---|---|---|
| Rent | -10% $3 | -5% $77 | +0% $152 | +5% $226 | +10% $301 |
| Rate | -1.0pp $247 | -0.5pp $200 | base $152 | +0.5pp $103 | +1.0pp $53 |
UW: 25.0% down · 7.5% · 30yr · 1.5% tax · 5.0% vac · 8.0% maint · 8.0% mgmt
Financing live
Cash to close
- Down payment
- $47,475
- Closing costs
- $5,697
- Reserves months
- —
- Total cash needed
- —
Loan-product check · same deal, 3 products live
Conventional
25% down · 7.5% · 30yr
- Down + closing
- —
- Monthly P&I
- —
- Monthly cashflow
- —
- DSCR
- —
- Eligible?
- —
Personal DTI + credit; lowest rate.
DSCR
20% down · 8.5% · 30yr
- Down + closing
- —
- Monthly P&I
- —
- Monthly cashflow
- —
- DSCR
- —
- Eligible?
- —
No personal income docs; deal must DSCR.
Hard money
10% down · 12.0% · 12mo
- Down + closing
- —
- Monthly P&I
- —
- Monthly cashflow
- —
- DSCR
- —
- Eligible?
- —
Short-term bridge; refi at stabilization.
Rent comps 40 comps
| Address | Beds | Baths | Sqft | Rent | $/sqft | DOM | Units | Dist |
|---|---|---|---|---|---|---|---|---|
| 5147 Frederick Ave Baltimore, MD | 3.0 | 2.0 | 1216 | $1,950 | $1.60 | 5d | 1 | 0.12mi |
| 501 Hazlett Ave Baltimore, MD | 2.0–3.0 | 1.5–2.0 | 1044 | $1,750 | $1.68 | 0d | 8 | 0.20mi |
| 114 S Rock Glen Rd Baltimore, MD | 4.0 | 1.5 | 1160 | $2,350 | $2.03 | 14d | 1 | 0.28mi |
| 643 S Wickham Rd Baltimore, MD | 2.0 | 3.0 | 896 | $1,800 | $2.01 | 0d | 1 | 0.30mi |
| 402 Colleen Rd Baltimore, MD | 1.0–2.0 | 1.0 | 910 | $1,450 | $1.59 | 4d | 11 | 0.32mi |
| 131 N Bend Rd Unit 131-1B Baltimore, MD | 2.0 | 1.5 | 910 | $1,225 | $1.35 | 23d | 1 | 0.33mi |
| 670 Queensgate Rd Baltimore, MD | 3.0 | 2.0 | 1600 | $2,100 | $1.31 | 6d | 1 | 0.36mi |
| 220 Stonecroft Rd Unit 230-D Baltimore, MD | 2.0 | 1.5 | 900 | $1,395 | $1.55 | 23d | 1 | 0.41mi |
| 220 Stonecroft Rd Unit 232-I Baltimore, MD | 2.0 | 1.5 | 900 | $1,295 | $1.44 | 19d | 1 | 0.41mi |
| 220 Stonecroft Rd Unit 220-H Baltimore, MD | 2.0 | 1.5 | 900 | $1,245 | $1.38 | 0d | 1 | 0.41mi |
| 5364 Jamestowne Ct Baltimore, MD | 3.0 | 1.0–1.5 | 787 | $1,905 | $2.42 | 0d | 15 | 0.41mi |
| 565 Brisbane Rd Baltimore, MD | 2.0 | 2.0 | 1146 | $1,675 | $1.46 | 25d | 1 | 0.42mi |
| 19 S Tremont Rd Baltimore, MD | 3.0 | 1.0 | 1350 | $1,850 | $1.37 | 45d | 1 | 0.44mi |
| 2 S Tremont Rd Baltimore, MD | 3.0 | 2.0 | 1450 | $1,800 | $1.24 | 12d | 1 | 0.44mi |
| 2 S Tremont Rd Baltimore, MD | 3.0 | 2.0 | 1450 | $1,800 | $1.24 | 25d | 1 | 0.44mi |
| 500 Lucia Ave Baltimore, MD | 3.0 | 2.0 | 1472 | $2,100 | $1.43 | 18d | 1 | 0.53mi |
| 219 Atholgate Ln Baltimore, MD | 1.0–3.0 | 1.0–1.5 | 814 | $1,500 | $1.84 | 4d | 2 | 0.53mi |
| 4431 Eldone Rd Baltimore, MD | 3.0 | 2.0 | 896 | $2,000 | $2.23 | 25d | 1 | 0.56mi |
| 4601 Pen Lucy Rd Unit 4718-F Baltimore, MD | 2.0 | 1.0 | 879 | $1,225 | $1.39 | 3d | 1 | 0.57mi |
| 586 Lucia Ave Baltimore, MD | 3.0 | 1.5 | 1178 | $2,100 | $1.78 | 19d | 1 | 0.57mi |
| 613 S Beechfield Ave Baltimore, MD | 3.0 | 1.5 | 1080 | $1,950 | $1.81 | 45d | 1 | 0.60mi |
| 627 Lucia Ave Baltimore, MD | 3.0 | 1.0 | 892 | $1,750 | $1.96 | 25d | 1 | 0.63mi |
| 738 Yale Ave Baltimore, MD | 2.0 | 1.0 | 1346 | $1,900 | $1.41 | 25d | 1 | 0.69mi |
| 751 Yale Ave Baltimore, MD | 3.0 | 1.5 | 1024 | $1,750 | $1.71 | 45d | 1 | 0.72mi |
| 201 S Symington Ave Catonsville, MD | 1.0–2.0 | 1.0 | 788 | $1,509 | $1.91 | 0d | 12 | 0.76mi |
| 4301 Parkton St Baltimore, MD | 1.0–3.0 | 1.0 | 730 | $1,550 | $2.12 | 45d | 1 | 0.77mi |
| 6300 Mount Ridge Rd Unit A Catonsville, MD | 2.0 | 1.0 | 1100 | $1,750 | $1.59 | 45d | 1 | 0.79mi |
| 24 Laurence Brooke Rd Catonsville, MD | 4.0 | 3.0 | 1440 | $2,800 | $1.94 | 14d | 1 | 0.84mi |
| 603 Braeside Rd Baltimore, MD | 3.0 | 2.0 | 1416 | $2,400 | $1.69 | 45d | 1 | 0.85mi |
| 111 Upmanor Rd Baltimore, MD | 3.0 | 1.5 | 1224 | $2,163 | $1.77 | 45d | 1 | 0.86mi |
| 51 Briarwood Rd Catonsville, MD | 3.0 | 1.0 | 1200 | $2,100 | $1.75 | 45d | 1 | 0.88mi |
| 304 Collins Ave Unit 2 Baltimore, MD | 3.0 | 1.0 | 1016 | $2,100 | $2.07 | 45d | 1 | 0.94mi |
| 4520 Scarlet Oak Ln Baltimore, MD | 2.0 | 1.0 | 1025 | $1,500 | $1.46 | 45d | 1 | 0.98mi |
| 21 Holland Hill Ct Catonsville, MD | 4.0 | 1.5 | 1320 | $2,200 | $1.67 | 45d | 1 | 1.00mi |
| 4018 Massachusetts Ave Baltimore, MD | 3.0 | 1.0 | 1050 | $1,400 | $1.33 | 25d | 1 | 1.01mi |
| 3 Brucester Bridge Ct Catonsville, MD | 4.0 | 2.5 | 1440 | $2,700 | $1.88 | 25d | 1 | 1.02mi |
| 4610 College Ave Baltimore, MD | 4.0 | 2.0 | 1440 | $2,200 | $1.53 | 19d | 1 | 1.03mi |
| 117 Collins Ave Baltimore, MD | 3.0 | 3.0 | 1617 | $2,350 | $1.45 | 45d | 1 | 1.03mi |
| 212 S Loudon Ave Baltimore, MD | 3.0 | 1.5 | 1310 | $1,550 | $1.18 | 45d | 1 | 1.05mi |
| 1 Summit Hill Ct Unit T-2 Baltimore, MD | 2.0 | 2.0 | 1009 | $1,900 | $1.88 | 45d | 1 | 1.05mi |
Listing history 17 events
-
2026-06-21days on market $189,900 Active 64 DOM
-
2026-06-18days on market $189,900 Active 61 DOM
-
2026-06-17days on market $189,900 Active 60 DOM
-
2026-06-16days on market $189,900 Active 59 DOM
-
2026-06-15pricedays on market $189,900 Active 58 DOM
-
2026-06-13days on market $199,900 Active 56 DOM
-
2026-06-09days on market $199,900 Active 52 DOM
-
2026-06-08days on market $199,900 Active 51 DOM
-
2026-06-07days on market $199,900 Active 50 DOM
-
2026-06-04days on market $199,900 Active 47 DOM
-
2026-06-03days on market $199,900 Active 46 DOM
-
2026-06-02days on market $199,900 Active 45 DOM
-
2026-06-01days on market $199,900 Active 44 DOM
-
2026-05-31days on market $199,900 Active 43 DOM
-
2026-04-18$199,900 Active 375-char remark
Show marketing remark (375 chars)
Versatile townhouse with built-in income potential! Currently set up with the upper level rented, this home offers immediate returns while the improved main level sits vacant and ready for its next chapter. Ideal for investors, house hackers, or buyers seeking flexible living options. Live in one space and offset your mortgage, or maximize rental income across both levels.
-
2021-04-07soldstatus $95,000
-
1983-07-08soldstatus $44,000
ⓘ Source: listings_history table (triggers on properties + properties_extension) + one-shot
backfill from property_details.listing_events for pre-trigger history.
Tax reassessment forecast MD · Partial reset (capped growth)
- Current annual tax
- $3,137 · $261/mo
- Projected year-2 tax
- $3,137 · $261/mo
- Expected delta
- $0/yr ($0/mo · 0.0%)
ⓘ Screening estimate from a state-policy table — verify with the county assessor before closing.
Climate risk First Street
- Flood 1/10 Low FEMA zone X (unshaded) · 0% chance over 30 yrs
- Wildfire 1/10 Low
- Heat 7/10 Severe 7 d/yr ≥103°F today · 15 d/yr by 30 yrs out
- Wind 5/10 Major 24% chance of damaging wind over 30 yrs
- Air quality 3/10 Moderate 3 unhealthy d/yr today · 4 by 30 yrs out
Nearby sold comps map
Loading sold comps map…
Walkable amenities ~0.75 mi
Loading nearby amenities…
Taxation est. · year 1
- Rental income
- $22,606
- − Mortgage interest
- −$10,637
- − Property taxes
- −$3,137
- − Insurance
- −$950
- − Repairs & maintenance
- −$1,808
- − Management
- −$1,808
- − Depreciation
- −$5,524
- Taxable loss
- −$1,259
- Est. tax savings @ 24.0%
- +$302
- After-tax cash flow
- $2,124/yr
For passive investors: Depreciation is non-cash, so a rental often shows a tax loss while cash-flowing — sheltering income. Rental losses are passive: they offset passive income freely, and up to $25,000/yr can offset ordinary (W-2) income if you actively participate and your MAGI is under $100k (phasing out to $0 by $150k); unused losses carry forward. On sale, claimed depreciation is recaptured at up to 25%, and gains may owe capital-gains tax (a 1031 exchange can defer both). Figures are a year-1 estimate at your 24.0% rate — not tax advice; consult a CPA.
Schools (NCES district)
- District
- Baltimore City Public Schools
- NCES district ID
- 2400090
- Math proficiency
- 7% ▼ -9.00%
- Reading proficiency
- 16% ▼ -5.00%
- Median HH income
- $42,108
- Composite
- 10.08/100
- National rank
- #9805
- State rank
- #24 of 24 in MD
Livability — Baltimore
- Score
- 76/100
- State rank
- #90
- US rank
- #3396
Category grades
Schools grade is shown separately in the Schools card above.
Census & demographics
- Census place
- Baltimore, MD
- County
- Baltimore City · 558,601 people
- City population
- 588,727
- Metro
- Baltimore-Columbia-Towson, MD
- Population (ZIP)
- 46,679
- Household income
- $60,047
- Rent vs Own
- Severe rent burden
- 2776.0
Population outlook (Baltimore County) Hauer SSP2
- Today (2025)
- 624,249 people
- By 2030
- 621,541 · -0.4%
- By 2040
- 609,756 · -2.3%
- By 2050
- 597,249 · -4.3%
- By 2075
- 552,236 · -11.5%
- By 2100
- 513,934 · -17.7%
Race, ethnicity, and origin ACS 2023
- Neighborhood character
- Predominantly Black (73%)
- Race & ethnicity
- Black 73% White 15% Hispanic / Latino 6% Two or more races 4% Asian 3%
- Hispanic origin (detail)
- Common ancestry
- Lithuanian 1% Romanian 1% Serbian 1%
- Foreign-born
- 5% · Canada, Philippines
- Languages at home
- 91% English-only · Spanish 4% Other Indo-European 2% Other Asian/Pacific 1%
Political lean MEDSL · Baltimore
- 2024 margin
- Solid D (+73.0) · D 85.2% · R 12.2% · Other 2.6%
- 2008→2024 swing
- -2.5pp toward R · 2008: 75.5pp · 2024: 73.0pp
- All cycles
- 2024: D+73.0 2020: D+76.6 2016: D+74.6 2012: D+76.4 2008: D+75.5
Not yet ingested
- Civics
- —
Market trends
- HPI YoY
- ▼ -259.07%
- Current HPI
- 226.896
- Rent YoY
- ▲ 5.38%
- Metro
- Baltimore-Columbia-Towson, MD
- State GDP YoY
- ▲ 2.97%
- F500 in state
- 12
Industry mix (Fortune 500 HQ in MD)
| Industry | F500 HQs | Revenue |
|---|---|---|
| Aerospace / Defense | 1 | $71B |
|
||
| Utilities | 1 | $25B |
|
||
| Hotels | 1 | $24B |
|
||
| Consumer Goods | 1 | $7B |
|
||
| Real Estate | 1 | $6B |
|
||
| Chemicals | 1 | $2B |
|
||
Price history
+354.3% since first listed3 events — show timeline
- 2026-04-18 Listed $199,900 BRIGHT MLS
- 2021-04-07 Sold (Public Records) $95,000 Public Records
- 1983-07-08 Sold (Public Records) $44,000 Public Records
Property tax history
+1.6%/yrLatest (2025): $3,137 · +6.9% YoY. Source: county tax records.
Cash-flow waterfall
monthlySold comps — $/sqft
last 12 mo · ≤1 miLoading sold comps…