 🌊 Lakefront
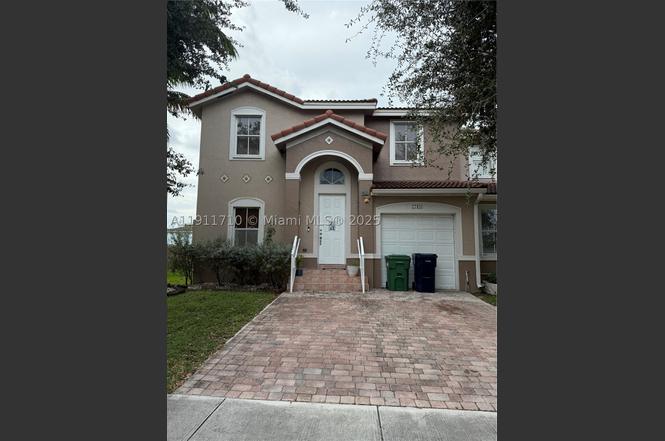
27450 SW 138th Path · Naranja, FL
Flood risk 5/10 · Moderate
- FEMA flood zone
- AH
- Chance of flooding over 30 yrs
- 0.24%
- Est. flood insurance / yr
- $1,142 – $2,507
Fire risk 1/10 · Minimal
- Est. fire insurance / yr
- $947 – $1,759
Heat risk 10/10 · Severe
- Hot days now (above 105°F)
- 7 days/yr
- Hot days in 30 yrs
- 32 days/yr
Wind risk 10/10 · Severe
- Chance of severe wind over 30 yrs
- 99.0%
Air-quality risk 2/10 · Minimal
- Unhealthy air days now
- 1 days/yr
- Unhealthy air days in 30 yrs
- 1 days/yr
Risk factors via First Street. Map © Google.
Why this score? — see what drove the D+ grade
The composite is a weighted blend of 9 inputs, each scored 0–100. Each bar is that input's sub-score; the figure is the points it added to the 100-point composite (weight × sub-score).
- ARV discount +15.0/15.0
- Cash flow +14.4/30.0
- DSCR +4.4/10.0
- Schools +4.2/10.0
- 1% rule +3.5/10.0
- Livability +3.2/5.0
- Condition / age +2.5/5.0
- Rent growth +2.3/5.0
- Appreciation +0.0/10.0
$375,000
🖨 Deal sheet (PDF) 📄 Offer letter ✓ Due diligence
Listing remarks MLS
Corporate owned property! Absolutely beautiful 4 bedroom 2.5 bath. Quiet corner unit with waterfront (canal view). Beautiful tile floors and carpet in bedroom. Large master bedroom with double vanity in master bath. l
Key facts
- Clubhouse
- Gated security
- Pool
Tags
Property features AI
Finance
- Other: Association-managed pool
- Financial info: Pets allowed (dogs OK)
- HOA & community: Monthly association fee; Association covers common areas, grounds maintenance, parking, pool(s), recreation facilities, reserve fund, sewer, security, and trash; Community amenities include clubhouse, fitness center, barbecue, picnic area, playground, and pool
Exterior
- Parking: Attached garage; Garage with door opener; Two or more parking spaces (includes 1 covered space)
- Security: Complex fenced; Phone entry; Security guard; Smoke detectors
- Utilities: Cable available; Sewer included in association; Trash service included in association
- Home design: 2 stories; Attached property; First-floor entry
- Construction: Block construction; Resale property
- Exterior features: Patio; Storm/security shutters; Canal-front waterfront; Has a view; Exterior lighting
Interior
- Kitchen: Dishwasher; Electric range; Disposal; Microwave; Refrigerator; Eat-in kitchen / breakfast area
- Bedrooms: Primary bedroom located on upper level; Additional bedroom on main level
- Flooring: Carpet; Ceramic tile
- Bathrooms: 2 full bathrooms; 1 half bathroom
- Heating & cooling: Central heating; Central air conditioning; Ceiling fan(s)
- Interior features: Blinds on windows; Bedroom on main level; Breakfast area; Dual sinks; Eat-in kitchen; First-floor entry; Combined living/dining room; Tub with shower; Upper-level primary bedroom; Walk-in closet(s)
- Laundry & utility: Washer; Dryer; Electric water heater; Satellite dish
Neighborhood map
What this means for you Summary
Snapshot
- This is a 4-bed/2.0-bath townhouse listed at $375k.
Deal economics
- At list price, monthly cash flow is $-76 ($-916/yr) — negative.
- To cash-flow at today's rent, offer at most $362k (3.6% below list).
- To meet the 1% rule (rent ≥ 1% of price), the offer needs to be $320k (14.7% below list).
- Recommended offer: $320k (14.7% below list) — sets the bar for 1% rule.
Location & tenants
- Location reads 65/100 on livability (#634 in FL) — a middle-class / working-renter tenant base. Strengths: housing A, commute A-, cost of living A-; Watch: amenities F, employment F, health & safety F.
- Miami-Dade (suburban): math 45% / reading 54% proficiency, ranked #40 of 73 in FL (top 55%) — families likely to look elsewhere, expect single-tenant / working-renter base with shorter leases; 64% free/reduced lunch — lower-income household profile, screen leases tightly.
- Zoned schools: Dr. William A. Chapman Elementary School (math 37% / reading 37%, grade F, #1,609 of 2,144 statewide, top 77%, 554 students, 79% FRL); Redland Middle School (math 21% / reading 30%, grade F, #512 of 571 statewide, top 90%, 601 students, 71% FRL); Homestead Senior High School (math 24% / reading 23%, grade F, #533 of 667 statewide, top 80%, 2,020 students, 74% FRL).
- Zoned-school proficiency averages 29% at this address vs 50% district-wide (-21 pts) — the specific schools serving this property underperform the Miami-Dade average; the district grade overstates school quality for this exact location.
- Market conditions: Rents soft (-1.0%/yr); 590 active listings in the ZIP; 40 comparable units currently listed for rent nearby; rentals at typical pace (median 27d on market — plan ~3-4 weeks tenant-placement turnaround); 10,051 units permitted in Miami-Dade County in 2024 (7,758 in 5+ unit buildings).
- At $3,198/mo this rent would consume 52% of the median local household income ($73k/yr) (locally 3351% of renters already pay >50% of income on rent) — very limited rent-growth headroom before tenants either downsize or default.
Forward outlook
- Local home prices are declining (-3.0%/yr); year-one equity from $3k of loan paydown is wiped out by about $11k of value loss. Plan a longer hold.
- Miami-Dade County population projected at +28% by 2050 — long-run rental-demand tailwind backs the buy-and-hold thesis.
Negotiation context
- It's been on market 184 days — a 12% lower offer ($330k) is reasonable based on typical stale-listing flexibility.
- 2 sale attempts; this cycle's ask has dropped $54k (13%) from the opening price — seller is motivated, your offer sets the floor, not the list.
- Current owner paid $130k; list at $375k implies a 188% gain — meaningful room to come down on a strong offer.
Risks & watch-outs
- Watch-outs: flood insurance adds $152/mo.
- Climate carrying-cost: in FEMA flood zone AH (mandatory federal flood insurance); severe wind risk, 99% chance of damaging wind over 30y; extreme-heat days projected 7→32/yr by 2055 (HVAC capex compounding) — expect insurance premiums to compound above CPI over the hold.
Questions for the listing agent
- What do current leases actually rent for vs. the listed asking? Can we see a recent rent roll and the last 12 months of T-12 income?
- It's been on market 184 days. Have you received any prior offers? Is the seller open to a 15% concession, seller financing, or rate buy-down credit?
- What's the actual annual flood-insurance premium (NFIP or private), and is the property in a SFHA with mandatory coverage?
- What does the HOA fee cover, when was the last increase, and are there any pending special assessments or reserve-fund shortfalls?
- Why hasn't it sold? Are there any deal-killer items the seller is aware of (foundation, flood, title, zoning, code violations)?
- Is there a deadline driving the sale (1031 exchange, divorce, estate, relocation)? That informs how much negotiation room exists.
- Schools are F-rated, which usually means shorter tenancies and higher turnover. Who's the typical renter profile here, and what's been the actual vacancy rate?
- The area grade is low — what's the realistic commute time and amenity access for the typical tenant pool here? Any planned neighborhood developments (good or bad) we should know about?
- This sits on a lake — are riparian / water-frontage rights deeded with the parcel? Any dock permits, shoreline easements, or HOA water-use restrictions?
- What's the documented flood / surge / shoreline-erosion history here (FEMA AND non-FEMA — e.g., storm surge, creek backup, septic-field saturation)?
- Any water-quality or seasonal algae-bloom issues that affect tenant satisfaction or short-term-rental demand?
- What's the average days-on-market for RENTAL listings here right now (not sales)? A rising rental-DOM trend means longer vacancies and softer asking-rent achievability than the comps imply.
- What's the recent tenant-quality profile in this submarket — average credit score on applications, eviction rate, late-payment / NSF rate, and stable-employment percentage? A property-management company in the area should have these aggregated.
- How much new for-sale + rental construction is in the pipeline within 1–3 miles? Heavy new supply typically softens prices + rents 12–24 months out; constrained supply supports both.
Investment metrics
- 1% rule
- 0.85% ✗
- Cap rate
- 6.54%
- Cash-on-cash
- 0.86%
- DSCR
- 1.04
- GRM
- 9.8
CMA / ARV
- ARV (on-the-fly)
- $635,170
- Comps found
- 2
Show comp detail 2 sales within ~0.75 mi
| Address | Dist | Beds/Ba | Sqft | Sold | Price | $/sf | Match |
|---|---|---|---|---|---|---|---|
| 13770 SW 276th St | 0.19mi | 4/2.5 | 2,028 (0%) | 8mo | $392,000 | $193 | 82 |
| 14056 SW 272nd St | 0.20mi | 5/5.0 (+1) | 1,850 (-9%) | 18mo | $429,750 | $232 | 44 |
Match score weights: distance 35% · size 25% · config 20% · recency 20%. Top-matched comps best support the ARV.
Projected returns pro-forma
-3.0% appreciation · 0.0% rent growth · sell at horizon
- IRR
- -21.2%
- Equity multiple
- 0.29×
- Total profit
- $-74,946
- Equity at exit
- $55,914
- IRR
- -23.8%
- Equity multiple
- -0.02×
- Total profit
- $-107,518
- Equity at exit
- $32,423
Cash invested: $105,000 (down + closing). Projections, not guarantees.
Landlord ↔ Tenant lean methodology
- Overall (STATE)
- 87 Strongly Landlord-Friendly
- State Florida
- 87 Strongly Landlord-Friendly · R+3
- County
- — inherits STATE
- City
- — inherits STATE
ZIP-level market 33032
- Home prices YoY
- -29.8%
- Rents YoY
- -1.0%
- Active inventory
- 590
- Price-to-rent
- 9.8×
Monthly cashflow live
- Estimated rent
- $3,198 high interval (Pro) →
- Mortgage (P&I)
- −$1,967
- Tax from tax record
- −$120 /mo · $1,437/yr
- Insurance
- −$156
- Flood insurance flood zone
- −$152 /mo · $1,824/yr
- HOA
- −$208
- Vacancy / Maint / Mgmt
- −$672
- Net cashflow
- $-76
Break-even live
Sensitivity live
| Price | -10% $136 | -5% $30 | +0% $-76 | +5% $-183 | +10% $-289 |
|---|---|---|---|---|---|
| Rent | -10% $-329 | -5% $-203 | +0% $-76 | +5% $50 | +10% $176 |
| Rate | -1.0pp $112 | -0.5pp $19 | base $-76 | +0.5pp $-174 | +1.0pp $-272 |
UW: 25.0% down · 7.5% · 30yr · 1.5% tax · 5.0% vac · 8.0% maint · 8.0% mgmt
Financing live
Cash to close
- Down payment
- $93,750
- Closing costs
- $11,250
- Reserves months
- —
- Total cash needed
- —
Loan-product check · same deal, 3 products live
Conventional
25% down · 7.5% · 30yr
- Down + closing
- —
- Monthly P&I
- —
- Monthly cashflow
- —
- DSCR
- —
- Eligible?
- —
Personal DTI + credit; lowest rate.
DSCR
20% down · 8.5% · 30yr
- Down + closing
- —
- Monthly P&I
- —
- Monthly cashflow
- —
- DSCR
- —
- Eligible?
- —
No personal income docs; deal must DSCR.
Hard money
10% down · 12.0% · 12mo
- Down + closing
- —
- Monthly P&I
- —
- Monthly cashflow
- —
- DSCR
- —
- Eligible?
- —
Short-term bridge; refi at stabilization.
Rent comps 40 comps
| Address | Beds | Baths | Sqft | Rent | $/sqft | DOM | Units | Dist |
|---|---|---|---|---|---|---|---|---|
| 13849 SW 275th Ter Homestead, FL | 4.0 | 3.0 | 1837 | $2,650 | $1.44 | 24d | 1 | 0.06mi |
| 27432 SW 139th Pl Homestead, FL | 4.0 | 2.0 | 2611 | $3,800 | $1.46 | 26d | 1 | 0.08mi |
| 27501 SW 138th Ave Homestead, FL | 4.0 | 2.5 | 2028 | $2,800 | $1.38 | 24d | 1 | 0.12mi |
| 27433 SW 137th Ct Unit 1 Homestead, FL | 3.0 | 2.5 | 1679 | $2,550 | $1.52 | 26d | 1 | 0.14mi |
| 27433 SW 137th Ct Unit 1 Homestead, FL | 3.0 | 2.5 | 1679 | $2,550 | $1.52 | 10d | 1 | 0.14mi |
| 27424 SW 140th Ave Homestead, FL | 3.0 | 2.5 | 2799 | $3,205 | $1.15 | 15d | 1 | 0.17mi |
| 27424 SW 140th Ave Homestead, FL | 3.0 | 2.5 | 2799 | $3,205 | $1.15 | 1d | 1 | 0.17mi |
| 14044 SW 273rd Ln Unit 14044 Homestead, FL | 4.0 | 2.5 | 1850 | $2,900 | $1.57 | 26d | 1 | 0.21mi |
| 14050 SW 272nd St Homestead, FL | 3.0 | 2.5 | 1580 | $2,450 | $1.55 | 26d | 1 | 0.22mi |
| 14161 SW 276th St Homestead, FL | 3.0 | 2.5 | 1580 | $2,550 | $1.61 | 16d | 1 | 0.27mi |
| 14152 SW 276th St Homestead, FL | 4.0 | 2.5 | 2245 | $2,800 | $1.25 | 26d | 1 | 0.27mi |
| 27345 SW 142nd Ave Unit 27345 Homestead, FL | 3.0 | 2.5 | 1850 | $3,000 | $1.62 | 14d | 1 | 0.28mi |
| 13903 SW 279th Ln #13903 Homestead, FL | 3.0 | 2.5 | 1580 | $2,900 | $1.84 | 1d | 1 | 0.31mi |
| 13903 SW 279th Ln #13903 Homestead, FL | 3.0 | 2.5 | 1580 | $2,850 | $1.80 | 26d | 1 | 0.31mi |
| 13945 SW 279th Ln Unit 13945 Homestead, FL | 3.0 | 2.5 | 1580 | $3,100 | $1.96 | 26d | 1 | 0.34mi |
| 27568 SW 143rd Ave Unit 27568 Homestead, FL | 3.0 | 2.5 | 1580 | $2,500 | $1.58 | 5d | 1 | 0.35mi |
| 27918 SW 140th Ave Unit 27918 Homestead, FL | 3.0 | 2.5 | 1580 | $2,600 | $1.65 | 23d | 1 | 0.35mi |
| 27037 SW 142nd Ave Homestead, FL | 5.0 | 3.0 | 2799 | $3,500 | $1.25 | 26d | 1 | 0.37mi |
| 27440 SW 135th Avenue Rd Unit 27440 Naranja, FL | 3.0 | 3.0 | 1799 | $3,300 | $1.83 | 26d | 1 | 0.43mi |
| 27721 SW 134th Ct Homestead, FL | 3.0 | 2.0 | 1685 | $3,600 | $2.14 | 24d | 1 | 0.48mi |
| 28104 SW 135th Ave Homestead, FL | 3.0 | 2.0 | 1438 | $3,450 | $2.40 | 26d | 1 | 0.52mi |
| 27844 SW 133rd Path Homestead, FL | 3.0 | 2.0 | 1663 | $3,800 | $2.29 | 26d | 1 | 0.53mi |
| 26524 SW 138th Ave Unit 26524 Homestead, FL | 4.0 | 3.0 | 1604 | $2,800 | $1.75 | 26d | 1 | 0.58mi |
| 26514 SW 138th Ave Unit 26516 Homestead, FL | 3.0 | 2.0 | 2400 | $2,700 | $1.12 | 26d | 1 | 0.59mi |
| 27160 SW 132nd Court Rd Homestead, FL | 3.0 | 2.0 | 1977 | $3,300 | $1.67 | 26d | 1 | 0.60mi |
| 28364 SW 140th Pl Homestead, FL | 3.0 | 2.0 | 1427 | $2,550 | $1.79 | 1d | 1 | 0.62mi |
| 28037 SW 133rd Pl Homestead, FL | 3.0 | 2.0 | 1538 | $2,350 | $1.53 | 10d | 1 | 0.67mi |
| 13269 SW 278th St Unit 13269 Homestead, FL | 4.0 | 2.0 | 1492 | $3,250 | $2.18 | 26d | 1 | 0.67mi |
| 13233 SW 272nd St Homestead, FL | 3.0 | 2.0 | 2130 | $3,500 | $1.64 | 26d | 1 | 0.69mi |
| 13233 SW 272nd St Homestead, FL | 3.0 | 2.0 | 2130 | $3,500 | $1.64 | 23d | 1 | 0.69mi |
| 26925 SW 145th Ave Homestead, FL | 3.0 | 2.0 | 2073 | $3,100 | $1.50 | 5d | 1 | 0.71mi |
| 26925 SW 145th Ave Homestead, FL | 3.0 | 2.0 | 2073 | $3,100 | $1.50 | 24d | 1 | 0.71mi |
| 26964 SW 132 Ct Rd #0 Naranja, FL | 4.0 | 2.5 | 2980 | $3,900 | $1.31 | 1d | 1 | 0.71mi |
| 26964 SW 132 Ct Rd #0 Naranja, FL | 4.0 | 2.5 | 2980 | $4,000 | $1.34 | 19d | 1 | 0.71mi |
| 14515 SW 272nd St Unit 14515 Homestead, FL | 3.0 | 2.0 | 1431 | $3,200 | $2.24 | 26d | 1 | 0.72mi |
| 14519 SW 272nd St #14519 Naranja, FL | 3.0 | 2.0 | 1500 | $2,800 | $1.87 | 23d | 1 | 0.73mi |
| 25936 SW 139th Path #25936 Naranja, FL | 4.0 | 3.5 | 1434 | $2,300 | $1.60 | 26d | 1 | 0.75mi |
| 14280 SW 285th St Homestead, FL | 3.0 | 2.0 | 1500 | $3,200 | $2.13 | 26d | 1 | 0.77mi |
| 13201 SW 269th Ter Homestead, FL | 4.0 | 2.5 | 2944 | $3,700 | $1.26 | 26d | 1 | 0.78mi |
| 13417 SW 285th St #13417 Homestead, FL | 4.0 | 2.0 | 1833 | $3,325 | $1.81 | 10d | 1 | 0.80mi |
HOA detail
- Monthly dues
- $208 · $2,496/yr
- Likely covers
- water
Listing history 11 events
-
2026-05-20status Pending
-
2026-05-17status Active
-
2026-05-10status Pending
-
2026-04-30price $375,000
-
2026-04-16price $379,000
-
2026-03-18price $389,900
-
2026-02-18price $399,900
-
2026-02-11price $409,000
-
2026-01-05price $419,000
-
2025-11-10$429,000 Active
-
2008-06-23soldstatus $130,000 217-char remark
Show marketing remark (217 chars)
Corporate owned property! Absolutely beautiful 4 bedroom 2.5 bath. Quiet corner unit with waterfront (canal view). Beautiful tile floors and carpet in bedroom. Large master bedroom with double vanity in master bath. l
ⓘ Source: listings_history table (triggers on properties + properties_extension) + one-shot
backfill from property_details.listing_events for pre-trigger history.
Tax reassessment forecast FL · Resets to sale price
- Current annual tax
- $1,437 · $120/mo
- Projected year-2 tax
- $3,112 · $259/mo
- Expected delta
- +$1,675/yr (+$140/mo · 116.6%)
ⓘ Screening estimate from a state-policy table — verify with the county assessor before closing.
Climate risk First Street
- Flood 5/10 Major FEMA zone AH · 24% chance over 30 yrs
- Wildfire 1/10 Low
- Heat 10/10 Extreme 7 d/yr ≥105°F today · 32 d/yr by 30 yrs out
- Wind 10/10 Extreme 99% chance of damaging wind over 30 yrs
- Air quality 2/10 Low 1 unhealthy d/yr today · 1 by 30 yrs out
Nearby sold comps map
Loading sold comps map…
Walkable amenities ~0.75 mi
Loading nearby amenities…
Taxation est. · year 1
- Rental income
- $38,373
- − Mortgage interest
- −$21,006
- − Property taxes
- −$1,437
- − Insurance
- −$3,699
- − Repairs & maintenance
- −$3,070
- − Management
- −$3,070
- − HOA
- −$2,496
- − Depreciation
- −$10,909
- Taxable loss
- −$7,314
- Est. tax savings @ 24.0%
- +$1,755
- After-tax cash flow
- $839/yr
For passive investors: Depreciation is non-cash, so a rental often shows a tax loss while cash-flowing — sheltering income. Rental losses are passive: they offset passive income freely, and up to $25,000/yr can offset ordinary (W-2) income if you actively participate and your MAGI is under $100k (phasing out to $0 by $150k); unused losses carry forward. On sale, claimed depreciation is recaptured at up to 25%, and gains may owe capital-gains tax (a 1031 exchange can defer both). Figures are a year-1 estimate at your 24.0% rate — not tax advice; consult a CPA.
Schools (NCES district)
- District
- Miami-Dade
- NCES district ID
- 1200390
- Math proficiency
- 45% ▼ -16.00%
- Reading proficiency
- 54% ▼ -5.00%
- Median HH income
- $43,928
- Composite
- 41.76/100
- National rank
- #3397
- State rank
- #40 of 73 in FL
Livability — Naranja
- Score
- 65/100
- State rank
- #634
- US rank
- #12426
Category grades
Schools grade is shown separately in the Schools card above.
Census & demographics
- Census place
- Naranja, FL
- County
- Miami-Dade County · 2,697,751 people
- Metro
- Miami-Fort Lauderdale-Pompano Beach, FL
- Population (ZIP)
- 65,132
- Household income
- $73,429
- Rent vs Own
- Severe rent burden
- 3351.0
Population outlook (Miami-Dade County) Hauer SSP2
- Today (2025)
- 3,126,439 people
- By 2030
- 3,325,765 · +6.4%
- By 2040
- 3,697,561 · +18.3%
- By 2050
- 4,012,134 · +28.3%
- By 2075
- 4,605,612 · +47.3%
- By 2100
- 4,866,598 · +55.7%
Race, ethnicity, and origin ACS 2023
- Neighborhood character
- Predominantly Hispanic (68%)
- Race & ethnicity
- Hispanic / Latino 68% Two or more races 35% Black 20% White 10%
- Hispanic origin (detail)
- Mexican 3% Puerto Rican 5% Cuban 31% Dominican 5%
- Common ancestry
- Hispanic 3%
- Foreign-born
- 45% · Canada, Jamaica, Dominican Republic
- Languages at home
- 33% English-only · Spanish 64% French/Haitian/Cajun 2%
Political lean MEDSL · Miami-Dade
- 2024 margin
- R (+11.4) · D 43.9% · R 55.4%
- 2008→2024 swing
- -27.6pp toward R · 2008: 16.1pp · 2024: -11.4pp
- All cycles
- 2024: R+11.4 2020: D+7.3 2016: D+29.6 2012: D+23.7 2008: D+16.1
Not yet ingested
- Civics
- —
Market trends
- HPI YoY
- ▼ -176.52%
- Current HPI
- 415.9508
- Rent YoY
- ▼ -0.99%
- Metro
- Miami-Fort Lauderdale-Pompano Beach, FL
- State GDP YoY
- ▲ 3.28%
- F500 in state
- 36
Industry mix (Fortune 500 HQ in FL)
| Industry | F500 HQs | Revenue |
|---|---|---|
| Industrial Technology | 2 | $29B |
|
||
| Insurance | 2 | $17B |
|
||
| Retail | 1 | $60B |
|
||
| Technology Distribution | 1 | $58B |
|
||
| Homebuilding | 1 | $35B |
|
||
| Technology Manufacturing | 1 | $35B |
|
||
Price history
+188.5% since first listed11 events — show timeline
- 2026-05-20 Pending — MARMLS
- 2026-05-17 Relisted — MARMLS
- 2026-05-10 Pending — MARMLS
- 2026-04-30 Price Changed $375,000 MARMLS
- 2026-04-16 Price Changed $379,000 MARMLS
- 2026-03-18 Price Changed $389,900 MARMLS
- 2026-02-18 Price Changed $399,900 MARMLS
- 2026-02-11 Price Changed $409,000 MARMLS
- 2026-01-05 Price Changed $419,000 MARMLS
- 2025-11-10 Listed $429,000 MARMLS
- 2008-06-23 Sold (MLS) $130,000 MARMLS
Property tax history
+2.4%/yrLatest (2025): $1,437 · +2.7% YoY. Source: county tax records.
Cash-flow waterfall
monthlySold comps — $/sqft
last 12 mo · ≤1 miLoading sold comps…