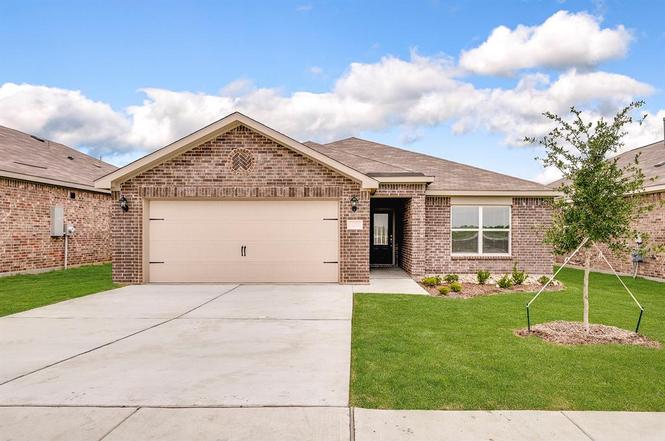
204 Julian Davis Dr · Venus, TX
Flood risk 1/10 · Minimal
- FEMA flood zone
- X (unshaded)
- Chance of flooding over 30 yrs
- 0.0%
- Est. flood insurance / yr
- $507 – $1,088
Fire risk 4/10 · Minor
- Est. fire insurance / yr
- $1,222 – $2,270
Heat risk 7/10 · Major
- Hot days now (above 110°F)
- 7 days/yr
- Hot days in 30 yrs
- 24 days/yr
Wind risk 6/10 · Moderate
- Chance of severe wind over 30 yrs
- 27.0%
Air-quality risk 2/10 · Minimal
- Unhealthy air days now
- 2 days/yr
- Unhealthy air days in 30 yrs
- 2 days/yr
Risk factors via First Street. Map © Google.
Why this score? — see what drove the D grade
The composite is a weighted blend of 9 inputs, each scored 0–100. Each bar is that input's sub-score; the figure is the points it added to the 100-point composite (weight × sub-score).
- Cash flow +10.8/30.0
- Appreciation +8.7/10.0
- ARV discount +7.5/15.0
- Livability +3.5/5.0
- DSCR +3.1/10.0
- Rent growth +3.1/5.0
- Schools +2.5/10.0
- Condition / age +2.5/5.0
- 1% rule +2.1/10.0
$292,900
🖨 Deal sheet 📄 Offer letter ✓ Due diligence
Listing remarks
Welcome to the Rio Grande, a thoughtfully designed floor plan that combines comfort, functionality, and style. The open-concept layout is perfect for everyday living, with a spacious primary suite that includes a private bath with a tub-shower combo and a generous walk-in closet. The beautifully appointed kitchen features sleek granite countertops, Whirlpool® appliances, and rich wood cabinetry, all part of our CompleteHome™ package that adds both elegance and efficiency. Step outside to a fully fenced backyard, offering the perfect space for grilling, relaxing, or play. Located just down the road from the community playground, gazebo, and private splashpad, this home offers the i
Key facts
- Rich wood cabinetry
- Whirlpool appliances
- Private bath
Tags
Neighborhood map
What this means for you Summary
Snapshot
- This is a 3-bed/2.0-bath land listed at $293k.
Deal economics
- At list price, monthly cash flow is $-133 ($-2k/yr) — negative.
- To cash-flow at today's rent, offer at most $269k (8.0% below list).
- To meet the 1% rule (rent ≥ 1% of price), the offer needs to be $207k (29.2% below list).
- Recommended offer: $207k (29.2% below list) — sets the bar for 1% rule.
- Cap rate 5.7% vs local median 3.0% in Venus — top-decile yield for the area; either an underpriced asset or a hidden risk that comps aren't pricing in. Stress-test before assuming the spread holds.
Location & tenants
- Location reads 70/100 on livability (#356 in TX) — a middle-class / working-renter tenant base. Strengths: crime A+, employment A+, cost of living A+; Watch: amenities F, commute F, health & safety F.
- Venus ISD (town): math 25% / reading 32% proficiency, ranked #646 of 826 in TX (top 78%) — low school quality limits family demand, transient renter base, plan for 1-2y turnover; 60% free/reduced lunch — lower-income household profile, screen leases tightly.
- Zoned schools: Venus El (math 27% / reading 30%, grade F, #2,706 of 4,322 statewide, top 63%, 658 students, 82% FRL) — zoned schools average 82% FRL vs 60% district-wide (22 pts higher); higher-poverty schools than district average — tighter screening recommended.
- Market conditions: Rents rising (+2.4%/yr); 426 active listings in the ZIP; 23 comparable units currently listed for rent nearby; rentals at typical pace (median 25d on market — plan ~3-4 weeks tenant-placement turnaround); 43% of comp listings sitting > 30 days — soft ceiling on asking rent; solid renter incomes; 2,152 units permitted in Johnson County in 2024 (76 in 5+ unit buildings).
Forward outlook
- In year one you build about $23k of equity ($2k loan paydown + $21k appreciation (7.3% local appreciation)).
- Johnson County population projected at +24% by 2050 — long-run rental-demand tailwind backs the buy-and-hold thesis.
- By year 2, paydown + projected appreciation supports a ~$38k cash-out refi (75% LTV) — recoverable capital for the next deal without selling this one.
Negotiation context
- It's been on market 44 days — a 3% lower offer ($284k) is reasonable based on typical stale-listing flexibility.
- 3 sale attempts with the ask held roughly flat each time — persistent listings suggest the price (not the market) is what's stuck; bring a comps-based counter.
Risks & watch-outs
- Climate carrying-cost: major wind risk, 27% chance of damaging wind over 30y; extreme-heat days projected 7→24/yr by 2055 (HVAC capex compounding) — expect insurance premiums to compound above CPI over the hold.
Questions for the listing agent
- What do current leases actually rent for vs. the listed asking? Can we see a recent rent roll and the last 12 months of T-12 income?
- It's been on market 44 days. Have you received any prior offers? Is the seller open to a 29% concession, seller financing, or rate buy-down credit?
- What does the HOA fee cover, when was the last increase, and are there any pending special assessments or reserve-fund shortfalls?
- Is there a deadline driving the sale (1031 exchange, divorce, estate, relocation)? That informs how much negotiation room exists.
- Schools are D-rated, which usually means shorter tenancies and higher turnover. Who's the typical renter profile here, and what's been the actual vacancy rate?
- The area grade is low — what's the realistic commute time and amenity access for the typical tenant pool here? Any planned neighborhood developments (good or bad) we should know about?
- What's the average days-on-market for RENTAL listings here right now (not sales)? A rising rental-DOM trend means longer vacancies and softer asking-rent achievability than the comps imply.
- What's the recent tenant-quality profile in this submarket — average credit score on applications, eviction rate, late-payment / NSF rate, and stable-employment percentage? A property-management company in the area should have these aggregated.
- How much new for-sale + rental construction is in the pipeline within 1–3 miles? Heavy new supply typically softens prices + rents 12–24 months out; constrained supply supports both.
Investment metrics
- 1% rule
- 0.71% ✗
- Cap rate
- 5.75%
- Cash-on-cash
- -1.95%
- DSCR
- 0.91
- GRM
- 11.8
CMA / ARV
No comps found within radius.
Projected returns pro-forma
7.32% appreciation · 2.39% rent growth · sell at horizon
- IRR
- 16.7%
- Equity multiple
- 2.20×
- Total profit
- $98,186
- Equity at exit
- $209,136
- IRR
- 16.0%
- Equity multiple
- 4.52×
- Total profit
- $288,480
- Equity at exit
- $402,977
Cash invested: $82,012 (down + closing). Projections, not guarantees.
Landlord ↔ Tenant lean methodology
- Overall (STATE)
- 87 Strongly Landlord-Friendly
- State Texas
- 87 Strongly Landlord-Friendly · R+5
- County
- — inherits STATE
- City
- — inherits STATE
ZIP-level market 76084
- Home prices YoY
- 2.1%
- Rents YoY
- 2.4%
- Active inventory
- 426
- Price-to-rent
- 11.8×
Monthly cashflow live
- Estimated rent
- $2,073 high interval (Pro) →
- Mortgage (P&I)
- −$1,536
- Tax from tax record
- −$76 /mo · $915/yr
- Insurance
- −$122
- HOA
- −$37
- Vacancy / Maint / Mgmt
- −$435
- Net cashflow
- $-133
Break-even live
UW: 25.0% down · 7.5% · 30yr · 1.5% tax · 5.0% vac · 8.0% maint · 8.0% mgmt
Financing live
Cash to close
- Down payment
- $73,225
- Closing costs
- $8,787
- Reserves months
- —
- Total cash needed
- —
Loan-product check · same deal, 3 products live
Conventional
25% down · 7.5% · 30yr
- Down + closing
- —
- Monthly P&I
- —
- Monthly cashflow
- —
- DSCR
- —
- Eligible?
- —
Personal DTI + credit; lowest rate.
DSCR
20% down · 8.5% · 30yr
- Down + closing
- —
- Monthly P&I
- —
- Monthly cashflow
- —
- DSCR
- —
- Eligible?
- —
No personal income docs; deal must DSCR.
Hard money
10% down · 12.0% · 12mo
- Down + closing
- —
- Monthly P&I
- —
- Monthly cashflow
- —
- DSCR
- —
- Eligible?
- —
Short-term bridge; refi at stabilization.
Rent comps 23 comps
| Address | Beds | Baths | Sqft | Rent | $/sqft | DOM | Units | Dist |
|---|---|---|---|---|---|---|---|---|
| 418 Watson Ct Venus, TX | 3.0 | 2.0 | 1379 | $2,210 | $1.60 | 43d | 1 | 0.12mi |
| 430 Gib Woodall Dr Venus, TX | 3.0 | 2.0 | 1379 | $2,000 | $1.45 | 3d | 1 | 0.21mi |
| 501 Gib Woodall Dr Venus, TX | 3.0 | 2.0 | 1218 | $1,945 | $1.60 | 43d | 1 | 0.26mi |
| 427 Condie Russell Ave Venus, TX | 3.0 | 2.0 | 1218 | $1,965 | $1.61 | 43d | 1 | 0.31mi |
| 201 John Laurens Dr Venus, TX | 3.0–5.0 | 2.0–2.5 | 1975 | $2,250 | $1.14 | 1d | 1 | 0.33mi |
| 645 Blackland Dr Venus, TX | 3.0 | 2.0 | 1361 | $1,950 | $1.43 | 43d | 1 | 0.44mi |
| 628 Blackland Dr Venus, TX | 4.0 | 2.5 | 1483 | $2,200 | $1.48 | 1d | 1 | 0.44mi |
| 656-660 Wheatfield DR Venus, TX | 3.0 | 2.0 | 1301 | $1,950 | $1.50 | 1d | 1 | 0.49mi |
| 663 Wheatfield Dr Venus, TX | 2.0 | 2.0 | 1274 | $1,695 | $1.33 | 1d | 1 | 0.50mi |
| 705 Wheatfield Dr Venus, TX | 2.0 | 1.5 | 1134 | $1,500 | $1.32 | 24d | 1 | 0.52mi |
| 723 Wheatfield Dr Venus, TX | 2.0 | 2.0 | 1274 | $1,695 | $1.33 | 43d | 1 | 0.53mi |
| 645 Fallow Dr Venus, TX | 3.0 | 2.0 | 1301 | $1,950 | $1.50 | 7d | 1 | 0.53mi |
| 733 Wheatfield Dr Venus, TX | 3.0 | 2.0 | 1347 | $1,795 | $1.33 | 24d | 1 | 0.55mi |
| 601 Harvest Moon Dr Venus, TX | 3.0 | 2.0 | 1347 | $1,795 | $1.33 | 43d | 1 | 0.55mi |
| 737 Wheatfield Dr Venus, TX | 2.0 | 1.5 | 1134 | $1,595 | $1.41 | 24d | 1 | 0.55mi |
| 729 Fallow Dr Venus, TX | 3.0 | 2.0 | 1301 | $1,995 | $1.53 | 43d | 1 | 0.57mi |
| 748 Wheatfield Dr Venus, TX | 3.0 | 2.0 | 1361 | $1,950 | $1.43 | 43d | 1 | 0.58mi |
| 620-616 Harvest Moon Dr Venus, TX | 3.0 | 2.0 | 1307 | $1,950 | $1.49 | 43d | 1 | 0.59mi |
| 704 Harvest Moon Dr Venus, TX | 3.0 | 2.0 | 1361 | $1,850 | $1.36 | 44d | 1 | 0.63mi |
| 712 Harvest Moon Dr Venus, TX | 3.0 | 2.0 | 1301 | $1,895 | $1.46 | 24d | 1 | 0.64mi |
| 261 Heritage Hills Pkwy Venus, TX | 1.0–3.0 | 1.0–2.0 | 912 | $2,305 | $2.53 | 1d | 1 | 0.69mi |
| 721 Harvest Moon Dr Venus, TX | 2.0 | 1.5 | 1134 | $1,595 | $1.41 | 1d | 1 | 0.70mi |
| 728 Fallow Dr Venus, TX | 3.0 | 2.0 | 1347 | $1,795 | $1.33 | 15d | 1 | 0.70mi |
HOA detail
- Monthly dues
- $37 · $444/yr
- Likely covers
- pool
Listing history 6 events
-
2026-03-06historical $2,120
-
2026-03-06status Pending
-
2026-01-21$292,900 Active
-
2026-01-15historical
-
2026-01-03$2,120
-
2025-12-10$292,900 Active
ⓘ Source: listings_history table (triggers on properties + properties_extension) + one-shot
backfill from property_details.listing_events for pre-trigger history.
Tax reassessment forecast TX · Resets to sale price
- Current annual tax
- $915 · $76/mo
- Projected year-2 tax
- $5,360 · $447/mo
- Expected delta
- +$4,445/yr (+$370/mo · 486.0%)
ⓘ Screening estimate from a state-policy table — verify with the county assessor before closing.
Climate risk First Street
- Flood 1/10 Low FEMA zone X (unshaded) · 0% chance over 30 yrs
- Wildfire 4/10 Moderate
- Heat 7/10 Severe 7 d/yr ≥110°F today · 24 d/yr by 30 yrs out
- Wind 6/10 Major 27% chance of damaging wind over 30 yrs
- Air quality 2/10 Low 2 unhealthy d/yr today · 2 by 30 yrs out
Nearby sold comps map
Loading sold comps map…
Walkable amenities ~0.75 mi
Loading nearby amenities…
Taxation est. · year 1
- Rental income
- $24,878
- − Mortgage interest
- −$16,407
- − Property taxes
- −$915
- − Insurance
- −$1,464
- − Repairs & maintenance
- −$1,990
- − Management
- −$1,990
- − HOA
- −$444
- − Depreciation
- −$8,521
- Taxable loss
- −$6,853
- Est. tax savings @ 24.0%
- +$1,645
- After-tax cash flow
- $44/yr
For passive investors: Depreciation is non-cash, so a rental often shows a tax loss while cash-flowing — sheltering income. Rental losses are passive: they offset passive income freely, and up to $25,000/yr can offset ordinary (W-2) income if you actively participate and your MAGI is under $100k (phasing out to $0 by $150k); unused losses carry forward. On sale, claimed depreciation is recaptured at up to 25%, and gains may owe capital-gains tax (a 1031 exchange can defer both). Figures are a year-1 estimate at your 24.0% rate — not tax advice; consult a CPA.
Schools (NCES district)
- District
- Venus ISD
- NCES district ID
- 4844010
- Math proficiency
- 25% ▼ -15.00%
- Reading proficiency
- 32% ▼ -2.00%
- Median HH income
- $50,394
- Composite
- 24.97/100
- National rank
- #7563
- State rank
- #646 of 826 in TX
Livability — Venus
- Score
- 70/100
- State rank
- #356
- US rank
- #7724
Category grades
Schools grade is shown separately in the Schools card above.
Census & demographics
- Census place
- Venus, TX
- County
- Johnson County · 147,987 people
- Metro
- Dallas-Fort Worth-Arlington, TX
- Population (ZIP)
- 14,097
- Household income
- $102,115
- Rent vs Own
- Severe rent burden
- 70.0
Population outlook (Johnson County) Hauer SSP2
- Today (2025)
- 179,678 people
- By 2030
- 189,208 · +5.3%
- By 2040
- 207,261 · +15.4%
- By 2050
- 223,064 · +24.1%
- By 2075
- 259,979 · +44.7%
- By 2100
- 275,395 · +53.3%
Race, ethnicity, and origin ACS 2023
- Neighborhood character
- Diverse neighborhood (Simpson 0.63)
- Race & ethnicity
- White 52% Hispanic / Latino 30% Two or more races 24% Black 11% Asian 1%
- Hispanic origin (detail)
- Mexican 25% Puerto Rican 1%
- Common ancestry
- Romanian 2% Lithuanian 1% Slovak 1%
- Foreign-born
- 8% · Canada
- Languages at home
- 78% English-only · Spanish 18% Arabic 1% French/Haitian/Cajun 1%
Political lean MEDSL · Johnson
- 2024 margin
- Solid R (+51.4) · D 23.9% · R 75.3%
- 2008→2024 swing
- -3.9pp toward R · 2008: -47.5pp · 2024: -51.4pp
- All cycles
- 2024: R+51.4 2020: R+53.0 2016: R+58.3 2012: R+55.6 2008: R+47.5
Not yet ingested
- Civics
- —
Market trends
- HPI YoY
- ▲ 7.32%
- Current HPI
- 355.74
- Rent YoY
- ▲ 2.39%
- Metro
- Dallas-Fort Worth-Arlington, TX
- State GDP YoY
- ▲ 3.95%
- F500 in state
- 110
Industry mix (Fortune 500 HQ in TX)
| Industry | F500 HQs | Revenue |
|---|---|---|
| Energy | 16 | $1,198B |
|
||
| Technology | 5 | $198B |
|
||
| Engineering / Construction | 4 | $72B |
|
||
| Energy Services | 3 | $60B |
|
||
| Utilities | 3 | $41B |
|
||
| Healthcare | 2 | $330B |
|
||
Price history
-99.3% since first listed6 events — show timeline
- 2026-03-06 Rental Removed $2,120 NTREIS
- 2026-03-06 Pending — NTREIS
- 2026-01-21 Listed $292,900 NTREIS
- 2026-01-15 Listing Removed — NTREIS
- 2026-01-03 Listed for Rent $2,120 NTREIS
- 2025-12-10 Listed $292,900 NTREIS
Property tax history
+7.5%/yrLatest (2025): $915 · +21.4% YoY. Source: county tax records.
Cash-flow waterfall
monthlySold comps — $/sqft
last 12 mo · ≤1 miLoading sold comps…