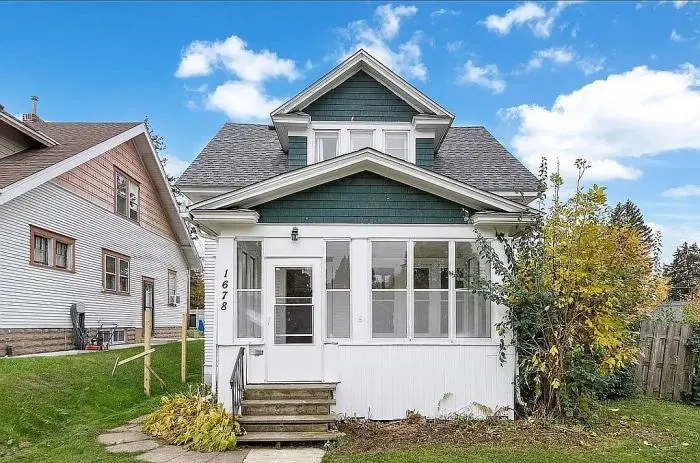
1678 Minnehaha Ave E · St. Paul, MN
Flood risk 1/10 · Minimal
- FEMA flood zone
- X (unshaded)
- Chance of flooding over 30 yrs
- 0.0%
- Est. flood insurance / yr
- $473 – $860
Fire risk 1/10 · Minimal
- Est. fire insurance / yr
- $888 – $1,650
Heat risk 2/10 · Minimal
- Hot days now (above 99°F)
- 7 days/yr
- Hot days in 30 yrs
- 14 days/yr
Wind risk 2/10 · Minimal
- Chance of severe wind over 30 yrs
- —
Air-quality risk 3/10 · Minor
- Unhealthy air days now
- 2 days/yr
- Unhealthy air days in 30 yrs
- 2 days/yr
Risk factors via First Street. Map © Google.
Why this score? — see what drove the F grade
The composite is a weighted blend of 9 inputs, each scored 0–100. Each bar is that input's sub-score; the figure is the points it added to the 100-point composite (weight × sub-score).
- Cash flow +7.5/30.0
- ARV discount +7.5/15.0
- Rent growth +4.1/5.0
- 1% rule +2.5/10.0
- Livability +2.5/5.0
- Condition / age +2.5/5.0
- Schools +2.4/10.0
- DSCR +1.6/10.0
- Appreciation +0.0/10.0
$185,000
🖨 Deal sheet (PDF) 📄 Offer letter ✓ Due diligence
Listing remarks MLS
Move-in ready and priced to sell! Updated appliances, flooring, and paint. Has a 1 car detached garage with an extra parking spot, potential opportunity to expand. Enjoy your morning cup of coffee on the front porch. Egress window in basement. Full bath in lower level and upstairs. Charming hardwoods in the second level. Schedule your showing today so you don’t miss out!
Key facts
- Updated appliances
- Front porch
- Egress window
Tags
Neighborhood map
What this means for you Summary
Snapshot
- This is a 2-bed/1.0-bath single-family listed at $185k.
Deal economics
- At list price, monthly cash flow is $-232 ($-3k/yr) — negative.
- To cash-flow at today's rent, offer at most $144k (22.2% below list).
- To meet the 1% rule (rent ≥ 1% of price), the offer needs to be $139k (24.7% below list).
- Recommended offer: $139k (24.7% below list) — sets the bar for 1% rule.
Location & tenants
- Location reads: area grade F — affects rentability + tenant quality, not the cash-flow math above.
- St. Paul Public School District (urban): math 21% / reading 33% proficiency, ranked #270 of 301 in MN (top 90%) — low school quality limits family demand, transient renter base, plan for 1-2y turnover; 64% free/reduced lunch — lower-income household profile, screen leases tightly.
- Market conditions: Rents rising fast (+6.3%/yr); 254 active listings in the ZIP; 1 comparable units currently listed for rent nearby; 1,202 units permitted in Ramsey County in 2024 (880 in 5+ unit buildings).
Forward outlook
- Local home prices are declining (-3.0%/yr); year-one equity from $1k of loan paydown is wiped out by about $6k of value loss. Plan a longer hold.
- Ramsey County population projected at +27% by 2050 — long-run rental-demand tailwind backs the buy-and-hold thesis.
Negotiation context
- It's been on market 70 days — a 6% lower offer ($174k) is reasonable based on typical stale-listing flexibility.
- 10 sale attempts with the ask held roughly flat each time — persistent listings suggest the price (not the market) is what's stuck; bring a comps-based counter.
Risks & watch-outs
- Watch-outs: built in 1918 — expect roof / HVAC / electrical / plumbing capex.
Questions for the listing agent
- What do current leases actually rent for vs. the listed asking? Can we see a recent rent roll and the last 12 months of T-12 income?
- It's been on market 70 days. Have you received any prior offers? Is the seller open to a 25% concession, seller financing, or rate buy-down credit?
- Built in 1918 — when were the roof, HVAC, electrical panel, plumbing, and water heater last replaced?
- Why hasn't it sold? Are there any deal-killer items the seller is aware of (foundation, flood, title, zoning, code violations)?
- Is there a deadline driving the sale (1031 exchange, divorce, estate, relocation)? That informs how much negotiation room exists.
- The area grade is low — what's the realistic commute time and amenity access for the typical tenant pool here? Any planned neighborhood developments (good or bad) we should know about?
- What's the average days-on-market for RENTAL listings here right now (not sales)? A rising rental-DOM trend means longer vacancies and softer asking-rent achievability than the comps imply.
- What's the recent tenant-quality profile in this submarket — average credit score on applications, eviction rate, late-payment / NSF rate, and stable-employment percentage? A property-management company in the area should have these aggregated.
- How much new for-sale + rental construction is in the pipeline within 1–3 miles? Heavy new supply typically softens prices + rents 12–24 months out; constrained supply supports both.
Investment metrics
- 1% rule
- 0.75% ✗
- Cap rate
- 4.79%
- Cash-on-cash
- -5.38%
- DSCR
- 0.76
- GRM
- 11.1
CMA / ARV
No comps found within radius.
Projected returns pro-forma
-3.0% appreciation · 6.26% rent growth · sell at horizon
- IRR
- -21.7%
- Equity multiple
- 0.23×
- Total profit
- $-39,993
- Equity at exit
- $27,584
- IRR
- -9.0%
- Equity multiple
- 0.36×
- Total profit
- $-32,937
- Equity at exit
- $15,995
Cash invested: $51,800 (down + closing). Projections, not guarantees.
Landlord ↔ Tenant lean methodology
- Overall (STATE)
- 46 Balanced
- State Minnesota
- 46 Balanced · D+2
- County
- — inherits STATE
- City
- — inherits STATE
ZIP-level market 55106
- Rents YoY
- 6.3%
- Active inventory
- 254
- Price-to-rent
- 11.1×
Monthly cashflow live
- Estimated rent
- $1,393 medium interval (Pro) →
- Mortgage (P&I)
- −$970
- Tax from tax record
- −$286 /mo · $3,428/yr
- Insurance
- −$77
- HOA
- −$0
- Vacancy / Maint / Mgmt
- −$293
- Net cashflow
- $-232
Break-even live
Sensitivity live
| Price | -10% $-127 | -5% $-180 | +0% $-232 | +5% $-285 | +10% $-337 |
|---|---|---|---|---|---|
| Rent | -10% $-342 | -5% $-287 | +0% $-232 | +5% $-177 | +10% $-122 |
| Rate | -1.0pp $-139 | -0.5pp $-185 | base $-232 | +0.5pp $-280 | +1.0pp $-329 |
UW: 25.0% down · 7.5% · 30yr · 1.5% tax · 5.0% vac · 8.0% maint · 8.0% mgmt
Financing live
Cash to close
- Down payment
- $46,250
- Closing costs
- $5,550
- Reserves months
- —
- Total cash needed
- —
Loan-product check · same deal, 3 products live
Conventional
25% down · 7.5% · 30yr
- Down + closing
- —
- Monthly P&I
- —
- Monthly cashflow
- —
- DSCR
- —
- Eligible?
- —
Personal DTI + credit; lowest rate.
DSCR
20% down · 8.5% · 30yr
- Down + closing
- —
- Monthly P&I
- —
- Monthly cashflow
- —
- DSCR
- —
- Eligible?
- —
No personal income docs; deal must DSCR.
Hard money
10% down · 12.0% · 12mo
- Down + closing
- —
- Monthly P&I
- —
- Monthly cashflow
- —
- DSCR
- —
- Eligible?
- —
Short-term bridge; refi at stabilization.
Rent comps 1 comps
| Address | Beds | Baths | Sqft | Rent | $/sqft | DOM | Units | Dist |
|---|---|---|---|---|---|---|---|---|
| 1950 Burns Ave St Paul, MN | 1.0–3.0 | 1.0–2.0 | 1118 | $1,712 | $1.53 | 0d | 26 | 1.20mi |
Listing history 42 events
-
2026-06-21days on market $185,000 Active 70 DOM
-
2026-06-18days on market $185,000 Active 67 DOM
-
2026-06-17days on market $185,000 Active 66 DOM
-
2026-06-16days on market $185,000 Active 65 DOM
-
2026-06-15days on market $185,000 Active 64 DOM
-
2026-06-13days on market $185,000 Active 62 DOM
-
2026-06-09days on market $185,000 Active 58 DOM
-
2026-06-08days on market $185,000 Active 57 DOM
-
2026-06-07days on market $185,000 Active 56 DOM
-
2026-06-04days on market $185,000 Active 53 DOM
-
2026-06-03days on market $185,000 Active 52 DOM
-
2026-06-02days on market $185,000 Active 51 DOM
-
2026-06-01days on market $185,000 Active 50 DOM
-
2026-05-31days on market $185,000 Active 49 DOM
-
2026-04-20$189,000 Active
-
2026-04-08$185,000 Active 379-char remark
Show marketing remark (379 chars)
Move-in ready and priced to sell! Updated appliances, flooring, and paint. Has a 1 car detached garage with an extra parking spot, potential opportunity to expand. Enjoy your morning cup of coffee on the front porch. Egress window in basement. Full bath in lower level and upstairs. Charming hardwoods in the second level. Schedule your showing today so you don’t miss out!
-
2026-02-12historical
-
2026-02-12historical
-
2025-12-08historical Contingent - Other
-
2025-12-08historical Contingent
-
2025-12-02price $185,000
-
2025-12-01price $185,000
-
2025-11-19status Active
-
2025-11-19status Active
-
2025-11-18historical Contingent
-
2025-11-18historical Contingent - Inspection
-
2025-11-13status Active
-
2025-11-13status Active
-
2025-11-07status Pending
-
2025-11-07status Pending
-
2025-11-04historical Contingent
-
2025-11-04historical Contingent - Inspection
-
2025-11-01$189,900 Active
-
2025-11-01$189,900 Active
-
2025-08-02price $212,500
-
2025-07-10price $232,900
-
2025-07-03price $235,000
-
2025-06-23soldstatus $199,000
-
2025-06-19$237,500 Active
-
2025-06-11historical
-
2025-05-26price $235,700
-
2025-05-20$239,900 Active
ⓘ Source: listings_history table (triggers on properties + properties_extension) + one-shot
backfill from property_details.listing_events for pre-trigger history.
Tax reassessment forecast MN · Partial reset (capped growth)
- Current annual tax
- $3,428 · $286/mo
- Projected year-2 tax
- $3,428 · $286/mo
- Expected delta
- $0/yr ($0/mo · 0.0%)
ⓘ Screening estimate from a state-policy table — verify with the county assessor before closing.
Climate risk First Street
- Flood 1/10 Low FEMA zone X (unshaded) · 0% chance over 30 yrs
- Wildfire 1/10 Low
- Heat 2/10 Low 7 d/yr ≥99°F today · 14 d/yr by 30 yrs out
- Wind 2/10 Low
- Air quality 3/10 Moderate 2 unhealthy d/yr today · 2 by 30 yrs out
Nearby sold comps map
Loading sold comps map…
Walkable amenities ~0.75 mi
Loading nearby amenities…
Taxation est. · year 1
- Rental income
- $16,720
- − Mortgage interest
- −$10,363
- − Property taxes
- −$3,428
- − Insurance
- −$925
- − Repairs & maintenance
- −$1,338
- − Management
- −$1,338
- − Depreciation
- −$5,382
- Taxable loss
- −$6,053
- Est. tax savings @ 24.0%
- +$1,453
- After-tax cash flow
- $-1,334/yr
For passive investors: Depreciation is non-cash, so a rental often shows a tax loss while cash-flowing — sheltering income. Rental losses are passive: they offset passive income freely, and up to $25,000/yr can offset ordinary (W-2) income if you actively participate and your MAGI is under $100k (phasing out to $0 by $150k); unused losses carry forward. On sale, claimed depreciation is recaptured at up to 25%, and gains may owe capital-gains tax (a 1031 exchange can defer both). Figures are a year-1 estimate at your 24.0% rate — not tax advice; consult a CPA.
Schools (NCES district)
- District
- St. Paul Public School District
- NCES district ID
- 2733840
- Math proficiency
- 21% ▼ -11.00%
- Reading proficiency
- 33% ▼ -7.00%
- Median HH income
- $48,316
- Composite
- 23.51/100
- National rank
- #7868
- State rank
- #270 of 301 in MN
Livability — St. Paul
No livability data for this city. (Only ~50 U.S. cities are tracked.)
Census & demographics
- Census place
- St. Paul, MN
- County
- Ramsey County · 542,837 people
- City population
- 280,599
- Metro
- Minneapolis-St. Paul-Bloomington, MN-WI
- Population (ZIP)
- 56,708
- Household income
- $70,187
- Rent vs Own
- Severe rent burden
- 2046.0
Population outlook (Ramsey County) Hauer SSP2
- Today (2025)
- 603,431 people
- By 2030
- 636,459 · +5.5%
- By 2040
- 700,596 · +16.1%
- By 2050
- 765,819 · +26.9%
- By 2075
- 929,297 · +54.0%
- By 2100
- 1,053,924 · +74.7%
Race, ethnicity, and origin ACS 2023
- Neighborhood character
- Highly diverse neighborhood (Simpson 0.75)
- Race & ethnicity
- Asian 34% White 32% Black 15% Hispanic / Latino 11% Two or more races 10%
- Hispanic origin (detail)
- Mexican 8%
- Common ancestry
- Portuguese 4% Lithuanian 2% Romanian 2%
- Foreign-born
- 25% · Canada, Philippines, Vietnam
- Languages at home
- 59% English-only · Other Asian/Pacific 27% Spanish 9% French/Haitian/Cajun 1%
Political lean MEDSL · Ramsey
- 2024 margin
- Solid D (+43.3) · D 70.5% · R 27.2% · Other 2.3%
- 2008→2024 swing
- +9.4pp toward D · 2008: 33.9pp · 2024: 43.3pp
- All cycles
- 2024: D+43.3 2020: D+45.4 2016: D+39.4 2012: D+35.3 2008: D+33.9
Not yet ingested
- Civics
- —
Market trends
- HPI YoY
- ▼ -239.48%
- Current HPI
- 288.7205
- Rent YoY
- ▲ 6.26%
- Metro
- Minneapolis-St. Paul-Bloomington, MN-WI
- State GDP YoY
- ▲ 2.41%
- F500 in state
- 34
Industry mix (Fortune 500 HQ in MN)
| Industry | F500 HQs | Revenue |
|---|---|---|
| Healthcare | 2 | $407B |
|
||
| Retail | 2 | $150B |
|
||
| Consumer Goods | 2 | $32B |
|
||
| Industrial Machinery | 2 | $6B |
|
||
| Agriculture | 1 | $40B |
|
||
| Healthcare / Medical Devices | 1 | $32B |
|
||
Price history
-21.2% since first listed28 events — show timeline
- 2026-04-20 Listed $189,000 NORTHSTARMLS as Distributed by MLS Grid
- 2026-04-08 Listed $185,000 Fizber.com
- 2026-02-12 Listing Removed — RANWW
- 2026-02-12 Listing Removed — NORTHSTARMLS as Distributed by MLS Grid
- 2025-12-08 Contingent — NORTHSTARMLS as Distributed by MLS Grid
- 2025-12-08 Contingent — RANWW
- 2025-12-02 Price Changed $185,000 RANWW
- 2025-12-01 Price Changed $185,000 NORTHSTARMLS as Distributed by MLS Grid
- 2025-11-19 Relisted — RANWW
- 2025-11-19 Relisted — NORTHSTARMLS as Distributed by MLS Grid
- 2025-11-18 Contingent — RANWW
- 2025-11-18 Contingent — NORTHSTARMLS as Distributed by MLS Grid
- 2025-11-13 Relisted — RANWW
- 2025-11-13 Relisted — NORTHSTARMLS as Distributed by MLS Grid
- 2025-11-07 Pending — RANWW
- 2025-11-07 Pending — NORTHSTARMLS as Distributed by MLS Grid
- 2025-11-04 Contingent — RANWW
- 2025-11-04 Contingent — NORTHSTARMLS as Distributed by MLS Grid
- 2025-11-01 Listed $189,900 NORTHSTARMLS as Distributed by MLS Grid
- 2025-11-01 Listed $189,900 RANWW
- 2025-08-02 Price Changed $212,500 NORTHSTARMLS as Distributed by MLS Grid
- 2025-07-10 Price Changed $232,900 NORTHSTARMLS as Distributed by MLS Grid
- 2025-07-03 Price Changed $235,000 NORTHSTARMLS as Distributed by MLS Grid
- 2025-06-23 Sold (Public Records) $199,000 Public Records
- 2025-06-19 Listed $237,500 NORTHSTARMLS as Distributed by MLS Grid
- 2025-06-11 Listing Removed — NORTHSTARMLS as Distributed by MLS Grid
- 2025-05-26 Price Changed $235,700 NORTHSTARMLS as Distributed by MLS Grid
- 2025-05-20 Listed $239,900 NORTHSTARMLS as Distributed by MLS Grid
Property tax history
+6.7%/yrLatest (2025): $3,428 · +17.1% YoY. Source: county tax records.
Cash-flow waterfall
monthlySold comps — $/sqft
last 12 mo · ≤1 miLoading sold comps…