127 University Blvd Unit 127 & 129 · Toledo, OH
Flood risk 1/10 · Minimal
- FEMA flood zone
- X (unshaded)
- Chance of flooding over 30 yrs
- 0.0%
- Est. flood insurance / yr
- $473 – $860
Fire risk 1/10 · Minimal
- Est. fire insurance / yr
- $713 – $1,323
Heat risk 3/10 · Minor
- Hot days now (above 101°F)
- 7 days/yr
- Hot days in 30 yrs
- 16 days/yr
Wind risk 2/10 · Minimal
- Chance of severe wind over 30 yrs
- —
Air-quality risk 2/10 · Minimal
- Unhealthy air days now
- 1 days/yr
- Unhealthy air days in 30 yrs
- 2 days/yr
Risk factors via First Street. Map © Google.
Why this score? — see what drove the F grade
The composite is a weighted blend of 9 inputs, each scored 0–100. Each bar is that input's sub-score; the figure is the points it added to the 100-point composite (weight × sub-score).
- ARV discount +7.5/15.0
- Cash flow +6.2/30.0
- Rent growth +4.5/5.0
- Livability +3.3/5.0
- Condition / age +2.2/5.0
- Schools +1.6/10.0
- 1% rule +1.4/10.0
- DSCR +0.5/10.0
- Appreciation +0.0/10.0
$214,900
🖨 Deal sheet (PDF) 📄 Offer letter ✓ Due diligence
Listing remarks MLS
Well maintained duplex in Harvard Terrace. Stable rental history. Garage parking. Great investment opportunity! Don't miss out!
Key facts
- 6,200 sq ft lot
- 2 garage spots
- Built 1907
Neighborhood map
What this means for you Summary
Snapshot
- This is a 4-bed/2.0-bath condo listed at $215k. Condition is rated fair.
Deal economics
- At list price, monthly cash flow is $-392 ($-5k/yr) — negative.
- To cash-flow at today's rent, offer at most $158k (26.4% below list).
- To meet the 1% rule (rent ≥ 1% of price), the offer needs to be $138k (35.6% below list).
- Recommended offer: $138k (35.6% below list) — sets the bar for 1% rule.
- Cap rate 4.1% vs local median 7.6% in Toledo — below-typical yield; the buyer is paying a premium for something (appreciation thesis, condition, location) that the cap rate doesn't capture.
Location & tenants
- Location reads 66/100 on livability (#645 in OH) — a middle-class / working-renter tenant base. Strengths: cost of living A+, housing A+, health & safety A+; Watch: amenities C-, schools D-, crime F.
- Toledo City (urban): math 15% / reading 24% proficiency, ranked #634 of 656 in OH (top 97%) — low school quality limits family demand, transient renter base, plan for 1-2y turnover; 72% free/reduced lunch — lower-income household profile, screen leases tightly.
- Market conditions: Rents rising fast (+8.0%/yr); 71 active listings in the ZIP; 14 comparable units currently listed for rent nearby; rentals lingering (median 45d on market — plan ~5-8 weeks vacancy on turnover, expect pricing pressure); 50% of comp listings sitting > 30 days — soft ceiling on asking rent; 415 units permitted in Lucas County in 2024 (122 in 5+ unit buildings).
Forward outlook
- Local home prices are declining (-3.0%/yr); year-one equity from $1k of loan paydown is wiped out by about $6k of value loss. Plan a longer hold.
- Lucas County population projected at -16% by 2050 — secular population decline; favor cash flow + early exit over multi-decade hold.
Negotiation context
- It's been on market 247 days — a 12% lower offer ($189k) is reasonable based on typical stale-listing flexibility.
Risks & watch-outs
- Watch-outs: built in 1907 — expect roof / HVAC / electrical / plumbing capex.
Questions for the listing agent
- What do current leases actually rent for vs. the listed asking? Can we see a recent rent roll and the last 12 months of T-12 income?
- It's been on market 247 days. Have you received any prior offers? Is the seller open to a 36% concession, seller financing, or rate buy-down credit?
- Have any recent inspections been done? Can we get a copy of the seller's disclosures and any deferred-maintenance estimates?
- Built in 1907 — when were the roof, HVAC, electrical panel, plumbing, and water heater last replaced?
- Any open or pending special assessments — roof, HVAC, plumbing, elevator, façade? What's the per-unit balance and payoff schedule, and is the seller paying it off at close or rolling it to the buyer?
- Why hasn't it sold? Are there any deal-killer items the seller is aware of (foundation, flood, title, zoning, code violations)?
- Is there a deadline driving the sale (1031 exchange, divorce, estate, relocation)? That informs how much negotiation room exists.
- Schools are D-rated, which usually means shorter tenancies and higher turnover. Who's the typical renter profile here, and what's been the actual vacancy rate?
- Crime grade is F in this area — have there been break-ins, vandalism, or insurance claims at this property in the last 3 years? What carrier currently insures it and at what premium?
- The area grade is low — what's the realistic commute time and amenity access for the typical tenant pool here? Any planned neighborhood developments (good or bad) we should know about?
- What's the average days-on-market for RENTAL listings here right now (not sales)? A rising rental-DOM trend means longer vacancies and softer asking-rent achievability than the comps imply.
- What's the recent tenant-quality profile in this submarket — average credit score on applications, eviction rate, late-payment / NSF rate, and stable-employment percentage? A property-management company in the area should have these aggregated.
- How much new apartment / multifamily construction is in the pipeline within 1–3 miles? Heavy new supply (>2% of stock underway) typically softens rents 12–24 months out; light construction supports rent growth.
Investment metrics
- 1% rule
- 0.64% ✗
- Cap rate
- 4.10%
- Cash-on-cash
- -7.82%
- DSCR
- 0.65
- GRM
- 12.9
CMA / ARV
No comps found within radius.
Projected returns pro-forma
-3.0% appreciation · 8.0% rent growth · sell at horizon
- IRR
- -24.6%
- Equity multiple
- 0.13×
- Total profit
- $-52,451
- Equity at exit
- $32,042
- IRR
- -10.0%
- Equity multiple
- 0.26×
- Total profit
- $-44,446
- Equity at exit
- $18,581
Cash invested: $60,172 (down + closing). Projections, not guarantees.
Landlord ↔ Tenant lean methodology
- Overall (STATE)
- 73 Landlord-Friendly
- State Ohio
- 73 Landlord-Friendly · R+6
- County
- — inherits STATE
- City
- — inherits STATE
ZIP-level market 43614
- Home prices YoY
- -22.4%
- Rents YoY
- 8.0%
- Active inventory
- 71
- Price-to-rent
- 12.9×
Monthly cashflow live
- Estimated rent
- $1,384 high interval (Pro) →
- Mortgage (P&I)
- −$1,127
- Tax est. 1.5%
- −$269 /mo · $3,224/yr
- Insurance
- −$90
- HOA
- −$0
- Vacancy / Maint / Mgmt
- −$291
- Net cashflow
- $-392
Break-even live
Sensitivity live
| Price | -10% $-243 | -5% $-318 | +0% $-392 | +5% $-466 | +10% $-540 |
|---|---|---|---|---|---|
| Rent | -10% $-501 | -5% $-447 | +0% $-392 | +5% $-337 | +10% $-283 |
| Rate | -1.0pp $-284 | -0.5pp $-337 | base $-392 | +0.5pp $-448 | +1.0pp $-504 |
UW: 25.0% down · 7.5% · 30yr · 1.5% tax · 5.0% vac · 8.0% maint · 8.0% mgmt
Financing live
Cash to close
- Down payment
- $53,725
- Closing costs
- $6,447
- Reserves months
- —
- Total cash needed
- —
Loan-product check · same deal, 3 products live
Conventional
25% down · 7.5% · 30yr
- Down + closing
- —
- Monthly P&I
- —
- Monthly cashflow
- —
- DSCR
- —
- Eligible?
- —
Personal DTI + credit; lowest rate.
DSCR
20% down · 8.5% · 30yr
- Down + closing
- —
- Monthly P&I
- —
- Monthly cashflow
- —
- DSCR
- —
- Eligible?
- —
No personal income docs; deal must DSCR.
Hard money
10% down · 12.0% · 12mo
- Down + closing
- —
- Monthly P&I
- —
- Monthly cashflow
- —
- DSCR
- —
- Eligible?
- —
Short-term bridge; refi at stabilization.
Rent comps 14 comps
| Address | Beds | Baths | Sqft | Rent | $/sqft | DOM | Units | Dist |
|---|---|---|---|---|---|---|---|---|
| 2802 Broadway St Unit 1 Toledo, OH | 3.0 | 1.0 | 1650 | $1,400 | $0.85 | 14d | 1 | 0.08mi |
| 825 Brighton Ave Toledo, OH | 3.0 | 1.0 | 1533 | $1,350 | $0.88 | 44d | 1 | 0.64mi |
| 2424 Broadway St Toledo, OH | 3.0 | 1.0 | 1416 | $1,049 | $0.74 | 14d | 1 | 0.80mi |
| 1309 Corry Ave Toledo, OH | 3.0 | 1.0 | — | $1,300 | — | 24d | 1 | 0.82mi |
| 724 Spencer St Toledo, OH | 3.0 | 1.5 | 1127 | $1,100 | $0.98 | 44d | 1 | 0.82mi |
| 1510 Watova Rd Toledo, OH | 3.0 | 1.0 | 1197 | $1,495 | $1.25 | 22d | 1 | 0.95mi |
| 532 Carlton St Toledo, OH | 3.0 | 1.0 | 1130 | $1,050 | $0.93 | 44d | 1 | 1.00mi |
| 523 Nicholas St Toledo, OH | 3.0 | 1.0 | 1290 | $1,350 | $1.05 | 14d | 1 | 1.00mi |
| 1418 Colburn St Toledo, OH | 3.0 | 1.0 | 992 | $1,200 | $1.21 | 14d | 1 | 1.07mi |
| 1127 Harding Dr Toledo, OH | 3.0 | 1.0 | — | $1,125 | — | 44d | 1 | 1.09mi |
| 1321 Gordon St Toledo, OH | 3.0 | 1.0 | 1121 | $1,050 | $0.94 | 44d | 1 | 1.34mi |
| 569 Colima Dr Toledo, OH | 3.0 | 1.0 | 1253 | $1,300 | $1.04 | 24d | 1 | 1.36mi |
| 619 Durango Dr Toledo, OH | 3.0 | 1.0 | 1276 | $1,350 | $1.06 | 44d | 1 | 1.36mi |
| 1021 Walbridge Ave Toledo, OH | 3.0 | 1.0 | 1592 | $975 | $0.61 | 44d | 1 | 1.45mi |
HOA detail condo
- Monthly dues
- $0 · $0/yr
- Assessments
- None detected in remarks — confirm with the listing agent.
Listing history 18 events
-
2026-06-18days on market $214,900 Active 247 DOM
-
2026-06-17days on market $214,900 Active 246 DOM
-
2026-06-16days on market $214,900 Active 245 DOM
-
2026-06-15days on market $214,900 Active 244 DOM
-
2026-06-14days on market $214,900 Active 242 DOM
-
2026-06-10days on market $214,900 Active 239 DOM
-
2026-06-09days on market $214,900 Active 238 DOM
-
2026-06-08days on market $214,900 Active 237 DOM
-
2026-06-07days on market $214,900 Active 236 DOM
-
2026-06-05days on market $214,900 Active 233 DOM
-
2026-06-03days on market $214,900 Active 232 DOM
-
2026-06-02days on market $214,900 Active 231 DOM
-
2026-06-01days on market $214,900 Active 230 DOM
-
2026-05-31days on market $214,900 Active 229 DOM
-
2026-05-30days on market $214,900 Active 228 DOM
-
2026-02-26price $214,900 131-char remark
Show marketing remark (131 chars)
Well maintained duplex in Harvard Terrace. Stable rental history. Garage parking. Great investment opportunity! Don't miss out!
-
2025-11-05price $219,900 131-char remark
Show marketing remark (131 chars)
Well maintained duplex in Harvard Terrace. Stable rental history. Garage parking. Great investment opportunity! Don't miss out!
-
2025-10-13$224,900 Active 131-char remark
Show marketing remark (131 chars)
Well maintained duplex in Harvard Terrace. Stable rental history. Garage parking. Great investment opportunity! Don't miss out!
ⓘ Source: listings_history table (triggers on properties + properties_extension) + one-shot
backfill from property_details.listing_events for pre-trigger history.
Climate risk First Street
- Flood 1/10 Low FEMA zone X (unshaded) · 0% chance over 30 yrs
- Wildfire 1/10 Low
- Heat 3/10 Moderate 7 d/yr ≥101°F today · 16 d/yr by 30 yrs out
- Wind 2/10 Low
- Air quality 2/10 Low 1 unhealthy d/yr today · 2 by 30 yrs out
Nearby sold comps map
Loading sold comps map…
Walkable amenities ~0.75 mi
Loading nearby amenities…
Taxation est. · year 1
- Rental income
- $16,606
- − Mortgage interest
- −$12,038
- − Property taxes
- −$3,224
- − Insurance
- −$1,074
- − Repairs & maintenance
- −$1,328
- − Management
- −$1,328
- − Depreciation
- −$6,252
- Taxable loss
- −$8,639
- Est. tax savings @ 24.0%
- +$2,073
- After-tax cash flow
- $-2,630/yr
For passive investors: Depreciation is non-cash, so a rental often shows a tax loss while cash-flowing — sheltering income. Rental losses are passive: they offset passive income freely, and up to $25,000/yr can offset ordinary (W-2) income if you actively participate and your MAGI is under $100k (phasing out to $0 by $150k); unused losses carry forward. On sale, claimed depreciation is recaptured at up to 25%, and gains may owe capital-gains tax (a 1031 exchange can defer both). Figures are a year-1 estimate at your 24.0% rate — not tax advice; consult a CPA.
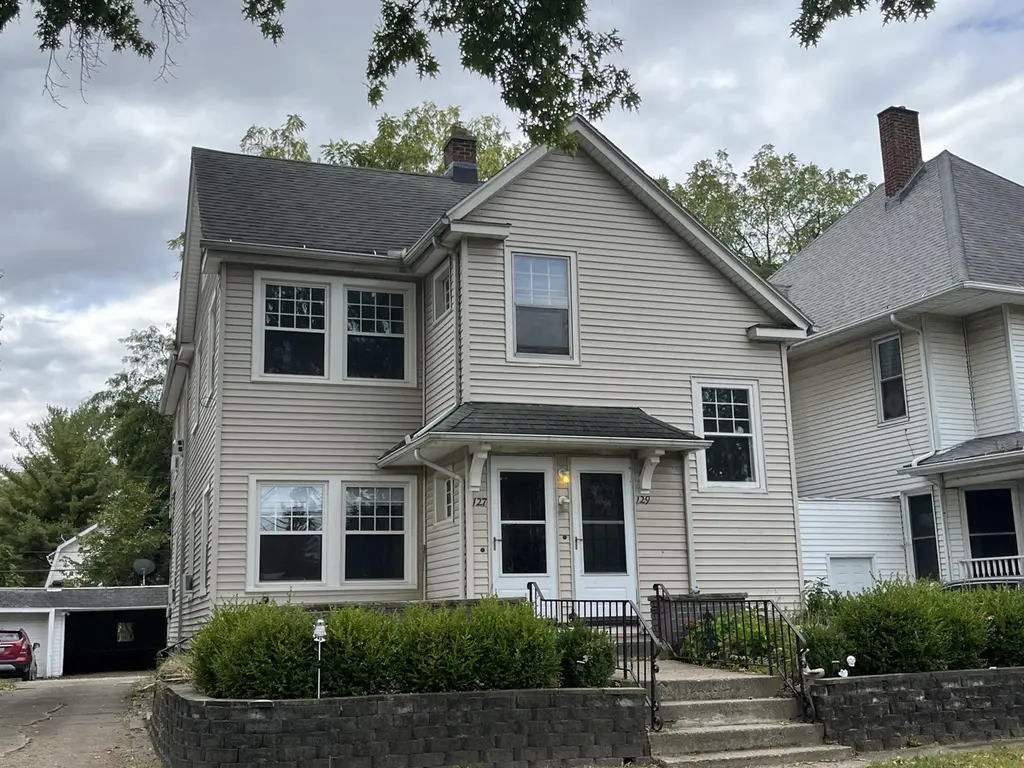
Condition & rehab AI · 6 photos
A fair condition, moderate rehab needed to improve curb appeal and value. Consider painting and trimming for a better look.
Repairs flagged
- Major Exterior siding — Significant weathering and discoloration
- Major Landscaping — Overgrown bushes need trimming
Value-add opportunities
- Both Paint exterior walls — Enhances curb appeal and value
- Both Trim bushes — Improves landscaping and enhances curb appeal
Renovation cost estimate screening
| Repair item | Severity | Est. cost |
|---|---|---|
| Exterior siding · Significant weathering and discoloration | Major | $15,000–50,000 |
| Landscaping · Overgrown bushes need trimming | Major | $15,000–50,000 |
| Total estimated repair cost · 2 items | $30,000–100,000 |
Value-add ROI direction
- Both Paint exterior walls — Enhances curb appeal and value ↑
- Both Trim bushes — Improves landscaping and enhances curb appeal ↑
ⓘ Cost ranges are severity-bucket heuristics (US national rule-of-thumb). Get contractor quotes + a written scope before underwriting a rehab budget.
Schools (NCES district)
- District
- Toledo City
- NCES district ID
- 3904490
- Math proficiency
- 15% ▼ -16.00%
- Reading proficiency
- 24% ▼ -13.00%
- Median HH income
- $32,137
- Composite
- 15.76/100
- National rank
- #9276
- State rank
- #634 of 656 in OH
Livability — Toledo
- Score
- 66/100
- State rank
- #645
- US rank
- #11442
Category grades
Schools grade is shown separately in the Schools card above.
Census & demographics
- Census place
- Toledo, OH
- County
- Lucas County · 380,724 people
- City population
- 280,811
- Metro
- Toledo, OH
- Population (ZIP)
- 29,075
- Household income
- $58,961
- Rent vs Own
- Severe rent burden
- 1407.0
Population outlook (Lucas County) Hauer SSP2
- Today (2025)
- 420,751 people
- By 2030
- 410,187 · -2.5%
- By 2040
- 384,019 · -8.7%
- By 2050
- 355,125 · -15.6%
- By 2075
- 291,683 · -30.7%
- By 2100
- 233,670 · -44.5%
Race, ethnicity, and origin ACS 2023
- Neighborhood character
- Predominantly White (67%)
- Race & ethnicity
- White 67% Black 21% Hispanic / Latino 7% Two or more races 4% Asian 2%
- Hispanic origin (detail)
- Mexican 6% Puerto Rican 1%
- Common ancestry
- Romanian 8% Italian 5% Lithuanian 3%
- Foreign-born
- 3% · Canada
- Languages at home
- 96% English-only · Other Indo-European 1% Spanish 1%
Political lean MEDSL · Lucas
- 2024 margin
- D (+12.6) · D 55.8% · R 43.2%
- 2008→2024 swing
- -18.9pp toward R · 2008: 31.4pp · 2024: 12.6pp
- All cycles
- 2024: D+12.6 2020: D+16.8 2016: D+17.4 2012: D+30.4 2008: D+31.4
Not yet ingested
- Civics
- —
Market trends
- HPI YoY
- ▼ -61.96%
- Current HPI
- 214.7031
- Rent YoY
- ▲ 8.03%
- Metro
- Toledo, OH
- State GDP YoY
- ▲ 1.98%
- F500 in state
- 48
Industry mix (Fortune 500 HQ in OH)
| Industry | F500 HQs | Revenue |
|---|---|---|
| Insurance | 3 | $145B |
|
||
| Industrial Machinery | 3 | $49B |
|
||
| Financial Services | 3 | $24B |
|
||
| Consumer Goods | 2 | $93B |
|
||
| Aerospace / Defense | 2 | $47B |
|
||
| Utilities | 2 | $33B |
|
||
Price history
-4.4% since first listed3 events — show timeline
- 2026-02-26 Price Changed $214,900 NORIS
- 2025-11-05 Price Changed $219,900 NORIS
- 2025-10-13 Listed $224,900 NORIS
Cash-flow waterfall
monthlySold comps — $/sqft
last 12 mo · ≤1 miLoading sold comps…