4328 E Main St · Lemon Grove, FL
Flood risk 1/10 · Minimal
- FEMA flood zone
- X (unshaded)
- Chance of flooding over 30 yrs
- 0.0%
- Est. flood insurance / yr
- $507 – $1,088
Fire risk 6/10 · Moderate
- Est. fire insurance / yr
- $947 – $1,759
Heat risk 8/10 · Major
- Hot days now (above 108°F)
- 7 days/yr
- Hot days in 30 yrs
- 26 days/yr
Wind risk 10/10 · Severe
- Chance of severe wind over 30 yrs
- 99.0%
Air-quality risk 2/10 · Minimal
- Unhealthy air days now
- 2 days/yr
- Unhealthy air days in 30 yrs
- 2 days/yr
Risk factors via First Street. Map © Google.
Why this score? — see what drove the F grade
The composite is a weighted blend of 9 inputs, each scored 0–100. Each bar is that input's sub-score; the figure is the points it added to the 100-point composite (weight × sub-score).
- Cash flow +14.3/30.0
- DSCR +4.3/10.0
- Schools +3.8/10.0
- 1% rule +3.2/10.0
- Livability +3.1/5.0
- Rent growth +2.5/5.0
- Condition / age +2.5/5.0
- ARV discount +0.0/15.0
- Appreciation +0.0/10.0
$149,900
🖨 Deal sheet 📄 Offer letter ✓ Due diligence
Listing remarks
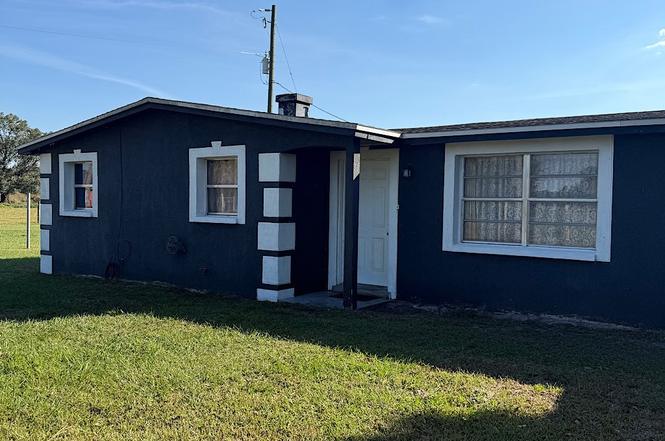
Great investment opportunity just outside city limits! Solid 3-bedroom, 1-bath block home featuring a functional floor plan and durable construction. Located in a quiet area with easy access to schools, shopping, and major highways. Property offers an oversized lot with ample space for parking or future improvements. Home has excellent potential for rental income, renovation, or first-time buyers. No HOA. Don’t miss this versatile property with plenty of room to add value.
Key facts
- Durable construction
- Quiet area
- 0.34 acre lot
Tags
Property features AI
Exterior
- Parking: Carport (1 space)
- Utilities: Private well water; Septic tank (no public sewer available)
- Home design: Single-family residence; One-level
- Construction: Block and concrete construction; Shingle roof
- Exterior features: Front porch; Dirt and gravel road access; Unimproved road frontage; Frontage approximately 100 feet; Zoned A1
Interior
- Flooring: Linoleum; Tile
- Bathrooms: One full bathroom
- Heating & cooling: No central heating reported; Wall cooling unit(s)
- Interior features: Linoleum and tile flooring; Total of 7 rooms
Neighborhood map
What this means for you Summary
Snapshot
- This is a 3-bed/2.0-bath single-family listed at $150k.
Deal economics
- At list price, monthly cash flow is $27 ($321/yr) — positive.
- The deal already cash-flows at list — no discount required.
- To meet the 1% rule (rent ≥ 1% of price), the offer needs to be $123k (17.9% below list).
- Recommended offer: $123k (17.9% below list) — sets the bar for 1% rule.
Location & tenants
- Location reads 62/100 on livability (#758 in FL) — a middle-class / working-renter tenant base. Strengths: cost of living A+, housing A-; Watch: amenities F, commute F, employment F.
- Hardee (town): math 46% / reading 46% proficiency, ranked #50 of 73 in FL (top 68%) — families likely to look elsewhere, expect single-tenant / working-renter base with shorter leases; 73% free/reduced lunch — lower-income household profile, screen leases tightly.
- Zoned schools: Wauchula Elementary School (math 48% / reading 50%, grade D, #1,134 of 2,144 statewide, top 54%, 616 students, 75% FRL); Hardee Senior High School (math 25% / reading 40%, grade F, #411 of 667 statewide, top 62%, 1,403 students, 67% FRL) — zoned schools at 71% FRL track the district average.
- Market conditions: 100 active listings in the ZIP; 123 units permitted in Hardee County in 2024 (22 in 5+ unit buildings).
Forward outlook
- Local home prices are declining (-3.0%/yr); year-one equity from $1k of loan paydown is wiped out by about $4k of value loss. Plan a longer hold.
- Hardee County population projected at -24% by 2050 — secular population decline; favor cash flow + early exit over multi-decade hold.
Negotiation context
- It's been on market 212 days — a 12% lower offer ($132k) is reasonable based on typical stale-listing flexibility.
- 5 sale attempts since 3y ago with the ask held roughly flat each time — persistent listings suggest the price (not the market) is what's stuck; bring a comps-based counter.
- Current owner paid $75k; list at $150k implies a 100% gain — meaningful room to come down on a strong offer.
Risks & watch-outs
- Climate carrying-cost: severe wind risk, 99% chance of damaging wind over 30y; major wildfire risk; extreme-heat days projected 7→26/yr by 2055 (HVAC capex compounding) — expect insurance premiums to compound above CPI over the hold.
Questions for the listing agent
- It's been on market 212 days. Have you received any prior offers? Is the seller open to a 18% concession, seller financing, or rate buy-down credit?
- Built in 1970 — when were the roof, HVAC, electrical panel, plumbing, and water heater last replaced?
- Why hasn't it sold? Are there any deal-killer items the seller is aware of (foundation, flood, title, zoning, code violations)?
- Is there a deadline driving the sale (1031 exchange, divorce, estate, relocation)? That informs how much negotiation room exists.
- Schools are F-rated, which usually means shorter tenancies and higher turnover. Who's the typical renter profile here, and what's been the actual vacancy rate?
- The area grade is low — what's the realistic commute time and amenity access for the typical tenant pool here? Any planned neighborhood developments (good or bad) we should know about?
- What's the average days-on-market for RENTAL listings here right now (not sales)? A rising rental-DOM trend means longer vacancies and softer asking-rent achievability than the comps imply.
- What's the recent tenant-quality profile in this submarket — average credit score on applications, eviction rate, late-payment / NSF rate, and stable-employment percentage? A property-management company in the area should have these aggregated.
- How much new for-sale + rental construction is in the pipeline within 1–3 miles? Heavy new supply typically softens prices + rents 12–24 months out; constrained supply supports both.
Investment metrics
- 1% rule
- 0.82% ✗
- Cap rate
- 6.51%
- Cash-on-cash
- 0.77%
- DSCR
- 1.03
- GRM
- 10.2
CMA / ARV
- ARV (on-the-fly)
- $119,560
- Comps found
- 1
Show comp detail 1 sale within ~0.75 mi
| Address | Dist | Beds/Ba | Sqft | Sold | Price | $/sf | Match |
|---|---|---|---|---|---|---|---|
| 4296 E Main St | 0.06mi | 2/1.0 (-1) | 1,120 (-8%) | 8mo | $110,000 | $98 | 68 |
Match score weights: distance 35% · size 25% · config 20% · recency 20%. Top-matched comps best support the ARV.
Projected returns pro-forma
-3.0% appreciation · 3.0% rent growth · sell at horizon
- IRR
- -15.1%
- Equity multiple
- 0.46×
- Total profit
- $-22,622
- Equity at exit
- $22,351
- IRR
- -6.6%
- Equity multiple
- 0.58×
- Total profit
- $-17,654
- Equity at exit
- $12,961
Cash invested: $41,972 (down + closing). Projections, not guarantees.
Landlord ↔ Tenant lean methodology
- Overall (STATE)
- 87 Strongly Landlord-Friendly
- State Florida
- 87 Strongly Landlord-Friendly · R+3
- County
- — inherits STATE
- City
- — inherits STATE
ZIP-level market 33873
- Home prices YoY
- -3.1%
- Active inventory
- 100
- Price-to-rent
- 10.2×
Monthly cashflow live
- Estimated rent
- $1,231 medium interval (Pro) →
- Mortgage (P&I)
- −$786
- Tax from tax record
- −$97 /mo · $1,162/yr
- Insurance
- −$62
- HOA
- −$0
- Vacancy / Maint / Mgmt
- −$258
- Net cashflow
- $27
Break-even live
UW: 25.0% down · 7.5% · 30yr · 1.5% tax · 5.0% vac · 8.0% maint · 8.0% mgmt
Financing live
Cash to close
- Down payment
- $37,475
- Closing costs
- $4,497
- Reserves months
- —
- Total cash needed
- —
Loan-product check · same deal, 3 products live
Conventional
25% down · 7.5% · 30yr
- Down + closing
- —
- Monthly P&I
- —
- Monthly cashflow
- —
- DSCR
- —
- Eligible?
- —
Personal DTI + credit; lowest rate.
DSCR
20% down · 8.5% · 30yr
- Down + closing
- —
- Monthly P&I
- —
- Monthly cashflow
- —
- DSCR
- —
- Eligible?
- —
No personal income docs; deal must DSCR.
Hard money
10% down · 12.0% · 12mo
- Down + closing
- —
- Monthly P&I
- —
- Monthly cashflow
- —
- DSCR
- —
- Eligible?
- —
Short-term bridge; refi at stabilization.
Listing history 32 events
-
2026-06-19days on market $149,900 Active 212 DOM
-
2026-06-18days on market $149,900 Active 211 DOM
-
2026-06-17days on market $149,900 Active 210 DOM
-
2026-06-16days on market $149,900 Active 209 DOM
-
2026-06-15days on market $149,900 Active 208 DOM
-
2026-06-14days on market $149,900 Active 206 DOM
-
2026-06-13days on market $149,900 Active 205 DOM
-
2026-06-10days on market $149,900 Active 203 DOM
-
2026-06-09days on market $149,900 Active 202 DOM
-
2026-06-08days on market $149,900 Active 201 DOM
-
2026-06-07days on market $149,900 Active 200 DOM
-
2026-06-05days on market $149,900 Active 197 DOM
-
2026-06-03days on market $149,900 Active 196 DOM
-
2026-06-02days on market $149,900 Active 195 DOM
-
2026-06-01days on market $149,900 Active 194 DOM
-
2026-05-31days on market $149,900 Active 193 DOM
-
2026-05-30days on market $149,900 Active 192 DOM
-
2026-05-19status Active
-
2026-05-19historical
-
2026-01-06price $149,900
-
2026-01-03price $152,900
-
2025-11-19$154,900 Active
-
2023-08-28status Active
-
2023-08-28status Pending
-
2023-08-27status Active
-
2023-08-21historical
-
2023-07-26$180,000 Active
-
2007-12-31soldstatus $75,000
-
2007-12-17soldstatus $55,000
-
1997-07-01soldstatus $47,000
-
1994-09-01soldstatus $40,000
-
1994-06-01soldstatus $35,000
ⓘ Source: listings_history table (triggers on properties + properties_extension) + one-shot
backfill from property_details.listing_events for pre-trigger history.
Tax reassessment forecast FL · Resets to sale price
- Current annual tax
- $1,162 · $97/mo
- Projected year-2 tax
- $1,244 · $104/mo
- Expected delta
- +$82/yr (+$7/mo · 7.1%)
ⓘ Screening estimate from a state-policy table — verify with the county assessor before closing.
Climate risk First Street
- Flood 1/10 Low FEMA zone X (unshaded) · 0% chance over 30 yrs
- Wildfire 6/10 Major
- Heat 8/10 Severe 7 d/yr ≥108°F today · 26 d/yr by 30 yrs out
- Wind 10/10 Extreme 99% chance of damaging wind over 30 yrs
- Air quality 2/10 Low 2 unhealthy d/yr today · 2 by 30 yrs out
Nearby sold comps map
Loading sold comps map…
Walkable amenities ~0.75 mi
Loading nearby amenities…
Taxation est. · year 1
- Rental income
- $14,767
- − Mortgage interest
- −$8,397
- − Property taxes
- −$1,162
- − Insurance
- −$750
- − Repairs & maintenance
- −$1,181
- − Management
- −$1,181
- − Depreciation
- −$4,361
- Taxable loss
- −$2,265
- Est. tax savings @ 24.0%
- +$544
- After-tax cash flow
- $865/yr
For passive investors: Depreciation is non-cash, so a rental often shows a tax loss while cash-flowing — sheltering income. Rental losses are passive: they offset passive income freely, and up to $25,000/yr can offset ordinary (W-2) income if you actively participate and your MAGI is under $100k (phasing out to $0 by $150k); unused losses carry forward. On sale, claimed depreciation is recaptured at up to 25%, and gains may owe capital-gains tax (a 1031 exchange can defer both). Figures are a year-1 estimate at your 24.0% rate — not tax advice; consult a CPA.
Schools (NCES district)
- District
- Hardee
- NCES district ID
- 1200750
- Math proficiency
- 46% ▼ -13.00%
- Reading proficiency
- 46% ▼ -2.00%
- Median HH income
- $36,868
- Composite
- 38.22/100
- National rank
- #4251
- State rank
- #50 of 73 in FL
Livability — Lemon Grove
- Score
- 62/100
- State rank
- #758
- US rank
- #16733
Category grades
Schools grade is shown separately in the Schools card above.
Census & demographics
- Population (ZIP)
- 14,162
Population outlook (Hardee County) Hauer SSP2
- Today (2025)
- 25,462 people
- By 2030
- 24,340 · -4.4%
- By 2040
- 21,801 · -14.4%
- By 2050
- 19,217 · -24.5%
- By 2075
- 13,159 · -48.3%
- By 2100
- 7,806 · -69.3%
Race, ethnicity, and origin ACS 2023
- Neighborhood character
- Diverse neighborhood (Simpson 0.59)
- Race & ethnicity
- Hispanic / Latino 47% White 43% Two or more races 18% Black 5% Native American 3% Asian 1%
- Hispanic origin (detail)
- Mexican 31% Puerto Rican 8% Cuban 2%
- Common ancestry
- Italian 2% Lithuanian 1% Serbian 1%
- Foreign-born
- 11% · Canada, Jamaica
- Languages at home
- 68% English-only · Spanish 30% Other Asian/Pacific 1%
Political lean MEDSL · Hardee
- 2024 margin
- Solid R (+56.3) · D 21.5% · R 77.8%
- 2008→2024 swing
- -26.7pp toward R · 2008: -29.6pp · 2024: -56.3pp
- All cycles
- 2024: R+56.3 2020: R+45.1 2016: R+40.8 2012: R+30.9 2008: R+29.6
Not yet ingested
- Civics
- —
Market trends
- HPI YoY
- ▼ -11.44%
- Current HPI
- 360.0195
- Rent YoY
- —
- Metro
- —
- State GDP YoY
- ▲ 3.28%
- F500 in state
- 36
Industry mix (Fortune 500 HQ in FL)
| Industry | F500 HQs | Revenue |
|---|---|---|
| Industrial Technology | 2 | $29B |
|
||
| Insurance | 2 | $17B |
|
||
| Retail | 1 | $60B |
|
||
| Technology Distribution | 1 | $58B |
|
||
| Homebuilding | 1 | $35B |
|
||
| Technology Manufacturing | 1 | $35B |
|
||
Price history
+328.3% since first listed15 events — show timeline
- 2026-05-19 Relisted — HAOR as distributed by MLS GRID
- 2026-05-19 Delisted — HAOR as distributed by MLS GRID
- 2026-01-06 Price Changed $149,900 HAOR as distributed by MLS GRID
- 2026-01-03 Price Changed $152,900 HAOR as distributed by MLS GRID
- 2025-11-19 Listed $154,900 HAOR as distributed by MLS GRID
- 2023-08-28 Relisted — HAOR as distributed by MLS GRID
- 2023-08-28 Pending — HAOR as distributed by MLS GRID
- 2023-08-27 Relisted — HAOR as distributed by MLS GRID
- 2023-08-21 Delisted — HAOR as distributed by MLS GRID
- 2023-07-26 Listed $180,000 HAOR as distributed by MLS GRID
- 2007-12-31 Sold (Public Records) $75,000 Public Records
- 2007-12-17 Sold (Public Records) $55,000 Public Records
- 1997-07-01 Sold (Public Records) $47,000 Public Records
- 1994-09-01 Sold (Public Records) $40,000 Public Records
- 1994-06-01 Sold (Public Records) $35,000 Public Records
Property tax history
+6.3%/yrLatest (2025): $1,162 · +5.2% YoY. Source: county tax records.
Cash-flow waterfall
monthlySold comps — $/sqft
last 12 mo · ≤1 miLoading sold comps…