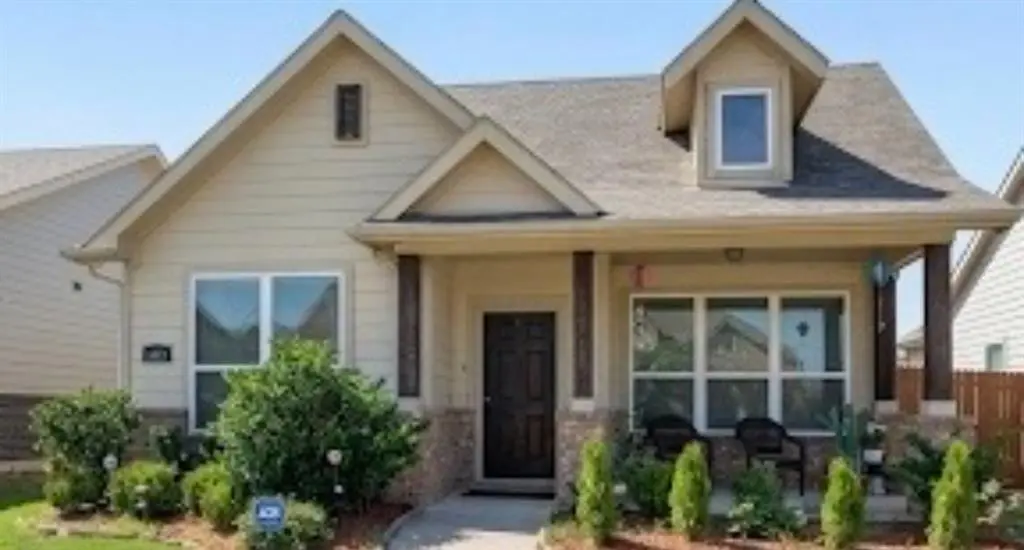
3413 Agate Trl · Heartland, TX
Flood risk 1/10 · Minimal
- FEMA flood zone
- X (unshaded)
- Chance of flooding over 30 yrs
- 0.0%
- Est. flood insurance / yr
- $507 – $1,088
Fire risk 5/10 · Moderate
- Est. fire insurance / yr
- $1,222 – $2,270
Heat risk 8/10 · Major
- Hot days now (above 110°F)
- 7 days/yr
- Hot days in 30 yrs
- 25 days/yr
Wind risk 6/10 · Moderate
- Chance of severe wind over 30 yrs
- 27.0%
Air-quality risk 2/10 · Minimal
- Unhealthy air days now
- 1 days/yr
- Unhealthy air days in 30 yrs
- 1 days/yr
Risk factors via First Street. Map © Google.
Why this score? — see what drove the D- grade
The composite is a weighted blend of 9 inputs, each scored 0–100. Each bar is that input's sub-score; the figure is the points it added to the 100-point composite (weight × sub-score).
- ARV discount +14.9/15.0
- Cash flow +7.4/30.0
- 1% rule +4.0/10.0
- Schools +3.6/10.0
- Rent growth +2.9/5.0
- Livability +2.5/5.0
- Condition / age +2.5/5.0
- DSCR +1.5/10.0
- Appreciation +0.0/10.0
$244,000
🖨 Deal sheet (PDF) 📄 Offer letter ✓ Due diligence
Listing remarks
BELOW APPRAISED VALUE – Investor Priced for All Experience resort-style living in the highly sought-after Heartland community. This home offers magnificent curb appeal, featuring a large, covered porch complete with an inviting swing that stays with the property. Inside, you will find a warm, open living area and a dining space accented by a beautiful bay window. The fully equipped kitchen boasts stainless steel appliances, and the washer and dryer are included for your convenience. Unlike many nearby new builds under $300k, this home features a full tub and shower combo in the primary suite, which also includes newly installed vinyl flooring. Faux wood blinds are found throughout
Key facts
- Covered porch
- Bay window
- Faux wood blinds
Tags
Property features AI
Finance
- Other: Municipal Utility District; Multiple parcel ID: yes
- HOA & community: Mandatory HOA; HOA management: Heartland Community Association; Association fee covers management fees; HOA fee $420 annually
Exterior
- Parking: Attached 2-car garage; 2 covered parking spaces; Garage door opener; Garage faces rear
- Utilities: MUD water; MUD sewer
- Home design: Single-family residence; One story
- Construction: Built in 2018; Composition roof
- Exterior features: Lot under 0.5 acre (approximately 0.132 acres); Subdivision: Heartland Ph 8
Interior
- Kitchen: Dishwasher; Disposal; Electric oven; Electric range; Microwave; Refrigerator; Kitchen island; Pantry
- Bedrooms: 3 bedrooms (all on the main level)
- Bathrooms: 2 full bathrooms
- Heating & cooling: Electric heating; Electric cooling
- Interior features: Cable TV available; High-speed internet available; Kitchen island; Pantry; One living area; One dining area
- Laundry & utility: Washer; Dryer
Neighborhood map
What this means for you Summary
Snapshot
- This is a 3-bed/2.0-bath single-family listed at $244k.
Deal economics
- At list price, monthly cash flow is $-316 ($-4k/yr) — negative.
- To cash-flow at today's rent, offer at most $188k (22.9% below list).
- To meet the 1% rule (rent ≥ 1% of price), the offer needs to be $220k (10.0% below list).
- Recommended offer: $188k (22.9% below list) — sets the bar for cash-flow.
Location & tenants
- Location reads: area grade D — affects rentability + tenant quality, not the cash-flow math above.
- Crandall ISD (rural): math 36% / reading 42% proficiency, ranked #351 of 826 in TX (top 42%) — families likely to look elsewhere, expect single-tenant / working-renter base with shorter leases.
- Zoned schools: Hollis T Dietz El (math 32% / reading 40%, grade F, #1,921 of 4,322 statewide, top 45%, 815 students, 60% FRL); Crandall Middle (math 38% / reading 42%, grade F, #646 of 1,662 statewide, top 40%, 983 students, 60% FRL); Crandall H S (math 33% / reading 53%, grade F, #713 of 1,632 statewide, top 44%, 1,707 students, 56% FRL) — zoned schools average 59% FRL vs 41% district-wide (17 pts higher); higher-poverty schools than district average — tighter screening recommended.
- Market conditions: Rents rising (+1.4%/yr); 2204 active listings in the ZIP; 32 comparable units currently listed for rent nearby; rentals at typical pace (median 27d on market — plan ~3-4 weeks tenant-placement turnaround); solid renter incomes; 1,747 units permitted in Kaufman County in 2024 (180 in 5+ unit buildings).
Forward outlook
- Local home prices are declining (-3.0%/yr); year-one equity from $2k of loan paydown is wiped out by about $7k of value loss. Plan a longer hold.
- Kaufman County population projected at +43% by 2050 — long-run rental-demand tailwind backs the buy-and-hold thesis.
Negotiation context
- It's been on market 50 days — a 3% lower offer ($237k) is reasonable based on typical stale-listing flexibility.
- 11 sale attempts since 9y ago with the ask held roughly flat each time — persistent listings suggest the price (not the market) is what's stuck; bring a comps-based counter.
Risks & watch-outs
- Watch-outs: property tax is 3.1% of price.
- Climate carrying-cost: major wind risk, 27% chance of damaging wind over 30y; moderate wildfire risk; extreme-heat days projected 7→25/yr by 2055 (HVAC capex compounding) — expect insurance premiums to compound above CPI over the hold.
Questions for the listing agent
- What do current leases actually rent for vs. the listed asking? Can we see a recent rent roll and the last 12 months of T-12 income?
- It's been on market 50 days. Have you received any prior offers? Is the seller open to a 23% concession, seller financing, or rate buy-down credit?
- Property tax is high relative to price — has the assessment been appealed recently, and will the sale trigger a re-assessment?
- What does the HOA fee cover, when was the last increase, and are there any pending special assessments or reserve-fund shortfalls?
- Is there a deadline driving the sale (1031 exchange, divorce, estate, relocation)? That informs how much negotiation room exists.
- The area grade is low — what's the realistic commute time and amenity access for the typical tenant pool here? Any planned neighborhood developments (good or bad) we should know about?
- What's the average days-on-market for RENTAL listings here right now (not sales)? A rising rental-DOM trend means longer vacancies and softer asking-rent achievability than the comps imply.
- What's the recent tenant-quality profile in this submarket — average credit score on applications, eviction rate, late-payment / NSF rate, and stable-employment percentage? A property-management company in the area should have these aggregated.
- How much new for-sale + rental construction is in the pipeline within 1–3 miles? Heavy new supply typically softens prices + rents 12–24 months out; constrained supply supports both.
Investment metrics
- 1% rule
- 0.90% ✗
- Cap rate
- 4.74%
- Cash-on-cash
- -5.54%
- DSCR
- 0.75
- GRM
- 9.3
CMA / ARV
- ARV (median comp)
- $292,101
- List price
- $244,000
- Delta
- -16.47%
- Verdict
- UNDERPRICED
- Comps
- 20 within 1.0 mi
Show comp detail 12 sales within ~0.75 mi
| Address | Dist | Beds/Ba | Sqft | Sold | Price | $/sf | Match |
|---|---|---|---|---|---|---|---|
| 3411 Blue Granite Ln | 0.16mi | 3/2.0 | 1,480 (-2%) | 0mo | $245,000 | $166 | 88 |
| 3402 Pumice Ct | 0.11mi | 3/2.0 | 1,442 (-5%) | 1mo | $249,900 | $173 | 86 |
| 2005 Peony St | 0.21mi | 3/2.0 | 1,404 (-7%) | 1mo | $235,000 | $167 | 77 |
| 4040 Golden Rod Dr | 0.31mi | 3/2.0 | 1,419 (-6%) | 2mo | $199,999 | $141 | 73 |
| 2008 Pine Knot Dr | 0.56mi | 3/2.0 | 1,521 (+0%) | 1mo | $224,999 | $148 | 73 |
| 4010 Ridgetop Dr | 0.31mi | 3/2.0 | 1,404 (-7%) | 2mo | $225,000 | $160 | 72 |
| 3105 Cassinia Pkwy | 0.52mi | 3/2.0 | 1,554 (+2%) | 1mo | $245,000 | $158 | 71 |
| 2007 Pine Knot Dr | 0.56mi | 3/2.0 | 1,475 (-3%) | 1mo | $239,900 | $163 | 69 |
| 2021 Lake Trail Dr | 0.67mi | 3/2.0 | 1,520 (+0%) | 1mo | $114,900 | $76 | 68 |
| 3010 Rosemount Ln | 0.67mi | 3/2.0 | 1,393 (-8%) | 1mo | $249,900 | $179 | 54 |
| 2014 Moonlight Trl | 0.67mi | 3/2.0 | 1,650 (+9%) | 1mo | $235,000 | $142 | 54 |
| 2911 Firewheel St | 0.74mi | 3/2.0 | 1,672 (+10%) | 1mo | $275,000 | $164 | 48 |
Match score weights: distance 35% · size 25% · config 20% · recency 20%. Top-matched comps best support the ARV.
Projected returns pro-forma
-3.0% appreciation · 1.42% rent growth · sell at horizon
- IRR
- -27.9%
- Equity multiple
- 0.08×
- Total profit
- $-62,824
- Equity at exit
- $36,381
- IRR
- -35.3%
- Equity multiple
- -0.36×
- Total profit
- $-93,214
- Equity at exit
- $21,097
Cash invested: $68,320 (down + closing). Projections, not guarantees.
Landlord ↔ Tenant lean methodology
- Overall (STATE)
- 87 Strongly Landlord-Friendly
- State Texas
- 87 Strongly Landlord-Friendly · R+5
- County
- — inherits STATE
- City
- — inherits STATE
ZIP-level market 75126
- Rents YoY
- 1.4%
- Active inventory
- 2204
- Price-to-rent
- 9.3×
Monthly cashflow live
- Estimated rent
- $2,196 high interval (Pro) →
- Mortgage (P&I)
- −$1,280
- Tax from tax record
- −$635 /mo · $7,614/yr
- Insurance
- −$102
- HOA
- −$35
- Lot rent
- −$0
- Vacancy / Maint / Mgmt
- −$461
- Net cashflow
- $-316
Break-even live
Sensitivity live
| Price | -10% $-178 | -5% $-247 | +0% $-316 | +5% $-385 | +10% $-454 |
|---|---|---|---|---|---|
| Rent | -10% $-489 | -5% $-402 | +0% $-316 | +5% $-229 | +10% $-142 |
| Rate | -1.0pp $-193 | -0.5pp $-254 | base $-316 | +0.5pp $-379 | +1.0pp $-443 |
UW: 25.0% down · 7.5% · 30yr · 1.5% tax · 5.0% vac · 8.0% maint · 8.0% mgmt
Financing live
Cash to close
- Down payment
- $61,000
- Closing costs
- $7,320
- Reserves months
- —
- Total cash needed
- —
Loan-product check · same deal, 3 products live
Conventional
25% down · 7.5% · 30yr
- Down + closing
- —
- Monthly P&I
- —
- Monthly cashflow
- —
- DSCR
- —
- Eligible?
- —
Personal DTI + credit; lowest rate.
DSCR
20% down · 8.5% · 30yr
- Down + closing
- —
- Monthly P&I
- —
- Monthly cashflow
- —
- DSCR
- —
- Eligible?
- —
No personal income docs; deal must DSCR.
Hard money
10% down · 12.0% · 12mo
- Down + closing
- —
- Monthly P&I
- —
- Monthly cashflow
- —
- DSCR
- —
- Eligible?
- —
Short-term bridge; refi at stabilization.
Rent comps 32 comps
| Address | Beds | Baths | Sqft | Rent | $/sqft | DOM | Units | Dist |
|---|---|---|---|---|---|---|---|---|
| 1968 Marble Ln Forney, TX | 3.0 | 2.5 | 2051 | $2,350 | $1.15 | 17d | 1 | 0.08mi |
| 4032 Eagle Dr Forney, TX | 3.0 | 2.0 | 1456 | $1,775 | $1.22 | 7d | 1 | 0.28mi |
| 3941 Hometown Blvd Unit 3941 Crandall, TX | 3.0 | 2.5 | 1736 | $2,400 | $1.38 | 46d | 1 | 0.34mi |
| 4009 Freedom St Heartland, TX | 3.0 | 2.0 | 1419 | $1,800 | $1.27 | 46d | 1 | 0.40mi |
| 4121 Gaillardia Way Forney, TX | 4.0 | 2.0 | 2135 | $2,250 | $1.05 | 21d | 1 | 0.48mi |
| 2015 Angel Way Heartland, TX | 3.0 | 2.0 | 1408 | $1,671 | $1.19 | 24d | 1 | 0.55mi |
| 2040 Shawnee Trl Heartland, TX | 4.0 | 2.0 | 1836 | $2,000 | $1.09 | 17d | 1 | 0.76mi |
| 2038 Allyson Dr Heartland, TX | 3.0 | 2.0 | 1496 | $1,900 | $1.27 | 46d | 1 | 0.80mi |
| 2919 Cascade Ln Forney, TX | 3.0 | 2.0 | 1481 | $2,200 | $1.49 | 46d | 1 | 0.81mi |
| 2048 Lake Trail Dr Heartland, TX | 3.0 | 2.0 | 1900 | $2,300 | $1.21 | 0d | 1 | 0.84mi |
| 2048 Lake Trail Dr Heartland, TX | 3.0 | 2.0 | 1908 | $2,250 | $1.18 | 5d | 1 | 0.84mi |
| 3004 Dakota Trl Crandall, TX | 4.0 | 2.0 | 1938 | $2,300 | $1.19 | 6d | 1 | 0.88mi |
| 4001 Fairmont Ln Forney, TX | 4.0 | 2.0 | 1545 | $2,000 | $1.29 | 46d | 1 | 1.00mi |
| 4002 Bighorn Dr Forney, TX | 3.0 | 2.0 | 1365 | $2,120 | $1.55 | 4d | 1 | 1.01mi |
| 3028 Willow Wood Ct Crandall, TX | 3.0 | 2.5 | 1764 | $2,600 | $1.47 | 46d | 1 | 1.03mi |
| 2035 Karsen Ln Heartland, TX | 4.0 | 2.0 | 1587 | $2,125 | $1.34 | 0d | 1 | 1.07mi |
| 2826 Hudson Dr Crandall, TX | 3.0 | 2.0 | 1639 | $2,400 | $1.46 | 8d | 1 | 1.09mi |
| 3012 Glazner Dr Forney, TX | 3.0 | 2.5 | 1984 | $2,195 | $1.11 | 6d | 1 | 1.13mi |
| 3001 Glazner Dr Forney, TX | 3.0 | 2.0 | 1510 | $2,350 | $1.56 | 46d | 1 | 1.16mi |
| 3147 Blossom Trl Crandall, TX | 4.0 | 3.0 | 2177 | $2,700 | $1.24 | 46d | 1 | 1.20mi |
| 2237 Mustang Ghost Trl Crandall, TX | 3.0 | 2.0 | 1952 | $2,040 | $1.05 | 46d | 1 | 1.30mi |
| 2745 Bronte Blvd Crandall, TX | 4.0 | 2.0 | 1667 | $1,845 | $1.11 | 27d | 1 | 1.32mi |
| 2746 Bronte Blvd Crandall, TX | 4.0 | 2.0 | 1707 | $1,825 | $1.07 | 27d | 1 | 1.32mi |
| 2409 Fleming Dr Crandall, TX | 4.0 | 2.0 | 1667 | $1,845 | $1.11 | 27d | 1 | 1.33mi |
| 3324 Perman Dr Forney, TX | 3.0 | 2.5 | 1724 | $2,125 | $1.23 | 15d | 1 | 1.33mi |
| 3137 Grimaldo Dr Forney, TX | 3.0 | 2.0 | 1565 | $1,995 | $1.27 | 15d | 1 | 1.33mi |
| 3137 Grimaldo Dr Forney, TX | 3.0 | 2.0 | 1585 | $2,195 | $1.38 | 26d | 1 | 1.33mi |
| 2739 Bronte Blvd Crandall, TX | 4.0 | 2.0 | 1707 | $1,825 | $1.07 | 27d | 1 | 1.34mi |
| 2521 Flight Trl Crandall, TX | 4.0 | 2.0 | 1707 | $1,825 | $1.07 | 27d | 1 | 1.34mi |
| 2513 Flight Trl Crandall, TX | 4.0 | 2.0 | 1707 | $1,825 | $1.07 | 27d | 1 | 1.38mi |
| 2510 Flight Trl Crandall, TX | 4.0 | 2.0 | 1667 | $1,845 | $1.11 | 27d | 1 | 1.39mi |
| 2624 Bartlett St Crandall, TX | 4.0 | 2.0 | 1707 | $1,825 | $1.07 | 27d | 1 | 1.41mi |
HOA detail
- Monthly dues
- $35 · $420/yr
Listing history 48 events
-
2026-06-22days on market $244,000 Active 50 DOM
-
2026-06-21days on market $244,000 Active 49 DOM
-
2026-06-18days on market $244,000 Active 46 DOM
-
2026-06-17days on market $244,000 Active 45 DOM
-
2026-06-16days on market $244,000 Active 44 DOM
-
2026-06-15days on market $244,000 Active 43 DOM
-
2026-06-13pricedays on market $244,000 Active 41 DOM
-
2026-06-09days on market $245,500 Active 37 DOM
-
2026-06-08days on market $245,500 Active 36 DOM
-
2026-06-07days on market $245,500 Active 35 DOM
-
2026-06-04days on market $245,500 Active 32 DOM
-
2026-06-03days on market $245,500 Active 31 DOM
-
2026-06-02days on market $245,500 Active 30 DOM
-
2026-06-01days on market $245,500 Active 29 DOM
-
2026-05-31pricedays on market $245,500 Active 28 DOM
-
2026-05-17price $246,000 1006-char remark
-
2026-05-03$248,000 Active 1006-char remark
-
2025-07-21historical $2,150
-
2025-07-14$255,000 Active
-
2025-06-30historical
-
2025-06-14$2,150
-
2025-05-23price $255,000
-
2025-04-29price $259,999
-
2025-04-22price $261,200
-
2025-04-17price $262,000
-
2025-03-27price $264,500
-
2025-03-16$269,000 Active
-
2024-12-04historical $2,300
-
2024-11-23$2,300
-
2024-11-14price $264,800
-
2024-10-20price $265,000
-
2024-10-14price $270,000
-
2024-10-04$275,000 Active
-
2023-08-23soldstatus
-
2023-08-21soldstatus Closed
-
2023-06-08status Pending
-
2023-05-12price $280,000
-
2023-04-21$290,000 Active
-
2021-09-20soldstatus
-
2021-09-13soldstatus Sold
-
2021-09-13soldstatus
-
2021-08-13status Pending
-
2021-08-09$250,000
-
2021-08-06$250,000 Active
-
2018-03-23soldstatus Sold
-
2018-02-11status Active
-
2018-01-05status Pending
-
2017-11-13$206,148 Active
ⓘ Source: listings_history table (triggers on properties + properties_extension) + one-shot
backfill from property_details.listing_events for pre-trigger history.
Tax reassessment forecast TX · Resets to sale price
- Current annual tax
- $7,614 · $635/mo
- Projected year-2 tax
- $7,614 · $635/mo
- Expected delta
- $0/yr ($0/mo · 0.0%)
ⓘ Screening estimate from a state-policy table — verify with the county assessor before closing.
Climate risk First Street
- Flood 1/10 Low FEMA zone X (unshaded) · 0% chance over 30 yrs
- Wildfire 5/10 Major
- Heat 8/10 Severe 7 d/yr ≥110°F today · 25 d/yr by 30 yrs out
- Wind 6/10 Major 27% chance of damaging wind over 30 yrs
- Air quality 2/10 Low 1 unhealthy d/yr today · 1 by 30 yrs out
Nearby sold comps map
Loading sold comps map…
Walkable amenities ~0.75 mi
Loading nearby amenities…
Taxation est. · year 1
- Rental income
- $26,356
- − Mortgage interest
- −$13,668
- − Property taxes
- −$7,614
- − Insurance
- −$1,220
- − Repairs & maintenance
- −$2,108
- − Management
- −$2,108
- − HOA
- −$420
- − Depreciation
- −$7,098
- Taxable loss
- −$7,881
- Est. tax savings @ 24.0%
- +$1,892
- After-tax cash flow
- $-1,896/yr
For passive investors: Depreciation is non-cash, so a rental often shows a tax loss while cash-flowing — sheltering income. Rental losses are passive: they offset passive income freely, and up to $25,000/yr can offset ordinary (W-2) income if you actively participate and your MAGI is under $100k (phasing out to $0 by $150k); unused losses carry forward. On sale, claimed depreciation is recaptured at up to 25%, and gains may owe capital-gains tax (a 1031 exchange can defer both). Figures are a year-1 estimate at your 24.0% rate — not tax advice; consult a CPA.
Schools (NCES district)
- District
- Crandall ISD
- NCES district ID
- 4815510
- Math proficiency
- 36% ▼ -13.00%
- Reading proficiency
- 42% ▼ -8.00%
- Median HH income
- $70,076
- Composite
- 35.57/100
- National rank
- #4901
- State rank
- #351 of 826 in TX
Livability — Heartland
No livability data for this city. (Only ~50 U.S. cities are tracked.)
Census & demographics
- Census place
- Heartland, TX
- County
- Kaufman County · 122,338 people
- Metro
- Dallas-Fort Worth-Arlington, TX
- Population (ZIP)
- 84,799
- Household income
- $103,673
- Rent vs Own
- Severe rent burden
- 1306.0
Population outlook (Kaufman County) Hauer SSP2
- Today (2025)
- 138,716 people
- By 2030
- 150,815 · +8.7%
- By 2040
- 174,877 · +26.1%
- By 2050
- 198,020 · +42.8%
- By 2075
- 251,908 · +81.6%
- By 2100
- 285,325 · +105.7%
Race, ethnicity, and origin ACS 2023
- Neighborhood character
- Diverse neighborhood (Simpson 0.68)
- Race & ethnicity
- White 45% Black 25% Hispanic / Latino 23% Two or more races 14% Asian 3%
- Hispanic origin (detail)
- Mexican 18% Puerto Rican 1%
- Common ancestry
- Italian 2% Slovak 1% Portuguese 1%
- Foreign-born
- 12% · Canada, Vietnam
- Languages at home
- 79% English-only · Spanish 14% Arabic 1% Vietnamese 1%
Political lean MEDSL · Kaufman
- 2024 margin
- Strong R (+27.9) · D 35.6% · R 63.5%
- 2008→2024 swing
- +7.9pp toward D · 2008: -35.8pp · 2024: -27.9pp
- All cycles
- 2024: R+27.9 2020: R+33.9 2016: R+47.0 2012: R+44.4 2008: R+35.8
Not yet ingested
- Civics
- —
Market trends
- HPI YoY
- ▼ -102.93%
- Current HPI
- 148.5749
- Rent YoY
- ▲ 1.42%
- Metro
- Dallas-Fort Worth-Arlington, TX
- State GDP YoY
- ▲ 3.95%
- F500 in state
- 110
Industry mix (Fortune 500 HQ in TX)
| Industry | F500 HQs | Revenue |
|---|---|---|
| Energy | 16 | $1,198B |
|
||
| Technology | 5 | $198B |
|
||
| Engineering / Construction | 4 | $72B |
|
||
| Energy Services | 3 | $60B |
|
||
| Utilities | 3 | $41B |
|
||
| Healthcare | 2 | $330B |
|
||
Price history
+18.4% since first listed36 events — show timeline
- 2026-06-13 Price Changed $244,000 NTREIS
- 2026-06-12 Price Changed $245,000 NTREIS
- 2026-05-30 Price Changed $245,500 NTREIS
- 2026-05-17 Price Changed $246,000 NTREIS
- 2026-05-03 Listed $248,000 NTREIS
- 2025-07-21 Rental Removed $2,150 NTREIS
- 2025-07-14 Listed $255,000 NTREIS
- 2025-06-30 Listing Removed — NTREIS
- 2025-06-14 Listed for Rent $2,150 NTREIS
- 2025-05-23 Price Changed $255,000 NTREIS
- 2025-04-29 Price Changed $259,999 NTREIS
- 2025-04-22 Price Changed $261,200 NTREIS
- 2025-04-17 Price Changed $262,000 NTREIS
- 2025-03-27 Price Changed $264,500 NTREIS
- 2025-03-16 Listed $269,000 NTREIS
- 2024-12-04 Rental Removed $2,300 NTREIS
- 2024-11-23 Listed for Rent $2,300 NTREIS
- 2024-11-14 Price Changed $264,800 NTREIS
- 2024-10-20 Price Changed $265,000 NTREIS
- 2024-10-14 Price Changed $270,000 NTREIS
- 2024-10-04 Listed $275,000 NTREIS
- 2023-08-23 Sold (Public Records) — Public Records
- 2023-08-21 Sold (MLS) — NTREIS
- 2023-06-08 Pending — NTREIS
- 2023-05-12 Price Changed $280,000 NTREIS
- 2023-04-21 Listed $290,000 NTREIS
- 2021-09-20 Sold (Public Records) — Public Records
- 2021-09-13 Sold (MLS) — NTREIS
- 2021-09-13 Sold (MLS) — HCBOR
- 2021-08-13 Pending — NTREIS
- 2021-08-09 Listed $250,000 HCBOR
- 2021-08-06 Listed $250,000 NTREIS
- 2018-03-23 Sold (MLS) — NTREIS
- 2018-02-11 Relisted — NTREIS
- 2018-01-05 Pending — NTREIS
- 2017-11-13 Listed $206,148 NTREIS
Property tax history
+30.7%/yrLatest (2025): $7,614 · -4.3% YoY. Source: county tax records.
Cash-flow waterfall
monthlySold comps — $/sqft
last 12 mo · ≤1 miLoading sold comps…