 6-Plex
1285 Lancers Ln · Redding, CA
Flood risk 1/10 · Minimal
- FEMA flood zone
- X (unshaded)
- Chance of flooding over 30 yrs
- 0.0%
- Est. flood insurance / yr
- $507 – $1,088
Fire risk 7/10 · Major
- Est. fire insurance / yr
- $659 – $1,223
Heat risk 8/10 · Major
- Hot days now (above 105°F)
- 7 days/yr
- Hot days in 30 yrs
- 16 days/yr
Wind risk 1/10 · Minimal
- Chance of severe wind over 30 yrs
- —
Air-quality risk 10/10 · Severe
- Unhealthy air days now
- 41 days/yr
- Unhealthy air days in 30 yrs
- 48 days/yr
Risk factors via First Street. Map © Google.
Why this score? — see what drove the B- grade
The composite is a weighted blend of 9 inputs, each scored 0–100. Each bar is that input's sub-score; the figure is the points it added to the 100-point composite (weight × sub-score).
- Cash flow +28.9/30.0
- DSCR +10.0/10.0
- ARV discount +7.5/15.0
- 1% rule +6.9/10.0
- Schools +4.6/10.0
- Rent growth +4.0/5.0
- Livability +3.8/5.0
- Condition / age +2.5/5.0
- Appreciation +0.0/10.0
$899,000
🖨 Deal sheet (PDF) 📄 Offer letter ✓ Due diligence
Multi-family units
County records classify this as Multi-Family (5+ Unit). Listing-text estimate: 6 units. confirmed
5+ unit building — per-unit beds/baths from public records are typically unavailable; the breakdown below (if shown) is an estimate from the listing text.
Listing remarks
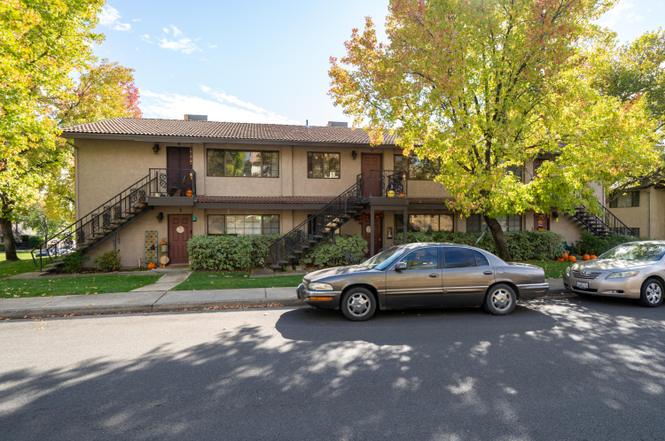
Two story 6-plex in popular location across from Home Depot. 6 spacious, all-electric 1,060 sf 2 bedroom, 2 bath units and one separate coin-op laundry room servicing the 6-plex. All units are now month to month tenancies.
Key facts
- Two story 6 plex
- All electric
- Built 1986
Tags
Property features AI
Exterior
- Parking: Off-street parking; On-street parking
- Home design: Residential income property
- Construction: Stucco construction
- Exterior features: Conforming zoning
Interior
- Heating & cooling: Electric forced-air heating; Central cooling
- Interior features: Has heating and cooling
Neighborhood map
What this means for you Summary
Snapshot
- This is a 6 × 2-bed/2.0-bath units multifamily listed at $899k.
Deal economics
- At list price, monthly cash flow is $3k ($36k/yr) — positive. Per door: $507/mo.
- The deal already cash-flows at list — no discount required.
- Meets the 1% rule at list price ($11k rent vs $899k).
- Recommended offer: $791k (12.0% below list) — sets the bar for market timing.
- Cap rate 10.3% vs local median 3.3% in Redding — top-decile yield for the area; either an underpriced asset or a hidden risk that comps aren't pricing in. Stress-test before assuming the spread holds.
Location & tenants
- Location reads 76/100 on livability (#106 in CA, #3,726 nationally) — a middle-class / working-renter tenant base. Strengths: amenities A+, commute A+, health & safety A+; Watch: employment C-, crime F, cost of living F.
- Shasta Union High (urban): math 41% / reading 67% proficiency, ranked #122 of 517 in CA (top 24%) — acceptable for families but not a draw, mixed tenant base, ~2y average lease; only 16% free/reduced lunch — higher-income household profile.
- Market conditions: Rents rising fast (+6.0%/yr); 393 active listings in the ZIP; 22 comparable units currently listed for rent nearby; rentals at typical pace (median 14d on market — plan ~3-4 weeks tenant-placement turnaround); 246 units permitted in Shasta County in 2024 (0 in 5+ unit buildings).
- At $10,721/mo this rent would consume 178% of the median local household income ($72k/yr) (locally 1668% of renters already pay >50% of income on rent) — very limited rent-growth headroom before tenants either downsize or default.
Forward outlook
- Local home prices are declining (-3.0%/yr); year-one equity from $6k of loan paydown is wiped out by about $27k of value loss. Plan a longer hold.
- Shasta County population projected to shrink 9% by 2050 — rents likely to lag national; underwrite the cash flow, not the appreciation.
- At projected returns (-3.0% appreciation + 6.0% rent growth), your $252k cash investment doubles in ~7 years — after that, you're playing with house money.
Negotiation context
- It's been on market 605 days — a 12% lower offer ($791k) is reasonable based on typical stale-listing flexibility.
- Current owner paid $100k; list at $899k implies a 799% gain — meaningful room to come down on a strong offer.
Risks & watch-outs
- Climate carrying-cost: major wildfire risk; extreme-heat days projected 7→16/yr by 2055 (HVAC capex compounding) — expect insurance premiums to compound above CPI over the hold.
Questions for the listing agent
- It's been on market 605 days. Have you received any prior offers? Is the seller open to a 12% concession, seller financing, or rate buy-down credit?
- Can we see the unit-by-unit rent roll, current vacancy, and any below-market leases? What's the average tenancy length?
- What capital expenditures (roof, boiler, parking lot, exteriors) have been made in the last 5 years, and what's planned in the next 2?
- Why hasn't it sold? Are there any deal-killer items the seller is aware of (foundation, flood, title, zoning, code violations)?
- Is there a deadline driving the sale (1031 exchange, divorce, estate, relocation)? That informs how much negotiation room exists.
- Schools are B-rated — typically a magnet for longer-tenancy family renters. What's the average tenant stay here, and is there a school-zone premium baked into asking?
- Crime grade is F in this area — have there been break-ins, vandalism, or insurance claims at this property in the last 3 years? What carrier currently insures it and at what premium?
- What's the average days-on-market for RENTAL listings here right now (not sales)? A rising rental-DOM trend means longer vacancies and softer asking-rent achievability than the comps imply.
- What's the recent tenant-quality profile in this submarket — average credit score on applications, eviction rate, late-payment / NSF rate, and stable-employment percentage? A property-management company in the area should have these aggregated.
- How much new apartment / multifamily construction is in the pipeline within 1–3 miles? Heavy new supply (>2% of stock underway) typically softens rents 12–24 months out; light construction supports rent growth.
Investment metrics
- 1% rule
- 1.19% ✓
- Cap rate
- 10.35%
- Cash-on-cash
- 14.49%
- DSCR
- 1.64
- GRM
- 7.0
CMA / ARV
No comps found within radius.
Show comp detail 9 sales within ~0.75 mi
| Address | Dist | Beds/Ba | Sqft | Sold | Price | $/sf | Match |
|---|---|---|---|---|---|---|---|
| 1313 Lancers Ln | 0.03mi | —/— | — | 8mo | $730,000 | — | 80 |
| 1155 Brandon Ct | 0.13mi | —/— | — | 11mo | $765,413 | — | 72 |
| 1253 Brandon Ct | 0.12mi | —/— | — | 13mo | $1,345,000 | — | 71 |
| 1255 Burton Ct | 0.07mi | —/— | — | 17mo | $1,181,750 | — | 70 |
| 1148 Burton Dr | 0.11mi | —/— | — | 16mo | $795,000 | — | 68 |
| 1136 Burton Dr | 0.12mi | —/— | — | 16mo | $795,000 | — | 68 |
| 1180 Brandon Ct | 0.15mi | —/— | — | 16mo | $989,000 | — | 68 |
| 1112 Burton Dr | 0.15mi | —/— | — | 21mo | $875,000 | — | 63 |
| 1383 Browning St | 0.34mi | —/— | — | 16mo | $810,000 | — | 59 |
Match score weights: distance 35% · size 25% · config 20% · recency 20%. Top-matched comps best support the ARV.
Projected returns pro-forma
-3.0% appreciation · 5.98% rent growth · sell at horizon
- IRR
- 7.9%
- Equity multiple
- 1.32×
- Total profit
- $80,666
- Equity at exit
- $134,044
- IRR
- 19.4%
- Equity multiple
- 2.84×
- Total profit
- $462,600
- Equity at exit
- $77,729
Cash invested: $251,720 (down + closing). Projections, not guarantees.
Landlord ↔ Tenant lean methodology
- Overall (STATE)
- 18 Strongly Tenant-Friendly
- State California
- 18 Strongly Tenant-Friendly · D+13
- County
- — inherits STATE
- City
- — inherits STATE
ZIP-level market 96003
- Rents YoY
- 6.0%
- Active inventory
- 393
- Price-to-rent
- 41.9×
Monthly cashflow live
- Estimated rent
- $10,721 high interval (Pro) →
- Mortgage (P&I)
- −$4,714
- Tax from tax record
- −$342 /mo · $4,098/yr
- Insurance
- −$375
- HOA
- −$0
- Vacancy / Maint / Mgmt
- −$2,251
- Net cashflow
- $3,039
Break-even live
Sensitivity live
| Price | -10% $3,548 | -5% $3,293 | +0% $3,039 | +5% $2,785 | +10% $2,530 |
|---|---|---|---|---|---|
| Rent | -10% $2,192 | -5% $2,616 | +0% $3,039 | +5% $3,463 | +10% $3,886 |
| Rate | -1.0pp $3,492 | -0.5pp $3,268 | base $3,039 | +0.5pp $2,806 | +1.0pp $2,569 |
6-unit breakdown (identical units grouped — click to expand)
| Units | Beds | Baths | Est. rent |
|---|---|---|---|
| 6× units | 2 | 2 | $10,722 |
| #1 | 2 | 2 | $1,787 |
| #2 | 2 | 2 | $1,787 |
| #3 | 2 | 2 | $1,787 |
| #4 | 2 | 2 | $1,787 |
| #5 | 2 | 2 | $1,787 |
| #6 | 2 | 2 | $1,787 |
| Total (6 units) | $10,721 | ||
UW: 25.0% down · 7.5% · 30yr · 1.5% tax · 5.0% vac · 8.0% maint · 8.0% mgmt
Financing live
Cash to close
- Down payment
- $224,750
- Closing costs
- $26,970
- Reserves months
- —
- Total cash needed
- —
Loan-product check · same deal, 3 products live
Conventional
25% down · 7.5% · 30yr
- Down + closing
- —
- Monthly P&I
- —
- Monthly cashflow
- —
- DSCR
- —
- Eligible?
- —
Personal DTI + credit; lowest rate.
DSCR
20% down · 8.5% · 30yr
- Down + closing
- —
- Monthly P&I
- —
- Monthly cashflow
- —
- DSCR
- —
- Eligible?
- —
No personal income docs; deal must DSCR.
Hard money
10% down · 12.0% · 12mo
- Down + closing
- —
- Monthly P&I
- —
- Monthly cashflow
- —
- DSCR
- —
- Eligible?
- —
Short-term bridge; refi at stabilization.
Rent comps 22 comps
| Address | Beds | Baths | Sqft | Rent | $/sqft | DOM | Units | Dist |
|---|---|---|---|---|---|---|---|---|
| 1233 Bundy Ct Unit 6 Redding, CA | 2.0 | 2.0 | 1000 | $1,595 | $1.59 | 14d | 1 | 0.02mi |
| 1232 Burton Ct Unit 3 Redding, CA | 2.0 | 1.5 | 900 | $1,395 | $1.55 | 14d | 1 | 0.09mi |
| 1377 Browning St Unit B Redding, CA | 3.0 | 2.5 | 2050 | $2,395 | $1.17 | 14d | 1 | 0.35mi |
| 1230 Canby Rd Redding, CA | 2.0 | 1.0 | 743 | $1,495 | $2.01 | 14d | 1 | 0.38mi |
| 1252 Old Alturas Rd Redding, CA | 3.0 | 2.0 | 1175 | $2,250 | $1.91 | 14d | 1 | 0.42mi |
| 1580 Dana Dr Unit 3 Redding, CA | 2.0 | 1.5 | 950 | $1,450 | $1.53 | 14d | 1 | 0.43mi |
| 1238 Old Alturas Rd Redding, CA | 3.0 | 2.0 | 1175 | $2,350 | $2.00 | 14d | 1 | 0.43mi |
| 1256 Old Alturas Rd Redding, CA | 3.0 | 2.0 | 1387 | $2,350 | $1.69 | 14d | 1 | 0.43mi |
| 1230 Old Alturas Rd Redding, CA | 3.0 | 2.0 | 1387 | $2,350 | $1.69 | 14d | 1 | 0.47mi |
| 1701 Dana Dr Redding, CA | 2.0–3.0 | 1.5 | 1070 | $1,675 | $1.57 | 14d | 1 | 0.53mi |
| 870 Mission Sierra Ct #26 Redding, CA | 2.0 | 2.5 | 1331 | $1,995 | $1.50 | 14d | 1 | 0.56mi |
| 550 Mission de Oro Dr Redding, CA | 3.0 | 2.0 | 1429 | $1,995 | $1.40 | 22d | 1 | 0.93mi |
| 1263 Snowcap Trl Redding, CA | 2.0 | 2.0 | 1456 | $2,095 | $1.44 | 14d | 1 | 0.94mi |
| 1975 Bechelli Ln Redding, CA | 2.0 | 2.0 | 1347 | $1,850 | $1.37 | 22d | 1 | 1.01mi |
| 2351 Victor Ave Redding, CA | 2.0 | 1.5 | 900 | $1,400 | $1.56 | 14d | 1 | 1.26mi |
| 2155 Park Marina Dr Redding, CA | 2.0 | 1.0 | 905 | $1,400 | $1.55 | 14d | 1 | 1.28mi |
| 381 Bountiful Path Redding, CA | 3.0 | 2.5 | 3172 | $2,750 | $0.87 | 14d | 1 | 1.32mi |
| 500 Hilltop Dr Redding, CA | 2.0–3.0 | 2.0–3.0 | 1282 | $1,700 | $1.33 | 14d | 4 | 1.35mi |
| 1729 Marigold Way Redding, CA | 3.0 | 2.0 | 1344 | $2,295 | $1.71 | 14d | 1 | 1.38mi |
| 1978 Goren Ct Redding, CA | 3.0 | 2.0 | 1561 | $2,650 | $1.70 | 14d | 1 | 1.40mi |
| 1995 Lugano Trl Redding, CA | 3.0 | 2.5 | 1616 | $2,350 | $1.45 | 14d | 1 | 1.45mi |
| 1949 Trumpet Dr Redding, CA | 3.0 | 2.0 | 1584 | $2,295 | $1.45 | 22d | 1 | 1.46mi |
Listing history 22 events
-
2026-06-21days on market $899,000 Active 605 DOM
-
2026-06-19days on market $899,000 Active 603 DOM
-
2026-06-18days on market $899,000 Active 602 DOM
-
2026-06-17days on market $899,000 Active 601 DOM
-
2026-06-16days on market $899,000 Active 600 DOM
-
2026-06-15days on market $899,000 Active 599 DOM
-
2026-06-14days on market $899,000 Active 597 DOM
-
2026-06-13days on market $899,000 Active 596 DOM
-
2026-06-10days on market $899,000 Active 594 DOM
-
2026-06-09days on market $899,000 Active 593 DOM
-
2026-06-08days on market $899,000 Active 592 DOM
-
2026-06-07days on market $899,000 Active 591 DOM
-
2026-06-05days on market $899,000 Active 588 DOM
-
2026-06-03days on market $899,000 Active 587 DOM
-
2026-06-02days on market $899,000 Active 586 DOM
-
2026-06-01days on market $899,000 Active 585 DOM
-
2026-05-31days on market $899,000 Active 584 DOM
-
2026-05-30days on market $899,000 Active 583 DOM
-
2026-03-20price $899,000
-
2025-01-02price $925,000
-
2024-10-23$949,000 Active
-
1997-05-01soldstatus $100,000
ⓘ Source: listings_history table (triggers on properties + properties_extension) + one-shot
backfill from property_details.listing_events for pre-trigger history.
Tax reassessment forecast CA · Resets to sale price
- Current annual tax
- $4,098 · $342/mo
- Projected year-2 tax
- $6,832 · $569/mo
- Expected delta
- +$2,734/yr (+$228/mo · 66.7%)
ⓘ Screening estimate from a state-policy table — verify with the county assessor before closing.
Climate risk First Street
- Flood 1/10 Low FEMA zone X (unshaded) · 0% chance over 30 yrs
- Wildfire 7/10 Severe
- Heat 8/10 Severe 7 d/yr ≥105°F today · 16 d/yr by 30 yrs out
- Wind 1/10 Low
- Air quality 10/10 Extreme 41 unhealthy d/yr today · 48 by 30 yrs out
Nearby sold comps map
Loading sold comps map…
Walkable amenities ~0.75 mi
Loading nearby amenities…
Taxation est. · year 1
- Rental income
- $128,652
- − Mortgage interest
- −$50,358
- − Property taxes
- −$4,098
- − Insurance
- −$4,495
- − Repairs & maintenance
- −$10,292
- − Management
- −$10,292
- − Depreciation
- −$26,153
- Taxable income
- $22,964
- Est. tax owed @ 24.0%
- −$5,511
- After-tax cash flow
- $30,957/yr
For passive investors: Depreciation is non-cash, so a rental often shows a tax loss while cash-flowing — sheltering income. Rental losses are passive: they offset passive income freely, and up to $25,000/yr can offset ordinary (W-2) income if you actively participate and your MAGI is under $100k (phasing out to $0 by $150k); unused losses carry forward. On sale, claimed depreciation is recaptured at up to 25%, and gains may owe capital-gains tax (a 1031 exchange can defer both). Figures are a year-1 estimate at your 24.0% rate — not tax advice; consult a CPA.
Schools (NCES district)
- District
- Shasta Union High
- NCES district ID
- 0636600
- Math proficiency
- 41% ▲ 3.00%
- Reading proficiency
- 67% ▲ 9.00%
- Median HH income
- $50,080
- Composite
- 46.01/100
- National rank
- #2532
- State rank
- #122 of 517 in CA
Livability — Redding
- Score
- 76/100
- State rank
- #106
- US rank
- #3726
Category grades
Schools grade is shown separately in the Schools card above.
Census & demographics
- Census place
- Redding, CA
- County
- Shasta County · 147,641 people
- City population
- 112,523
- Metro
- Redding, CA
- Population (ZIP)
- 44,923
- Household income
- $72,445
- Rent vs Own
- Severe rent burden
- 1668.0
Population outlook (Shasta County) Hauer SSP2
- Today (2025)
- 179,231 people
- By 2030
- 176,953 · -1.3%
- By 2040
- 169,982 · -5.2%
- By 2050
- 162,547 · -9.3%
- By 2075
- 145,649 · -18.7%
- By 2100
- 123,025 · -31.4%
Race, ethnicity, and origin ACS 2023
- Neighborhood character
- Predominantly White (76%)
- Race & ethnicity
- White 76% Hispanic / Latino 11% Two or more races 10% Asian 4% Native American 1% Black 1%
- Hispanic origin (detail)
- Mexican 7%
- Common ancestry
- Italian 5% Slovak 3% Lithuanian 3%
- Foreign-born
- 6% · Canada, China
- Languages at home
- 92% English-only · Spanish 3% German/W. Germanic 1% Other Asian/Pacific 1%
Political lean MEDSL · Shasta
- 2024 margin
- Solid R (+36.5) · D 30.5% · R 67.0% · Other 2.5%
- 2008→2024 swing
- -10.7pp toward R · 2008: -25.8pp · 2024: -36.5pp
- All cycles
- 2024: R+36.5 2020: R+33.1 2016: R+37.4 2012: R+30.3 2008: R+25.8
Not yet ingested
- Civics
- —
Market trends
- HPI YoY
- ▼ -181.66%
- Current HPI
- 152.3069
- Rent YoY
- ▲ 5.98%
- Metro
- Redding, CA
- State GDP YoY
- ▲ 3.21%
- F500 in state
- 116
Industry mix (Fortune 500 HQ in CA)
| Industry | F500 HQs | Revenue |
|---|---|---|
| Technology | 27 | $1,492B |
|
||
| Financial Services | 3 | $174B |
|
||
| Retail | 3 | $44B |
|
||
| Insurance | 3 | $26B |
|
||
| Media / Entertainment | 2 | $115B |
|
||
| Pharmaceuticals / Biotech | 2 | $62B |
|
||
Price history
+799.0% since first listed4 events — show timeline
- 2026-03-20 Price Changed $899,000 SAOR
- 2025-01-02 Price Changed $925,000 SAOR
- 2024-10-23 Listed $949,000 SAOR
- 1997-05-01 Sold (Public Records) $100,000 Public Records
Property tax history
+1.6%/yrLatest (2025): $4,098 · +1.5% YoY. Source: county tax records.
Cash-flow waterfall
monthlySold comps — $/sqft
last 12 mo · ≤1 miLoading sold comps…