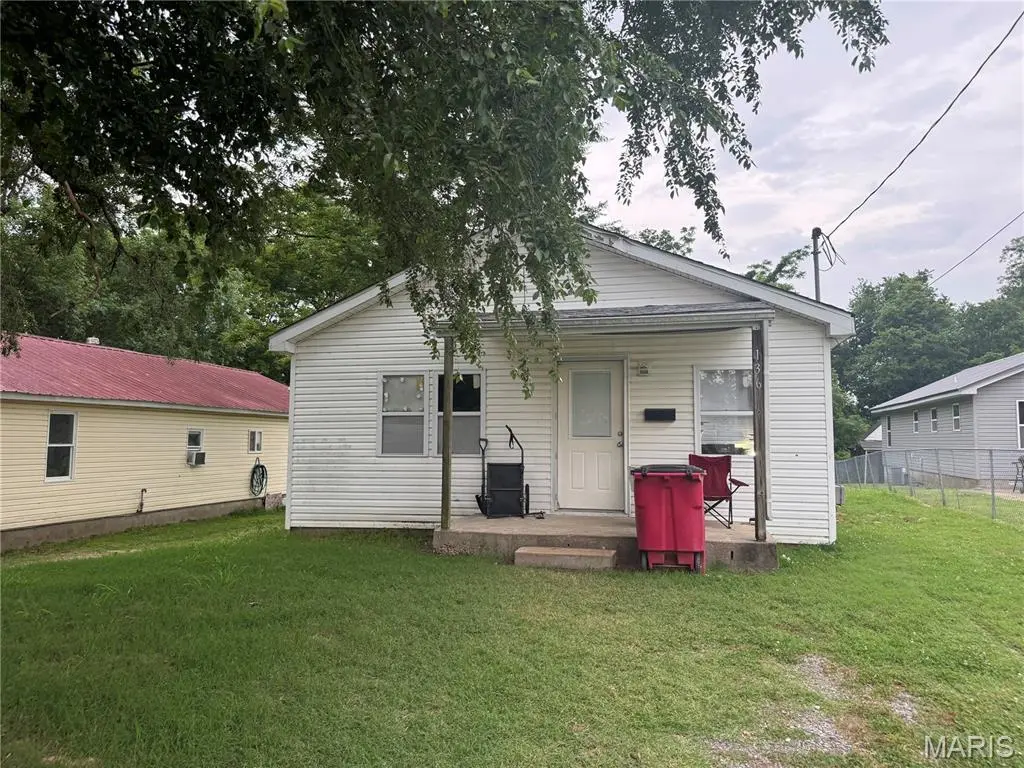
136 N 6th St · Sikeston, MO
Flood risk 1/10 · Minimal
- FEMA flood zone
- X
- Chance of flooding over 30 yrs
- 0.0%
- Est. flood insurance / yr
- $507 – $1,088
Fire risk 1/10 · Minimal
- Est. fire insurance / yr
- $1,054 – $1,958
Heat risk 6/10 · Moderate
- Hot days now (above 110°F)
- 7 days/yr
- Hot days in 30 yrs
- 21 days/yr
Wind risk 3/10 · Minor
- Chance of severe wind over 30 yrs
- 5.0%
Air-quality risk 2/10 · Minimal
- Unhealthy air days now
- 0 days/yr
- Unhealthy air days in 30 yrs
- 1 days/yr
Risk factors via First Street. Map © Google.
Why this score? — see what drove the B+ grade
The composite is a weighted blend of 9 inputs, each scored 0–100. Each bar is that input's sub-score; the figure is the points it added to the 100-point composite (weight × sub-score).
- Cash flow +30.0/30.0
- ARV discount +15.0/15.0
- 1% rule +10.0/10.0
- DSCR +10.0/10.0
- Livability +3.2/5.0
- Schools +2.8/10.0
- Rent growth +2.5/5.0
- Condition / age +2.2/5.0
- Appreciation +0.0/10.0
$44,900
🖨 Deal sheet 📄 Offer letter ✓ Due diligence
Listing remarks MLS
Great opportunity for investors! This 2-bedroom property offers solid potential as a rental or flip, with a manageable layout and room to add value. Whether you're expanding your portfolio or getting started in real estate, this is a smart, affordable option.
Key facts
- 8,276 sq ft lot
- Built 1940
- Listed 357 days
Neighborhood map
What this means for you Summary
Snapshot
- This is a 2-bed/1.5-bath single-family listed at $45k. Condition is rated fair.
Deal economics
- At list price, monthly cash flow is $476 ($6k/yr) — positive.
- The deal already cash-flows at list — no discount required.
- Meets the 1% rule at list price ($996 rent vs $45k).
- Recommended offer: $40k (12.0% below list) — sets the bar for market timing.
- Cap rate 19.0% vs local median 4.0% in Sikeston — top-decile yield for the area; either an underpriced asset or a hidden risk that comps aren't pricing in. Stress-test before assuming the spread holds.
Location & tenants
- Location reads 64/100 on livability (#319 in MO) — a middle-class / working-renter tenant base. Strengths: cost of living A+, housing A+, health & safety A+; Watch: employment D, schools D-, crime F.
- Sikeston R-6 (town): math 33% / reading 34% proficiency, ranked #243 of 324 in MO (top 75%) — families likely to look elsewhere, expect single-tenant / working-renter base with shorter leases; 61% free/reduced lunch — lower-income household profile, screen leases tightly.
- Market conditions: 19 active listings in the ZIP; 123 units permitted in Scott County in 2024 (32 in 5+ unit buildings).
Forward outlook
- Local home prices are declining (-3.0%/yr); year-one equity from $310 of loan paydown is wiped out by about $1k of value loss. Plan a longer hold.
- Scott County population projected at -16% by 2050 — secular population decline; favor cash flow + early exit over multi-decade hold.
- At projected returns (-3.0% appreciation + 3.0% rent growth), your $13k cash investment doubles in ~3 years — after that, you're playing with house money.
Negotiation context
- It's been on market 358 days — a 12% lower offer ($40k) is reasonable based on typical stale-listing flexibility.
- 2 sale attempts; this cycle's ask has dropped $10k (18%) from the opening price — seller is motivated, your offer sets the floor, not the list.
Risks & watch-outs
- Watch-outs: built in 1940 — expect roof / HVAC / electrical / plumbing capex.
- Climate carrying-cost: extreme-heat days projected 7→21/yr by 2055 (HVAC capex compounding) — expect insurance premiums to compound above CPI over the hold.
Questions for the listing agent
- It's been on market 358 days. Have you received any prior offers? Is the seller open to a 12% concession, seller financing, or rate buy-down credit?
- Have any recent inspections been done? Can we get a copy of the seller's disclosures and any deferred-maintenance estimates?
- Built in 1940 — when were the roof, HVAC, electrical panel, plumbing, and water heater last replaced?
- Why hasn't it sold? Are there any deal-killer items the seller is aware of (foundation, flood, title, zoning, code violations)?
- Is there a deadline driving the sale (1031 exchange, divorce, estate, relocation)? That informs how much negotiation room exists.
- Schools are D-rated, which usually means shorter tenancies and higher turnover. Who's the typical renter profile here, and what's been the actual vacancy rate?
- Crime grade is F in this area — have there been break-ins, vandalism, or insurance claims at this property in the last 3 years? What carrier currently insures it and at what premium?
- What's the average days-on-market for RENTAL listings here right now (not sales)? A rising rental-DOM trend means longer vacancies and softer asking-rent achievability than the comps imply.
- What's the recent tenant-quality profile in this submarket — average credit score on applications, eviction rate, late-payment / NSF rate, and stable-employment percentage? A property-management company in the area should have these aggregated.
- How much new for-sale + rental construction is in the pipeline within 1–3 miles? Heavy new supply typically softens prices + rents 12–24 months out; constrained supply supports both.
Investment metrics
- 1% rule
- 2.22% ✓
- Cap rate
- 19.02%
- Cash-on-cash
- 45.47%
- DSCR
- 3.02
- GRM
- 3.8
CMA / ARV
- ARV (median comp)
- $55,969
- List price
- $44,900
- Delta
- -19.78%
- Verdict
- UNDERPRICED
- Comps
- 8 within 1.0 mi
Projected returns pro-forma
-3.0% appreciation · 3.0% rent growth · sell at horizon
- IRR
- 42.6%
- Equity multiple
- 2.84×
- Total profit
- $23,077
- Equity at exit
- $6,695
- IRR
- 48.7%
- Equity multiple
- 5.71×
- Total profit
- $59,220
- Equity at exit
- $3,882
Cash invested: $12,572 (down + closing). Projections, not guarantees.
Landlord ↔ Tenant lean methodology
- Overall (STATE)
- 81 Strongly Landlord-Friendly
- State Missouri
- 81 Strongly Landlord-Friendly · R+10
- County
- — inherits STATE
- City
- — inherits STATE
ZIP-level market 63780
- Active inventory
- 19
- Price-to-rent
- 3.8×
Monthly cashflow live
- Estimated rent
- $996 medium interval (Pro) →
- Mortgage (P&I)
- −$235
- Tax est. 1.5%
- −$56 /mo · $674/yr
- Insurance
- −$19
- HOA
- −$0
- Vacancy / Maint / Mgmt
- −$209
- Net cashflow
- $476
Break-even live
UW: 25.0% down · 7.5% · 30yr · 1.5% tax · 5.0% vac · 8.0% maint · 8.0% mgmt
Financing live
Cash to close
- Down payment
- $11,225
- Closing costs
- $1,347
- Reserves months
- —
- Total cash needed
- —
Loan-product check · same deal, 3 products live
Conventional
25% down · 7.5% · 30yr
- Down + closing
- —
- Monthly P&I
- —
- Monthly cashflow
- —
- DSCR
- —
- Eligible?
- —
Personal DTI + credit; lowest rate.
DSCR
20% down · 8.5% · 30yr
- Down + closing
- —
- Monthly P&I
- —
- Monthly cashflow
- —
- DSCR
- —
- Eligible?
- —
No personal income docs; deal must DSCR.
Hard money
10% down · 12.0% · 12mo
- Down + closing
- —
- Monthly P&I
- —
- Monthly cashflow
- —
- DSCR
- —
- Eligible?
- —
Short-term bridge; refi at stabilization.
Listing history 20 events
-
2026-06-19days on market $44,900 Active 358 DOM
-
2026-06-18days on market $44,900 Active 357 DOM
-
2026-06-17days on market $44,900 Active 356 DOM
-
2026-06-16days on market $44,900 Active 355 DOM
-
2026-06-15days on market $44,900 Active 354 DOM
-
2026-06-14days on market $44,900 Active 352 DOM
-
2026-06-13days on market $44,900 Active 351 DOM
-
2026-06-10days on market $44,900 Active 349 DOM
-
2026-06-09days on market $44,900 Active 348 DOM
-
2026-06-08days on market $44,900 Active 347 DOM
-
2026-06-07days on market $44,900 Active 346 DOM
-
2026-06-05days on market $44,900 Active 343 DOM
-
2026-06-03days on market $44,900 Active 342 DOM
-
2026-06-02days on market $44,900 Active 341 DOM
-
2026-06-01days on market $44,900 Active 340 DOM
-
2026-05-31days on market $44,900 Active 339 DOM
-
2026-05-30days on market $44,900 Active 338 DOM
-
2026-01-08status Active 259-char remark
Show marketing remark (259 chars)
Great opportunity for investors! This 2-bedroom property offers solid potential as a rental or flip, with a manageable layout and room to add value. Whether you're expanding your portfolio or getting started in real estate, this is a smart, affordable option.
-
2025-10-08price $44,900 259-char remark
Show marketing remark (259 chars)
Great opportunity for investors! This 2-bedroom property offers solid potential as a rental or flip, with a manageable layout and room to add value. Whether you're expanding your portfolio or getting started in real estate, this is a smart, affordable option.
-
2025-06-18$54,900 Active 259-char remark
Show marketing remark (259 chars)
Great opportunity for investors! This 2-bedroom property offers solid potential as a rental or flip, with a manageable layout and room to add value. Whether you're expanding your portfolio or getting started in real estate, this is a smart, affordable option.
ⓘ Source: listings_history table (triggers on properties + properties_extension) + one-shot
backfill from property_details.listing_events for pre-trigger history.
Climate risk First Street
- Flood 1/10 Low FEMA zone X · 0% chance over 30 yrs
- Wildfire 1/10 Low
- Heat 6/10 Major 7 d/yr ≥110°F today · 21 d/yr by 30 yrs out
- Wind 3/10 Moderate 5% chance of damaging wind over 30 yrs
- Air quality 2/10 Low 0 unhealthy d/yr today · 1 by 30 yrs out
Nearby sold comps map
Loading sold comps map…
Walkable amenities ~0.75 mi
Loading nearby amenities…
Taxation est. · year 1
- Rental income
- $11,949
- − Mortgage interest
- −$2,515
- − Property taxes
- −$674
- − Insurance
- −$224
- − Repairs & maintenance
- −$956
- − Management
- −$956
- − Depreciation
- −$1,306
- Taxable income
- $5,318
- Est. tax owed @ 24.0%
- −$1,276
- After-tax cash flow
- $4,440/yr
For passive investors: Depreciation is non-cash, so a rental often shows a tax loss while cash-flowing — sheltering income. Rental losses are passive: they offset passive income freely, and up to $25,000/yr can offset ordinary (W-2) income if you actively participate and your MAGI is under $100k (phasing out to $0 by $150k); unused losses carry forward. On sale, claimed depreciation is recaptured at up to 25%, and gains may owe capital-gains tax (a 1031 exchange can defer both). Figures are a year-1 estimate at your 24.0% rate — not tax advice; consult a CPA.
Condition & rehab AI · 1 photo
This single-family home requires significant repairs and updates to improve its condition and value. Investors can expect a substantial return on investment by addressing the exterior, interior, and landscaping needs.
Repairs flagged
- Major exterior siding — Significant wear and tear
- Major roof — No visible damage, but age is implied
- Major flooring — No visible flooring, but age is implied
- Major interior walls/paint — No visible walls or paint, but age is implied
- Major windows — No visible windows, but age is implied
- Major HVAC/mechanicals — No visible HVAC or mechanicals, but age is implied
- Major landscaping — Overgrown lawn and cluttered yard
Value-add opportunities
- Both paint exterior — Enhances curb appeal and resale value
- Both repair roof — Improves structural integrity and reduces maintenance costs
- Both replace flooring — Updates interior and improves comfort
- Both paint interior walls — Freshens interior and enhances resale value
- Both repair windows — Improves energy efficiency and resale value
- Both replace HVAC/mechanicals — Enhances comfort and reduces utility costs
- Both landscape — Enhances curb appeal and resale value
Renovation cost estimate screening
| Repair item | Severity | Est. cost |
|---|---|---|
| exterior siding · Significant wear and tear | Major | $15,000–50,000 |
| roof · No visible damage, but age is implied | Major | $15,000–50,000 |
| flooring · No visible flooring, but age is implied | Major | $15,000–50,000 |
| interior walls/paint · No visible walls or paint, but age is implied | Major | $15,000–50,000 |
| windows · No visible windows, but age is implied | Major | $15,000–50,000 |
| HVAC/mechanicals · No visible HVAC or mechanicals, but age is implied | Major | $15,000–50,000 |
| landscaping · Overgrown lawn and cluttered yard | Major | $15,000–50,000 |
| Total estimated repair cost · 7 items | $105,000–350,000 |
Value-add ROI direction
- Both paint exterior — Enhances curb appeal and resale value ↑
- Both repair roof — Improves structural integrity and reduces maintenance costs ↑
- Both replace flooring — Updates interior and improves comfort ↑
- Both paint interior walls — Freshens interior and enhances resale value ↑
- Both repair windows — Improves energy efficiency and resale value ↑
- Both replace HVAC/mechanicals — Enhances comfort and reduces utility costs ↑
- Both landscape — Enhances curb appeal and resale value ↑
ⓘ Cost ranges are severity-bucket heuristics (US national rule-of-thumb). Get contractor quotes + a written scope before underwriting a rehab budget.
Schools (NCES district)
- District
- Sikeston R-6
- NCES district ID
- 2928260
- Math proficiency
- 33% ▼ -4.00%
- Reading proficiency
- 34% ▼ -2.00%
- Median HH income
- $36,800
- Composite
- 27.85/100
- National rank
- #6879
- State rank
- #243 of 324 in MO
Livability — Sikeston
- Score
- 64/100
- State rank
- #319
- US rank
- #14606
Category grades
Schools grade is shown separately in the Schools card above.
Census & demographics
- Census place
- Sikeston, MO
- Population (ZIP)
- 6,155
Population outlook (Scott County) Hauer SSP2
- Today (2025)
- 37,964 people
- By 2030
- 36,963 · -2.6%
- By 2040
- 34,632 · -8.8%
- By 2050
- 32,024 · -15.6%
- By 2075
- 25,250 · -33.5%
- By 2100
- 18,078 · -52.4%
Race, ethnicity, and origin ACS 2023
- Neighborhood character
- Predominantly White (94%)
- Race & ethnicity
- White 94% Two or more races 4% Hispanic / Latino 2%
- Common ancestry
- Lithuanian 3% Slovak 2% Portuguese 1%
- Foreign-born
- 0%
- Languages at home
- 99% English-only · Spanish 1%
Political lean MEDSL · Scott
- 2024 margin
- Solid R (+58.9) · D 20.2% · R 79.2%
- 2008→2024 swing
- -29.5pp toward R · 2008: -29.4pp · 2024: -58.9pp
- All cycles
- 2024: R+58.9 2020: R+56.5 2016: R+55.6 2012: R+38.2 2008: R+29.4
Not yet ingested
- Civics
- —
Market trends
- HPI YoY
- ▼ -90.62%
- Current HPI
- 153.643
- Rent YoY
- —
- Metro
- —
- State GDP YoY
- ▲ 1.84%
- F500 in state
- 20
Industry mix (Fortune 500 HQ in MO)
| Industry | F500 HQs | Revenue |
|---|---|---|
| Healthcare | 1 | $163B |
|
||
| Insurance | 1 | $21B |
|
||
| Industrial Technology | 1 | $17B |
|
||
| Retail | 1 | $16B |
|
||
| Industrial Distribution | 1 | $10B |
|
||
| Utilities | 1 | $9B |
|
||
Price history
-18.2% since first listed3 events — show timeline
- 2026-01-08 Relisted — MARIS as Distributed by MLS Grid
- 2025-10-08 Price Changed $44,900 MARIS as Distributed by MLS Grid
- 2025-06-18 Listed $54,900 MARIS as Distributed by MLS Grid
Cash-flow waterfall
monthlySold comps — $/sqft
last 12 mo · ≤1 miLoading sold comps…