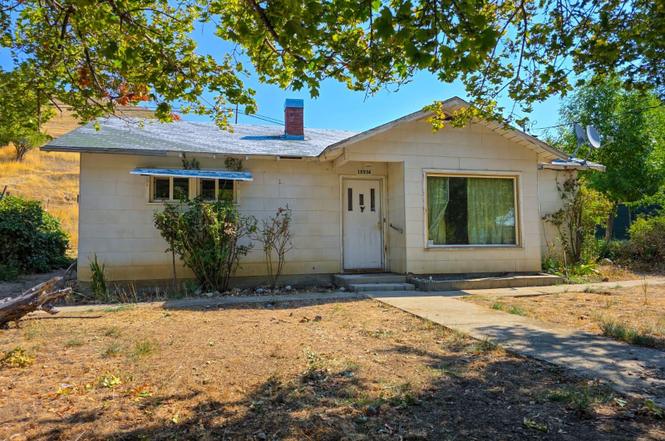
15936 First Ave · Hornbrook, CA
Flood risk 6/10 · Moderate
- FEMA flood zone
- X (unshaded)
- Chance of flooding over 30 yrs
- 0.74%
- Est. flood insurance / yr
- $507 – $1,088
Fire risk 8/10 · Major
- Est. fire insurance / yr
- $659 – $1,223
Heat risk 6/10 · Moderate
- Hot days now (above 97°F)
- 8 days/yr
- Hot days in 30 yrs
- 18 days/yr
Wind risk 1/10 · Minimal
- Chance of severe wind over 30 yrs
- —
Air-quality risk 10/10 · Severe
- Unhealthy air days now
- 33 days/yr
- Unhealthy air days in 30 yrs
- 33 days/yr
Risk factors via First Street. Map © Google.
Why this score? — see what drove the D+ grade
The composite is a weighted blend of 9 inputs, each scored 0–100. Each bar is that input's sub-score; the figure is the points it added to the 100-point composite (weight × sub-score).
- ARV discount +15.0/15.0
- Cash flow +11.8/30.0
- Appreciation +4.8/10.0
- Schools +3.9/10.0
- DSCR +3.5/10.0
- 1% rule +2.5/10.0
- Rent growth +2.5/5.0
- Condition / age +2.5/5.0
- Livability +2.4/5.0
$126,000
🖨 Deal sheet 📄 Offer letter ✓ Due diligence
Listing remarks
2 Bed, 1 Bath Home with Shop on Nearly Half an Acre – Hornbrook, CA Located in central Hornbrook, California, this 2-bedroom, 1-bath home sits on approximately 0.46 acres. The home features an open floor plan connecting the living room, kitchen, and dining area. It requires some maintenance and updates but offers solid structure and functional layout. The property includes a large detached shop that can accommodate two to three vehicles, plus multiple storage sheds. The lot is flat and usable, with room for additional development, gardening, or recreational space. There is off-street parking and mature trees offering shade. Hornbrook is approximately 10 minutes from the Oregon border,
Key facts
- Open floor plan
- Large detached shop
- Flat and usable lot
Tags
Property features AI
Exterior
- Parking: Attached or detached 2-car garage
- Utilities: Public water; Septic sewer
- Home design: Single-family residence; One story; Residential zoning (R-1)
- Construction: Wood siding; Composition roof
- Exterior features: Garden; Wood fencing; Shed(s); Workshop; Level lot
Interior
- Kitchen: Cooktop; Refrigerator
- Flooring: Carpet; Laminate; Vinyl
- Interior features: Carpet, laminate, and vinyl flooring
Neighborhood map
What this means for you Summary
Snapshot
- This is a 2-bed/1.0-bath single-family listed at $126k.
Deal economics
- At list price, monthly cash flow is $-35 ($-417/yr) — negative.
- To cash-flow at today's rent, offer at most $120k (4.9% below list).
- To meet the 1% rule (rent ≥ 1% of price), the offer needs to be $95k (24.9% below list).
- Recommended offer: $95k (24.9% below list) — sets the bar for 1% rule.
Location & tenants
- Location reads 47/100 on livability (#1,256 in CA) — a working-class tenant base; expect higher turnover. Strengths: crime A; Watch: schools F, amenities F, commute F.
- Yreka Union High (town): math 25% / reading 65% proficiency, ranked #630 of 1,400 in CA (top 45%) — families likely to look elsewhere, expect single-tenant / working-renter base with shorter leases.
- Market conditions: 87 active listings in the ZIP; 50 units permitted in Siskiyou County in 2024 (0 in 5+ unit buildings).
Forward outlook
- In year one you build about $261 of equity ($871 loan paydown + $-610 appreciation (-0.5% local appreciation)).
- Siskiyou County population projected at -26% by 2050 — secular population decline; favor cash flow + early exit over multi-decade hold.
Negotiation context
- It's been on market 287 days — a 12% lower offer ($111k) is reasonable based on typical stale-listing flexibility.
- 2 sale attempts; this cycle's ask has dropped $42k (25%) from the opening price — seller is motivated, your offer sets the floor, not the list.
- Current owner paid $60k; list at $126k implies a 110% gain — meaningful room to come down on a strong offer.
Risks & watch-outs
- Watch-outs: built in 1954 — expect roof / HVAC / electrical / plumbing capex.
- Climate carrying-cost: major flood risk; severe wildfire risk; extreme-heat days projected 8→18/yr by 2055 (HVAC capex compounding) — expect insurance premiums to compound above CPI over the hold.
Questions for the listing agent
- What do current leases actually rent for vs. the listed asking? Can we see a recent rent roll and the last 12 months of T-12 income?
- It's been on market 287 days. Have you received any prior offers? Is the seller open to a 25% concession, seller financing, or rate buy-down credit?
- Built in 1954 — when were the roof, HVAC, electrical panel, plumbing, and water heater last replaced?
- Why hasn't it sold? Are there any deal-killer items the seller is aware of (foundation, flood, title, zoning, code violations)?
- Is there a deadline driving the sale (1031 exchange, divorce, estate, relocation)? That informs how much negotiation room exists.
- Schools are F-rated, which usually means shorter tenancies and higher turnover. Who's the typical renter profile here, and what's been the actual vacancy rate?
- The area grade is low — what's the realistic commute time and amenity access for the typical tenant pool here? Any planned neighborhood developments (good or bad) we should know about?
- What's the average days-on-market for RENTAL listings here right now (not sales)? A rising rental-DOM trend means longer vacancies and softer asking-rent achievability than the comps imply.
- What's the recent tenant-quality profile in this submarket — average credit score on applications, eviction rate, late-payment / NSF rate, and stable-employment percentage? A property-management company in the area should have these aggregated.
- How much new for-sale + rental construction is in the pipeline within 1–3 miles? Heavy new supply typically softens prices + rents 12–24 months out; constrained supply supports both.
Investment metrics
- 1% rule
- 0.75% ✗
- Cap rate
- 5.96%
- Cash-on-cash
- -1.18%
- DSCR
- 0.95
- GRM
- 11.1
CMA / ARV
- ARV (on-the-fly)
- $156,060
- Comps found
- 2
Show comp detail 2 sales within ~0.75 mi
| Address | Dist | Beds/Ba | Sqft | Sold | Price | $/sf | Match |
|---|---|---|---|---|---|---|---|
| 15728 First Ave | 0.19mi | 2/1.0 | 972 (+12%) | 19mo | $175,000 | $180 | 55 |
| 14804 Oregon Rd | 0.71mi | 2/1.0 | 775 (-11%) | 1mo | $115,000 | $148 | 49 |
Match score weights: distance 35% · size 25% · config 20% · recency 20%. Top-matched comps best support the ARV.
Projected returns pro-forma
-0.48% appreciation · 3.0% rent growth · sell at horizon
- IRR
- -5.5%
- Equity multiple
- 0.75×
- Total profit
- $-8,780
- Equity at exit
- $33,564
- IRR
- 0.8%
- Equity multiple
- 1.08×
- Total profit
- $2,732
- Equity at exit
- $38,005
Cash invested: $35,280 (down + closing). Projections, not guarantees.
Landlord ↔ Tenant lean methodology
- Overall (STATE)
- 18 Strongly Tenant-Friendly
- State California
- 18 Strongly Tenant-Friendly · D+13
- County
- — inherits STATE
- City
- — inherits STATE
ZIP-level market 96044
- Home prices YoY
- -0.3%
- Active inventory
- 87
- Price-to-rent
- 11.1×
Monthly cashflow live
- Estimated rent
- $947 medium interval (Pro) →
- Mortgage (P&I)
- −$661
- Tax from tax record
- −$69 /mo · $832/yr
- Insurance
- −$52
- HOA
- −$0
- Vacancy / Maint / Mgmt
- −$199
- Net cashflow
- $-35
Break-even live
UW: 25.0% down · 7.5% · 30yr · 1.5% tax · 5.0% vac · 8.0% maint · 8.0% mgmt
Financing live
Cash to close
- Down payment
- $31,500
- Closing costs
- $3,780
- Reserves months
- —
- Total cash needed
- —
Loan-product check · same deal, 3 products live
Conventional
25% down · 7.5% · 30yr
- Down + closing
- —
- Monthly P&I
- —
- Monthly cashflow
- —
- DSCR
- —
- Eligible?
- —
Personal DTI + credit; lowest rate.
DSCR
20% down · 8.5% · 30yr
- Down + closing
- —
- Monthly P&I
- —
- Monthly cashflow
- —
- DSCR
- —
- Eligible?
- —
No personal income docs; deal must DSCR.
Hard money
10% down · 12.0% · 12mo
- Down + closing
- —
- Monthly P&I
- —
- Monthly cashflow
- —
- DSCR
- —
- Eligible?
- —
Short-term bridge; refi at stabilization.
Listing history 22 events
-
2026-06-19days on market $126,000 Active 287 DOM
-
2026-06-18days on market $126,000 Active 286 DOM
-
2026-06-17days on market $126,000 Active 285 DOM
-
2026-06-16days on market $126,000 Active 284 DOM
-
2026-06-15days on market $126,000 Active 283 DOM
-
2026-06-14days on market $126,000 Active 281 DOM
-
2026-06-12pricedays on market $126,000 Active 280 DOM
-
2026-06-09days on market $149,000 Active 277 DOM
-
2026-06-08days on market $149,000 Active 276 DOM
-
2026-06-07days on market $149,000 Active 275 DOM
-
2026-06-05days on market $149,000 Active 273 DOM
-
2026-06-04days on market $149,000 Active 271 DOM
-
2026-06-02days on market $149,000 Active 270 DOM
-
2026-06-01days on market $149,000 Active 269 DOM
-
2026-05-31days on market $149,000 Active 268 DOM
-
2026-05-31days on market $149,000 Active 267 DOM
-
2026-01-16price $149,000
-
2025-11-12historical
-
2025-09-08$168,000 Active
-
2025-09-05$168,000 Active
-
2012-11-21soldstatus $60,000
-
2002-05-09soldstatus $46,000
ⓘ Source: listings_history table (triggers on properties + properties_extension) + one-shot
backfill from property_details.listing_events for pre-trigger history.
Tax reassessment forecast CA · Resets to sale price
- Current annual tax
- $832 · $69/mo
- Projected year-2 tax
- $958 · $80/mo
- Expected delta
- +$126/yr (+$10/mo · 15.1%)
ⓘ Screening estimate from a state-policy table — verify with the county assessor before closing.
Climate risk First Street
- Flood 6/10 Major FEMA zone X (unshaded) · 74% chance over 30 yrs
- Wildfire 8/10 Severe
- Heat 6/10 Major 8 d/yr ≥97°F today · 18 d/yr by 30 yrs out
- Wind 1/10 Low
- Air quality 10/10 Extreme 33 unhealthy d/yr today · 33 by 30 yrs out
Nearby sold comps map
Loading sold comps map…
Walkable amenities ~0.75 mi
Loading nearby amenities…
Taxation est. · year 1
- Rental income
- $11,359
- − Mortgage interest
- −$7,058
- − Property taxes
- −$832
- − Insurance
- −$630
- − Repairs & maintenance
- −$909
- − Management
- −$909
- − Depreciation
- −$3,665
- Taxable loss
- −$2,643
- Est. tax savings @ 24.0%
- +$634
- After-tax cash flow
- $217/yr
For passive investors: Depreciation is non-cash, so a rental often shows a tax loss while cash-flowing — sheltering income. Rental losses are passive: they offset passive income freely, and up to $25,000/yr can offset ordinary (W-2) income if you actively participate and your MAGI is under $100k (phasing out to $0 by $150k); unused losses carry forward. On sale, claimed depreciation is recaptured at up to 25%, and gains may owe capital-gains tax (a 1031 exchange can defer both). Figures are a year-1 estimate at your 24.0% rate — not tax advice; consult a CPA.
Schools (NCES district)
- District
- Yreka Union High
- NCES district ID
- 0643410
- Math proficiency
- 25% ▼ -15.00%
- Reading proficiency
- 65% ▬ 0.00%
- Median HH income
- $34,206
- Composite
- 39.28/100
- National rank
- #8184
- State rank
- #630 of 1400 in CA
Livability — Hornbrook
- Score
- 47/100
- State rank
- #1256
- US rank
- #26373
Category grades
Schools grade is shown separately in the Schools card above.
Census & demographics
- Population (ZIP)
- 1,181
Population outlook (Siskiyou County) Hauer SSP2
- Today (2025)
- 39,337 people
- By 2030
- 36,930 · -6.1%
- By 2040
- 32,367 · -17.7%
- By 2050
- 29,030 · -26.2%
- By 2075
- 23,534 · -40.2%
- By 2100
- 19,312 · -50.9%
Race, ethnicity, and origin ACS 2023
- Neighborhood character
- Predominantly White (68%)
- Race & ethnicity
- White 68% Two or more races 24% Hispanic / Latino 10% Asian 3% Native American 2%
- Hispanic origin (detail)
- Mexican 5% Puerto Rican 3% Cuban 1%
- Common ancestry
- Italian 3% Russian 2% Slovak 1%
- Foreign-born
- 7% · Canada
- Languages at home
- 95% English-only · Spanish 4% Russian/Polish/Slavic 1%
Political lean MEDSL · Siskiyou
- 2024 margin
- R (+19.2) · D 38.8% · R 58.0% · Other 3.2%
- 2008→2024 swing
- -8.8pp toward R · 2008: -10.4pp · 2024: -19.2pp
- All cycles
- 2024: R+19.2 2020: R+15.8 2016: R+20.7 2012: R+15.6 2008: R+10.4
Not yet ingested
- Civics
- —
Market trends
- HPI YoY
- ▼ -0.48%
- Current HPI
- 175.8263
- Rent YoY
- —
- Metro
- —
- State GDP YoY
- ▲ 3.21%
- F500 in state
- 116
Industry mix (Fortune 500 HQ in CA)
| Industry | F500 HQs | Revenue |
|---|---|---|
| Technology | 27 | $1,492B |
|
||
| Financial Services | 3 | $174B |
|
||
| Retail | 3 | $44B |
|
||
| Insurance | 3 | $26B |
|
||
| Media / Entertainment | 2 | $115B |
|
||
| Pharmaceuticals / Biotech | 2 | $62B |
|
||
Price history
+223.9% since first listed6 events — show timeline
- 2026-01-16 Price Changed $149,000 SMLS
- 2025-11-12 Listing Removed — CRMLS
- 2025-09-08 Listed $168,000 CRMLS
- 2025-09-05 Listed $168,000 SMLS
- 2012-11-21 Sold (Public Records) $60,000 Public Records
- 2002-05-09 Sold (Public Records) $46,000 Public Records
Property tax history
+2.8%/yrLatest (2025): $832 · +11.3% YoY. Source: county tax records.
Cash-flow waterfall
monthlySold comps — $/sqft
last 12 mo · ≤1 miLoading sold comps…