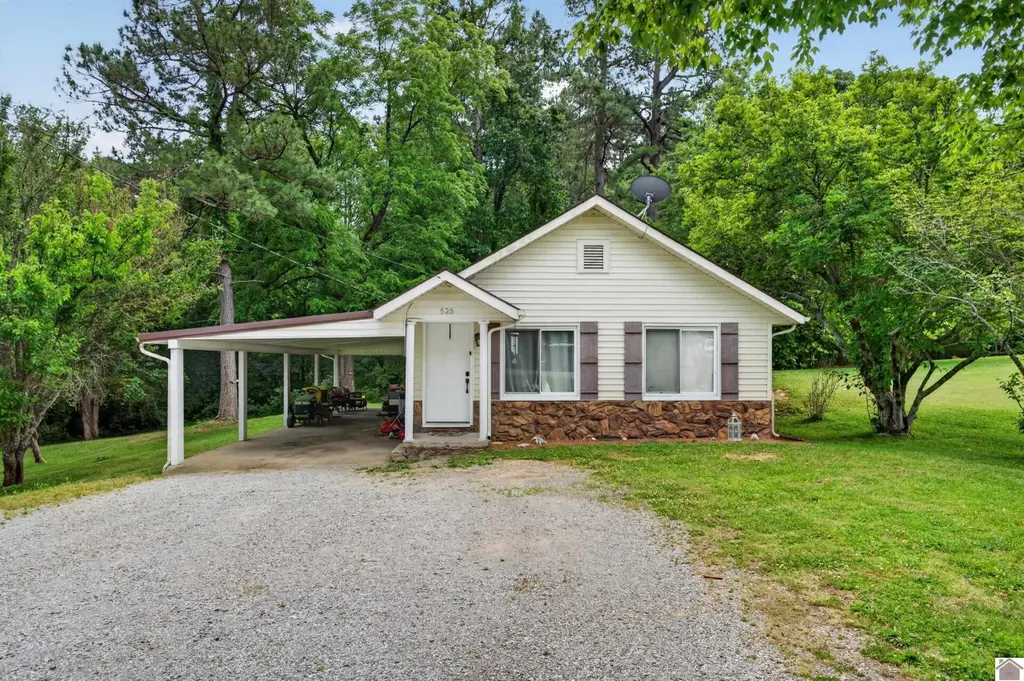
525 W 12th St · Benton, KY
Flood risk 1/10 · Minimal
- FEMA flood zone
- X (unshaded)
- Chance of flooding over 30 yrs
- 0.0%
- Est. flood insurance / yr
- $507 – $1,088
Fire risk 3/10 · Minor
- Est. fire insurance / yr
- $839 – $1,559
Heat risk 6/10 · Moderate
- Hot days now (above 108°F)
- 7 days/yr
- Hot days in 30 yrs
- 20 days/yr
Wind risk 3/10 · Minor
- Chance of severe wind over 30 yrs
- 7.0%
Air-quality risk 1/10 · Minimal
- Unhealthy air days now
- 0 days/yr
- Unhealthy air days in 30 yrs
- 0 days/yr
Risk factors via First Street. Map © Google.
Why this score? — see what drove the B- grade
The composite is a weighted blend of 9 inputs, each scored 0–100. Each bar is that input's sub-score; the figure is the points it added to the 100-point composite (weight × sub-score).
- Cash flow +25.0/30.0
- Appreciation +10.0/10.0
- DSCR +8.2/10.0
- ARV discount +7.5/15.0
- 1% rule +5.4/10.0
- Livability +3.5/5.0
- Schools +2.9/10.0
- Rent growth +2.5/5.0
- Condition / age +2.5/5.0
$134,900
🖨 Deal sheet (PDF) 📄 Offer letter ✓ Due diligence
Listing remarks MLS
Motivated Seller! Here is your perfect starter home or place to retire! Completely remodeled, (finishing touches happening now!) this home has so much character! New appliances, new floors and fixtures! It is nestled at the end of a quiet street. Don't wait, it won't last at $74,900.00!
Key facts
- 2 car carport
- Nearby kentucky lake
- Updated kitchen
Tags
Property features AI
Exterior
- Parking: Attached garage; 2-space carport; Gravel parking
- Utilities: Public water; Public sewer
- Home design: Single-family residence; 1 story
- Construction: Frame construction with vinyl siding; Composition and metal roof; Slab foundation; Built as a residential single-family home
- Exterior features: Level to rolling slope lot; Covered patio/porch
Interior
- Kitchen: Dishwasher; Cooktop; Microwave; Refrigerator; Electric water heater
- Flooring: Carpet; Laminate; Tile
- Bathrooms: 1 full bathroom
- Heating & cooling: Electric heating; Heat pump; Ceiling fan cooling
- Interior features: Eat-in kitchen; Covered patio/porch
- Laundry & utility: Dryer
Neighborhood map
What this means for you Summary
Snapshot
- This is a 2-bed/1.0-bath other listed at $135k.
Deal economics
- At list price, monthly cash flow is $296 ($4k/yr) — positive.
- The deal already cash-flows at list — no discount required.
- Meets the 1% rule at list price ($1k rent vs $135k).
- Recommended offer: $133k (1.5% below list) — sets the bar for market timing.
Location & tenants
- Location reads 69/100 on livability (#171 in KY) — a middle-class / working-renter tenant base. Strengths: crime A+, cost of living A+, housing A+; Watch: amenities F, commute F.
- Marshall County (rural): math 29% / reading 38% proficiency, ranked #73 of 165 in KY (top 44%) — families likely to look elsewhere, expect single-tenant / working-renter base with shorter leases.
- Zoned schools: Benton Elementary School (math 36% / reading 41%, grade F, #234 of 676 statewide, top 36%, 527 students, 51% FRL); South Marshall Middle (math 21% / reading 39%, grade F, #146 of 217 statewide, top 69%, 462 students, 55% FRL).
- Market conditions: 178 active listings in the ZIP; 2 comparable units currently listed for rent nearby; 121 units permitted in Marshall County in 2024 (5 in 5+ unit buildings).
Forward outlook
- In year one you build about $14k of equity ($933 loan paydown + $13k appreciation (10.0% local appreciation)).
- Marshall County population projected to shrink 9% by 2050 — rents likely to lag national; underwrite the cash flow, not the appreciation.
- At projected returns (10.0% appreciation + 3.0% rent growth), your $38k cash investment doubles in ~3 years — after that, you're playing with house money.
- By year 3, paydown + projected appreciation supports a ~$37k cash-out refi (75% LTV) — recoverable capital for the next deal without selling this one.
Negotiation context
- It's been on market 24 days — a 2% lower offer ($133k) is reasonable based on typical stale-listing flexibility.
- 2 sale attempts since 10y ago with the ask held roughly flat each time — persistent listings suggest the price (not the market) is what's stuck; bring a comps-based counter.
- Current owner paid $72k; list at $135k implies a 88% gain — meaningful room to come down on a strong offer.
Risks & watch-outs
- Watch-outs: built in 1950 — expect roof / HVAC / electrical / plumbing capex.
- Climate carrying-cost: extreme-heat days projected 7→20/yr by 2055 (HVAC capex compounding) — expect insurance premiums to compound above CPI over the hold.
Questions for the listing agent
- Built in 1950 — when were the roof, HVAC, electrical panel, plumbing, and water heater last replaced?
- Is there a deadline driving the sale (1031 exchange, divorce, estate, relocation)? That informs how much negotiation room exists.
- Schools are D-rated, which usually means shorter tenancies and higher turnover. Who's the typical renter profile here, and what's been the actual vacancy rate?
- What's the average days-on-market for RENTAL listings here right now (not sales)? A rising rental-DOM trend means longer vacancies and softer asking-rent achievability than the comps imply.
- What's the recent tenant-quality profile in this submarket — average credit score on applications, eviction rate, late-payment / NSF rate, and stable-employment percentage? A property-management company in the area should have these aggregated.
- How much new for-sale + rental construction is in the pipeline within 1–3 miles? Heavy new supply typically softens prices + rents 12–24 months out; constrained supply supports both.
Investment metrics
- 1% rule
- 1.04% ✓
- Cap rate
- 8.92%
- Cash-on-cash
- 9.39%
- DSCR
- 1.42
- GRM
- 8.0
CMA / ARV
No comps found within radius.
Projected returns pro-forma
10.0% appreciation · 3.0% rent growth · sell at horizon
- IRR
- 31.1%
- Equity multiple
- 3.44×
- Total profit
- $92,248
- Equity at exit
- $121,529
- IRR
- 26.9%
- Equity multiple
- 7.80×
- Total profit
- $256,751
- Equity at exit
- $262,081
Cash invested: $37,772 (down + closing). Projections, not guarantees.
Landlord ↔ Tenant lean methodology
- Overall (STATE)
- 83 Strongly Landlord-Friendly
- State Kentucky
- 83 Strongly Landlord-Friendly · R+16
- County
- — inherits STATE
- City
- — inherits STATE
ZIP-level market 42025
- Home prices YoY
- 7.1%
- Active inventory
- 178
- Price-to-rent
- 8.0×
Monthly cashflow live
- Estimated rent
- $1,408 medium interval (Pro) →
- Mortgage (P&I)
- −$707
- Tax from tax record
- −$53 /mo · $638/yr
- Insurance
- −$56
- HOA
- −$0
- Vacancy / Maint / Mgmt
- −$296
- Net cashflow
- $296
Break-even live
Sensitivity live
| Price | -10% $372 | -5% $334 | +0% $296 | +5% $257 | +10% $219 |
|---|---|---|---|---|---|
| Rent | -10% $184 | -5% $240 | +0% $296 | +5% $351 | +10% $407 |
| Rate | -1.0pp $364 | -0.5pp $330 | base $296 | +0.5pp $261 | +1.0pp $225 |
UW: 25.0% down · 7.5% · 30yr · 1.5% tax · 5.0% vac · 8.0% maint · 8.0% mgmt
Financing live
Cash to close
- Down payment
- $33,725
- Closing costs
- $4,047
- Reserves months
- —
- Total cash needed
- —
Loan-product check · same deal, 3 products live
Conventional
25% down · 7.5% · 30yr
- Down + closing
- —
- Monthly P&I
- —
- Monthly cashflow
- —
- DSCR
- —
- Eligible?
- —
Personal DTI + credit; lowest rate.
DSCR
20% down · 8.5% · 30yr
- Down + closing
- —
- Monthly P&I
- —
- Monthly cashflow
- —
- DSCR
- —
- Eligible?
- —
No personal income docs; deal must DSCR.
Hard money
10% down · 12.0% · 12mo
- Down + closing
- —
- Monthly P&I
- —
- Monthly cashflow
- —
- DSCR
- —
- Eligible?
- —
Short-term bridge; refi at stabilization.
Rent comps 2 comps
| Address | Beds | Baths | Sqft | Rent | $/sqft | DOM | Units | Dist |
|---|---|---|---|---|---|---|---|---|
| 306 W 14th St Benton, KY | 2.0 | 1.0 | 1000 | $999 | $1.00 | 44d | 1 | 0.31mi |
| 102 Highland Dr Benton, KY | 2.0 | 1.0 | 1100 | $1,975 | $1.80 | 44d | 1 | 0.40mi |
Listing history 14 events
-
2026-06-15days on market $134,900 Active 24 DOM
-
2026-06-14days on market $134,900 Active 22 DOM
-
2026-06-12days on market $134,900 Active 21 DOM
-
2026-06-09days on market $134,900 Active 18 DOM
-
2026-06-08days on market $134,900 Active 17 DOM
-
2026-06-07days on market $134,900 Active 16 DOM
-
2026-06-03days on market $134,900 Active 12 DOM
-
2026-06-02days on market $134,900 Active 11 DOM
-
2026-06-01days on market $134,900 Active 10 DOM
-
2026-05-31days on market $134,900 Active 9 DOM
-
2026-05-30days on market $134,900 Active 8 DOM
-
2026-05-19$134,900 Active
-
2016-07-29soldstatus $71,650 287-char remark
Show marketing remark (287 chars)
Motivated Seller! Here is your perfect starter home or place to retire! Completely remodeled, (finishing touches happening now!) this home has so much character! New appliances, new floors and fixtures! It is nestled at the end of a quiet street. Don't wait, it won't last at $74,900.00!
-
2016-02-08$74,900 287-char remark
Show marketing remark (287 chars)
Motivated Seller! Here is your perfect starter home or place to retire! Completely remodeled, (finishing touches happening now!) this home has so much character! New appliances, new floors and fixtures! It is nestled at the end of a quiet street. Don't wait, it won't last at $74,900.00!
ⓘ Source: listings_history table (triggers on properties + properties_extension) + one-shot
backfill from property_details.listing_events for pre-trigger history.
Tax reassessment forecast KY · Resets to sale price
- Current annual tax
- $638 · $53/mo
- Projected year-2 tax
- $1,160 · $97/mo
- Expected delta
- +$522/yr (+$43/mo · 81.7%)
ⓘ Screening estimate from a state-policy table — verify with the county assessor before closing.
Climate risk First Street
- Flood 1/10 Low FEMA zone X (unshaded) · 0% chance over 30 yrs
- Wildfire 3/10 Moderate
- Heat 6/10 Major 7 d/yr ≥108°F today · 20 d/yr by 30 yrs out
- Wind 3/10 Moderate 7% chance of damaging wind over 30 yrs
- Air quality 1/10 Low 0 unhealthy d/yr today · 0 by 30 yrs out
Nearby sold comps map
Loading sold comps map…
Walkable amenities ~0.75 mi
Loading nearby amenities…
Taxation est. · year 1
- Rental income
- $16,898
- − Mortgage interest
- −$7,556
- − Property taxes
- −$638
- − Insurance
- −$674
- − Repairs & maintenance
- −$1,352
- − Management
- −$1,352
- − Depreciation
- −$3,924
- Taxable income
- $1,401
- Est. tax owed @ 24.0%
- −$336
- After-tax cash flow
- $3,211/yr
For passive investors: Depreciation is non-cash, so a rental often shows a tax loss while cash-flowing — sheltering income. Rental losses are passive: they offset passive income freely, and up to $25,000/yr can offset ordinary (W-2) income if you actively participate and your MAGI is under $100k (phasing out to $0 by $150k); unused losses carry forward. On sale, claimed depreciation is recaptured at up to 25%, and gains may owe capital-gains tax (a 1031 exchange can defer both). Figures are a year-1 estimate at your 24.0% rate — not tax advice; consult a CPA.
Schools (NCES district)
- District
- Marshall County
- NCES district ID
- 2103810
- Math proficiency
- 29% ▼ -7.00%
- Reading proficiency
- 38% ▼ -16.00%
- Median HH income
- $45,324
- Composite
- 28.62/100
- National rank
- #6710
- State rank
- #73 of 165 in KY
Livability — Benton
- Score
- 69/100
- State rank
- #171
- US rank
- #8655
Category grades
Schools grade is shown separately in the Schools card above.
Census & demographics
- Census place
- Benton, KY
- Population (ZIP)
- 19,238
Population outlook (Marshall County) Hauer SSP2
- Today (2025)
- 30,647 people
- By 2030
- 30,276 · -1.2%
- By 2040
- 29,232 · -4.6%
- By 2050
- 27,940 · -8.8%
- By 2075
- 25,289 · -17.5%
- By 2100
- 21,188 · -30.9%
Race, ethnicity, and origin ACS 2023
- Neighborhood character
- Predominantly White (95%)
- Race & ethnicity
- White 95% Two or more races 2% Hispanic / Latino 2%
- Common ancestry
- Iranian 2% Slovak 2% Lithuanian 2%
- Foreign-born
- 1% · Canada
- Languages at home
- 98% English-only · Spanish 1%
Political lean MEDSL · Marshall
- 2024 margin
- Solid R (+56.7) · D 21.0% · R 77.7% · Other 1.3%
- 2008→2024 swing
- -32.0pp toward R · 2008: -24.7pp · 2024: -56.7pp
- All cycles
- 2024: R+56.7 2020: R+52.4 2016: R+51.9 2012: R+34.2 2008: R+24.7
Not yet ingested
- Civics
- —
Market trends
- HPI YoY
- ▲ 19.11%
- Current HPI
- 288.75
- Rent YoY
- —
- Metro
- —
- State GDP YoY
- ▲ 1.81%
- F500 in state
- 4
Industry mix (Fortune 500 HQ in KY)
| Industry | F500 HQs | Revenue |
|---|---|---|
| Healthcare | 1 | $118B |
|
||
| Food / Beverage | 1 | $7B |
|
||
Price history
+80.1% since first listed3 events — show timeline
- 2026-05-19 Listed $134,900 WKRMLS
- 2016-07-29 Sold (MLS) $71,650 WKRMLS
- 2016-02-08 Listed $74,900 WKRMLS
Property tax history
+6.2%/yrLatest (2025): $638 · -1.7% YoY. Source: county tax records.
Cash-flow waterfall
monthlySold comps — $/sqft
last 12 mo · ≤1 miLoading sold comps…