413 S Morgan Ave · New Meadows, ID
Flood risk 1/10 · Minimal
- FEMA flood zone
- —
- Chance of flooding over 30 yrs
- 0.0%
- Est. flood insurance / yr
- —
Fire risk 8/10 · Major
- Est. fire insurance / yr
- $584 – $1,086
Heat risk 3/10 · Minor
- Hot days now (above 91°F)
- 7 days/yr
- Hot days in 30 yrs
- 18 days/yr
Wind risk 1/10 · Minimal
- Chance of severe wind over 30 yrs
- —
Air-quality risk 8/10 · Major
- Unhealthy air days now
- 13 days/yr
- Unhealthy air days in 30 yrs
- 15 days/yr
Risk factors via First Street. Map © Google.
Why this score? — see what drove the D grade
The composite is a weighted blend of 9 inputs, each scored 0–100. Each bar is that input's sub-score; the figure is the points it added to the 100-point composite (weight × sub-score).
- Cash flow +8.8/30.0
- Appreciation +8.4/10.0
- ARV discount +7.5/15.0
- Schools +4.0/10.0
- Livability +3.5/5.0
- Rent growth +2.5/5.0
- Condition / age +2.5/5.0
- DSCR +2.4/10.0
- 1% rule +1.5/10.0
$169,000
🖨 Deal sheet 📄 Offer letter ✓ Due diligence
Listing remarks MLS
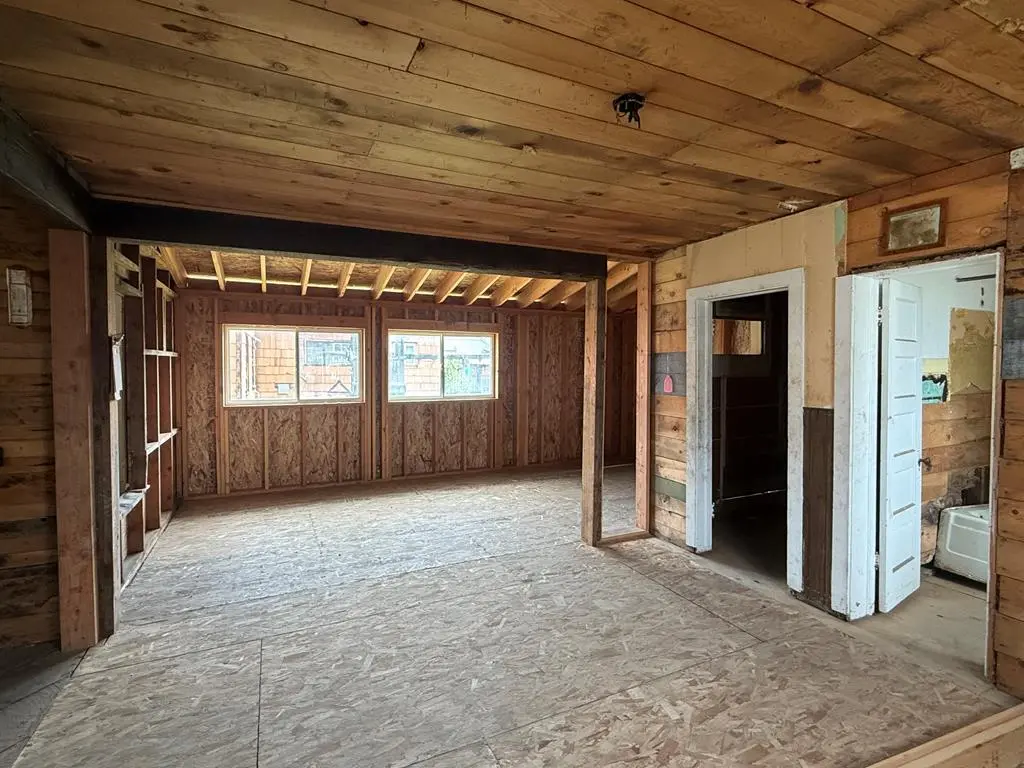
Fixer upper in New Meadows! There's a lot to finish, but the owner has installed a cement block permitted foundation. Stripped down to the boards inside. New roof on the back of the house. Front porch could be removed or renovated. Nice lot with a shed in back. Paid & active city sewer & water hookups. City water has a frost free hydrant outside to use now.
Key facts
- Shed in back
- New roof on the back
- 5,227 sq ft lot
Tags
Property features AI
Exterior
- Utilities: City water service; Sewer connected
- Home design: Single family residence; One-story (single level); Built in 1960
- Construction: Frame construction; Metal roof
- Exterior features: Partial fencing; Public road frontage; Small lot (~5,999 sq ft)
Interior
- Bedrooms: 2 bedrooms on the main level
- Bathrooms: 1 bathroom
- Heating & cooling: No central heating; No central cooling
- Interior features: Main-level living
Neighborhood map
What this means for you Summary
Snapshot
- This is a 3-bed/1.0-bath other listed at $169k.
Deal economics
- At list price, monthly cash flow is $-138 ($-2k/yr) — negative.
- To cash-flow at today's rent, offer at most $145k (14.4% below list).
- To meet the 1% rule (rent ≥ 1% of price), the offer needs to be $110k (34.9% below list).
- Recommended offer: $110k (34.9% below list) — sets the bar for 1% rule.
- Cap rate 5.3% vs local median 0.7% in New Meadows — top-decile yield for the area; either an underpriced asset or a hidden risk that comps aren't pricing in. Stress-test before assuming the spread holds.
Location & tenants
- Location reads 69/100 on livability (#70 in ID) — a middle-class / working-renter tenant base. Strengths: cost of living A+, housing A+, crime B+; Watch: schools C-, health & safety C-, amenities F.
- Meadows Valley District (rural): math 40% / reading 50% proficiency, ranked #69 of 133 in ID (top 52%) — families likely to look elsewhere, expect single-tenant / working-renter base with shorter leases.
- Market conditions: 96 active listings in the ZIP; 1 comparable units currently listed for rent nearby; 13 units permitted in Adams County in 2024 (0 in 5+ unit buildings).
Forward outlook
- In year one you build about $13k of equity ($1k loan paydown + $11k appreciation (6.7% local appreciation)).
- Adams County population projected at -36% by 2050 — secular population decline; favor cash flow + early exit over multi-decade hold.
- By year 3, paydown + projected appreciation supports a ~$31k cash-out refi (75% LTV) — recoverable capital for the next deal without selling this one.
Negotiation context
- It's been on market 22 days — a 2% lower offer ($166k) is reasonable based on typical stale-listing flexibility.
- 2 sale attempts with the ask held roughly flat each time — persistent listings suggest the price (not the market) is what's stuck; bring a comps-based counter.
Risks & watch-outs
- Climate carrying-cost: severe wildfire risk — expect insurance premiums to compound above CPI over the hold.
Questions for the listing agent
- What do current leases actually rent for vs. the listed asking? Can we see a recent rent roll and the last 12 months of T-12 income?
- Built in 1960 — when were the roof, HVAC, electrical panel, plumbing, and water heater last replaced?
- Is there a deadline driving the sale (1031 exchange, divorce, estate, relocation)? That informs how much negotiation room exists.
- The area grade is low — what's the realistic commute time and amenity access for the typical tenant pool here? Any planned neighborhood developments (good or bad) we should know about?
- What's the average days-on-market for RENTAL listings here right now (not sales)? A rising rental-DOM trend means longer vacancies and softer asking-rent achievability than the comps imply.
- What's the recent tenant-quality profile in this submarket — average credit score on applications, eviction rate, late-payment / NSF rate, and stable-employment percentage? A property-management company in the area should have these aggregated.
- How much new for-sale + rental construction is in the pipeline within 1–3 miles? Heavy new supply typically softens prices + rents 12–24 months out; constrained supply supports both.
Investment metrics
- 1% rule
- 0.65% ✗
- Cap rate
- 5.31%
- Cash-on-cash
- -3.50%
- DSCR
- 0.84
- GRM
- 12.8
CMA / ARV
No comps found within radius.
Projected returns pro-forma
6.72% appreciation · 3.0% rent growth · sell at horizon
- IRR
- 14.3%
- Equity multiple
- 2.00×
- Total profit
- $47,243
- Equity at exit
- $114,029
- IRR
- 14.4%
- Equity multiple
- 4.04×
- Total profit
- $144,074
- Equity at exit
- $213,868
Cash invested: $47,320 (down + closing). Projections, not guarantees.
Landlord ↔ Tenant lean methodology
- Overall (STATE)
- 91 Strongly Landlord-Friendly
- State Idaho
- 91 Strongly Landlord-Friendly · R+18
- County
- — inherits STATE
- City
- — inherits STATE
ZIP-level market 83654
- Home prices YoY
- 2.0%
- Active inventory
- 96
- Price-to-rent
- 12.8×
Monthly cashflow live
- Estimated rent
- $1,100 medium interval (Pro) →
- Mortgage (P&I)
- −$886
- Tax from tax record
- −$50 /mo · $604/yr
- Insurance
- −$70
- HOA
- −$0
- Vacancy / Maint / Mgmt
- −$231
- Net cashflow
- $-138
Break-even live
UW: 25.0% down · 7.5% · 30yr · 1.5% tax · 5.0% vac · 8.0% maint · 8.0% mgmt
Financing live
Cash to close
- Down payment
- $42,250
- Closing costs
- $5,070
- Reserves months
- —
- Total cash needed
- —
Loan-product check · same deal, 3 products live
Conventional
25% down · 7.5% · 30yr
- Down + closing
- —
- Monthly P&I
- —
- Monthly cashflow
- —
- DSCR
- —
- Eligible?
- —
Personal DTI + credit; lowest rate.
DSCR
20% down · 8.5% · 30yr
- Down + closing
- —
- Monthly P&I
- —
- Monthly cashflow
- —
- DSCR
- —
- Eligible?
- —
No personal income docs; deal must DSCR.
Hard money
10% down · 12.0% · 12mo
- Down + closing
- —
- Monthly P&I
- —
- Monthly cashflow
- —
- DSCR
- —
- Eligible?
- —
Short-term bridge; refi at stabilization.
Rent comps 1 comps
| Address | Beds | Baths | Sqft | Rent | $/sqft | DOM | Units | Dist |
|---|---|---|---|---|---|---|---|---|
| 110 Nora St Unit 1xx New Meadows, ID | 2.0 | 1.0 | 900 | $1,100 | $1.22 | 43d | 1 | 0.26mi |
Listing history 16 events
-
2026-06-18days on market $169,000 Active 22 DOM
-
2026-06-17days on market $169,000 Active 21 DOM
-
2026-06-16days on market $169,000 Active 20 DOM
-
2026-06-15days on market $169,000 Active 19 DOM
-
2026-06-14days on market $169,000 Active 17 DOM
-
2026-06-12days on market $169,000 Active 16 DOM
-
2026-06-09days on market $169,000 Active 13 DOM
-
2026-06-08days on market $169,000 Active 12 DOM
-
2026-06-07days on market $169,000 Active 11 DOM
-
2026-06-04days on market $169,000 Active 7 DOM
-
2026-06-02days on market $169,000 Active 6 DOM
-
2026-06-01days on market $169,000 Active 5 DOM
-
2026-05-31days on market $169,000 Active 4 DOM
-
2026-05-31days on market $169,000 Active 3 DOM
-
2026-05-27$169,000 Active 372-char remark
Show marketing remark (372 chars)
Fixer upper in New Meadows! There's a lot to finish, but the owner has installed a cement block permitted foundation. Stripped down to the boards inside. New roof on the back of the house. Front porch could be removed or renovated. Nice lot with a shed in back. Paid & active city sewer & water hookups. City water has a frost free hydrant outside to use now.
-
2026-05-26$169,000 Active
ⓘ Source: listings_history table (triggers on properties + properties_extension) + one-shot
backfill from property_details.listing_events for pre-trigger history.
Tax reassessment forecast ID · Resets to sale price
- Current annual tax
- $604 · $50/mo
- Projected year-2 tax
- $1,166 · $97/mo
- Expected delta
- +$562/yr (+$47/mo · 93.0%)
ⓘ Screening estimate from a state-policy table — verify with the county assessor before closing.
Climate risk First Street
- Flood 1/10 Low 0% chance over 30 yrs
- Wildfire 8/10 Severe
- Heat 3/10 Moderate 7 d/yr ≥91°F today · 18 d/yr by 30 yrs out
- Wind 1/10 Low
- Air quality 8/10 Severe 13 unhealthy d/yr today · 15 by 30 yrs out
Nearby sold comps map
Loading sold comps map…
Walkable amenities ~0.75 mi
Loading nearby amenities…
Taxation est. · year 1
- Rental income
- $13,200
- − Mortgage interest
- −$9,467
- − Property taxes
- −$604
- − Insurance
- −$845
- − Repairs & maintenance
- −$1,056
- − Management
- −$1,056
- − Depreciation
- −$4,916
- Taxable loss
- −$4,744
- Est. tax savings @ 24.0%
- +$1,139
- After-tax cash flow
- $-518/yr
For passive investors: Depreciation is non-cash, so a rental often shows a tax loss while cash-flowing — sheltering income. Rental losses are passive: they offset passive income freely, and up to $25,000/yr can offset ordinary (W-2) income if you actively participate and your MAGI is under $100k (phasing out to $0 by $150k); unused losses carry forward. On sale, claimed depreciation is recaptured at up to 25%, and gains may owe capital-gains tax (a 1031 exchange can defer both). Figures are a year-1 estimate at your 24.0% rate — not tax advice; consult a CPA.
Schools (NCES district)
- District
- Meadows Valley District
- NCES district ID
- 1602060
- Math proficiency
- 40% ▲ 20.00%
- Reading proficiency
- 50% ▲ 15.00%
- Median HH income
- $44,509
- Composite
- 40.32/100
- National rank
- #7777
- State rank
- #69 of 133 in ID
Livability — New Meadows
- Score
- 69/100
- State rank
- #70
- US rank
- #8481
Category grades
Schools grade is shown separately in the Schools card above.
Census & demographics
- Census place
- New Meadows, ID
- Population (ZIP)
- 1,654
Population outlook (Adams County) Hauer SSP2
- Today (2025)
- 3,524 people
- By 2030
- 3,258 · -7.5%
- By 2040
- 2,708 · -23.2%
- By 2050
- 2,274 · -35.5%
- By 2075
- 1,689 · -52.1%
- By 2100
- 1,244 · -64.7%
Race, ethnicity, and origin ACS 2023
- Neighborhood character
- Predominantly White (94%)
- Race & ethnicity
- White 94% Two or more races 3% Hispanic / Latino 2%
- Common ancestry
- Portuguese 6% Slovak 3% Romanian 3%
- Foreign-born
- 0%
- Languages at home
- 99% English-only · Spanish 1%
Political lean MEDSL · Adams
- 2024 margin
- Solid R (+54.5) · D 21.5% · R 76.0% · Other 2.4%
- 2008→2024 swing
- -20.5pp toward R · 2008: -34.0pp · 2024: -54.5pp
- All cycles
- 2024: R+54.5 2020: R+52.2 2016: R+52.3 2012: R+40.6 2008: R+34.0
Not yet ingested
- Civics
- —
Market trends
- HPI YoY
- ▲ 6.72%
- Current HPI
- 349.5441
- Rent YoY
- —
- Metro
- —
- State GDP YoY
- ▲ 4.51%
- F500 in state
- 6
Industry mix (Fortune 500 HQ in ID)
| Industry | F500 HQs | Revenue |
|---|---|---|
| Retail | 1 | $79B |
|
||
| Technology | 1 | $25B |
|
||
| Food / Agriculture | 1 | $6B |
|
||
Price history
+0.0% since first listed2 events — show timeline
- 2026-05-27 Listed $169,000 MCAOR
- 2026-05-26 Listed $169,000 IMLS
Property tax history
+12.2%/yrLatest (2025): $604 · -0.1% YoY. Source: county tax records.
Cash-flow waterfall
monthlySold comps — $/sqft
last 12 mo · ≤1 miLoading sold comps…