 5-Plex
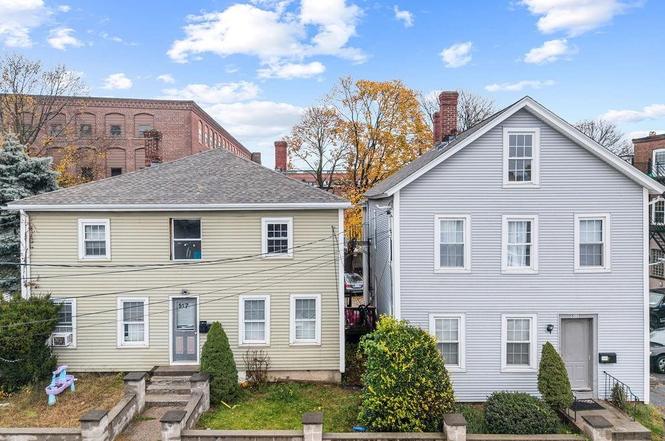
517 High St · Central Falls, RI
Flood risk 4/10 · Minor
- FEMA flood zone
- X (unshaded)
- Chance of flooding over 30 yrs
- 0.24%
- Est. flood insurance / yr
- $507 – $1,088
Fire risk 1/10 · Minimal
- Est. fire insurance / yr
- $835 – $1,551
Heat risk 6/10 · Moderate
- Hot days now (above 98°F)
- 7 days/yr
- Hot days in 30 yrs
- 15 days/yr
Wind risk 6/10 · Moderate
- Chance of severe wind over 30 yrs
- 70.0%
Air-quality risk 2/10 · Minimal
- Unhealthy air days now
- 1 days/yr
- Unhealthy air days in 30 yrs
- 2 days/yr
Risk factors via First Street. Map © Google.
Why this score? — see what drove the B grade
The composite is a weighted blend of 9 inputs, each scored 0–100. Each bar is that input's sub-score; the figure is the points it added to the 100-point composite (weight × sub-score).
- Cash flow +30.0/30.0
- 1% rule +10.0/10.0
- DSCR +10.0/10.0
- ARV discount +7.5/15.0
- Appreciation +7.3/10.0
- Livability +3.3/5.0
- Rent growth +2.5/5.0
- Condition / age +2.5/5.0
- Schools +0.4/10.0
$750,000
🖨 Deal sheet 📄 Offer letter ✓ Due diligence
Multi-family units
County records classify this as Multi-Family (2-4 Unit). Listing-text estimate: 5 units. estimate disagrees with records
Listing remarks
Price improvement! Investment opportunity! A high-cash-flow 5-unit multi-family property split between a 2-unit and a 3-unit building located at 511-517 High St in Central Falls, Rhode Island. All five units are in excellent, turnkey condition with strong, established tenants providing reliable immediate income for the new owner. Current rents are solid but still under market value. Its highly desirable location is close to major commuter routes, local amenities, and the upcoming Pawtucket/Central Falls Transit Hub, making it very appealing to renters. This well-maintained asset is perfect for the serious investor seeking both stable current income and significant near-term equity growth. D
Key facts
- 3-unit building
- Established tenants
- Turnkey condition
Tags
Neighborhood map
What this means for you Summary
Snapshot
- This is a 5 × 5-bed/?-bath units multifamily listed at $750k.
Deal economics
- At list price, monthly cash flow is $5k ($55k/yr) — positive. Per door: $910/mo.
- The deal already cash-flows at list — no discount required.
- Meets the 1% rule at list price ($12k rent vs $750k).
- Recommended offer: $682k (9.0% below list) — sets the bar for market timing.
- Cap rate 13.6% vs local median 5.2% in Central Falls — top-decile yield for the area; either an underpriced asset or a hidden risk that comps aren't pricing in. Stress-test before assuming the spread holds.
Location & tenants
- Location reads 66/100 on livability (#21 in RI) — a middle-class / working-renter tenant base. Strengths: health & safety A+, cost of living A, housing B; Watch: schools F, amenities F, commute F.
- Central Falls (suburban): math 2% / reading 8% proficiency, ranked #38 of 39 in RI (top 97%) — low school quality limits family demand, transient renter base, plan for 1-2y turnover; 78% free/reduced lunch — lower-income household profile, screen leases tightly.
- Market conditions: 33 active listings in the ZIP; 776 units permitted in Providence County in 2024 (229 in 5+ unit buildings).
- At $12,320/mo this rent would consume 300% of the median local household income ($49k/yr) (locally 1380% of renters already pay >50% of income on rent) — very limited rent-growth headroom before tenants either downsize or default.
Forward outlook
- In year one you build about $39k of equity ($5k loan paydown + $34k appreciation (4.6% local appreciation)).
- Providence County population projected at +5% by 2050 — modest demand growth; plan on rents tracking national, not racing it.
- At projected returns (4.6% appreciation + 3.0% rent growth), your $210k cash investment doubles in ~3 years — after that, you're playing with house money.
- By year 2, paydown + projected appreciation supports a ~$63k cash-out refi (75% LTV) — recoverable capital for the next deal without selling this one.
Negotiation context
- It's been on market 98 days — a 9% lower offer ($682k) is reasonable based on typical stale-listing flexibility.
- 3 sale attempts since 2y ago with the ask held roughly flat each time — persistent listings suggest the price (not the market) is what's stuck; bring a comps-based counter.
Risks & watch-outs
- Watch-outs: built in 1900 — expect roof / HVAC / electrical / plumbing capex.
- Climate carrying-cost: major wind risk, 70% chance of damaging wind over 30y; extreme-heat days projected 7→15/yr by 2055 (HVAC capex compounding) — expect insurance premiums to compound above CPI over the hold.
Questions for the listing agent
- It's been on market 98 days. Have you received any prior offers? Is the seller open to a 9% concession, seller financing, or rate buy-down credit?
- Can we see the unit-by-unit rent roll, current vacancy, and any below-market leases? What's the average tenancy length?
- What capital expenditures (roof, boiler, parking lot, exteriors) have been made in the last 5 years, and what's planned in the next 2?
- Built in 1900 — when were the roof, HVAC, electrical panel, plumbing, and water heater last replaced?
- Why hasn't it sold? Are there any deal-killer items the seller is aware of (foundation, flood, title, zoning, code violations)?
- Is there a deadline driving the sale (1031 exchange, divorce, estate, relocation)? That informs how much negotiation room exists.
- Schools are F-rated, which usually means shorter tenancies and higher turnover. Who's the typical renter profile here, and what's been the actual vacancy rate?
- What's the average days-on-market for RENTAL listings here right now (not sales)? A rising rental-DOM trend means longer vacancies and softer asking-rent achievability than the comps imply.
- What's the recent tenant-quality profile in this submarket — average credit score on applications, eviction rate, late-payment / NSF rate, and stable-employment percentage? A property-management company in the area should have these aggregated.
- How much new apartment / multifamily construction is in the pipeline within 1–3 miles? Heavy new supply (>2% of stock underway) typically softens rents 12–24 months out; light construction supports rent growth.
Investment metrics
- 1% rule
- 1.64% ✓
- Cap rate
- 13.57%
- Cash-on-cash
- 26.00%
- DSCR
- 2.16
- GRM
- 5.1
CMA / ARV
No comps found within radius.
Projected returns pro-forma
4.58% appreciation · 3.0% rent growth · sell at horizon
- IRR
- 34.9%
- Equity multiple
- 3.12×
- Total profit
- $444,740
- Equity at exit
- $405,777
- IRR
- 33.6%
- Equity multiple
- 6.25×
- Total profit
- $1,103,403
- Equity at exit
- $684,903
Cash invested: $210,000 (down + closing). Projections, not guarantees.
Landlord ↔ Tenant lean methodology
- Overall (STATE)
- 31 Tenant-Leaning
- State Rhode Island
- 31 Tenant-Leaning · D+8
- County
- — inherits STATE
- City
- — inherits STATE
ZIP-level market 02863
- Home prices YoY
- 1.2%
- Active inventory
- 33
- Price-to-rent
- 25.4×
Monthly cashflow live
- Estimated rent
- $12,320 high interval (Pro) →
- Mortgage (P&I)
- −$3,933
- Tax est. 1.5%
- −$938 /mo · $11,250/yr
- Insurance
- −$312
- HOA
- −$0
- Vacancy / Maint / Mgmt
- −$2,587
- Net cashflow
- $4,550
Break-even live
5-unit breakdown (identical units grouped — click to expand)
| Units | Beds | Baths | Est. rent |
|---|---|---|---|
| 5× units | 5 | — | $12,320 |
| #1 | 5 | — | $2,464 |
| #2 | 5 | — | $2,464 |
| #3 | 5 | — | $2,464 |
| #4 | 5 | — | $2,464 |
| #5 | 5 | — | $2,464 |
| Total (5 units) | $12,320 | ||
UW: 25.0% down · 7.5% · 30yr · 1.5% tax · 5.0% vac · 8.0% maint · 8.0% mgmt
Financing live
Cash to close
- Down payment
- $187,500
- Closing costs
- $22,500
- Reserves months
- —
- Total cash needed
- —
Loan-product check · same deal, 3 products live
Conventional
25% down · 7.5% · 30yr
- Down + closing
- —
- Monthly P&I
- —
- Monthly cashflow
- —
- DSCR
- —
- Eligible?
- —
Personal DTI + credit; lowest rate.
DSCR
20% down · 8.5% · 30yr
- Down + closing
- —
- Monthly P&I
- —
- Monthly cashflow
- —
- DSCR
- —
- Eligible?
- —
No personal income docs; deal must DSCR.
Hard money
10% down · 12.0% · 12mo
- Down + closing
- —
- Monthly P&I
- —
- Monthly cashflow
- —
- DSCR
- —
- Eligible?
- —
Short-term bridge; refi at stabilization.
Listing history 10 events
-
2026-03-03status Pending
-
2026-01-21price $750,000
-
2025-12-29price $770,000
-
2025-11-25$779,000 Active
-
2025-06-30historical
-
2025-03-14$849,000 Active
-
2024-12-10historical
-
2024-08-28price $550,000
-
2024-08-10price $600,000
-
2024-08-06$500,000 Active
ⓘ Source: listings_history table (triggers on properties + properties_extension) + one-shot
backfill from property_details.listing_events for pre-trigger history.
Climate risk First Street
- Flood 4/10 Moderate FEMA zone X (unshaded) · 24% chance over 30 yrs
- Wildfire 1/10 Low
- Heat 6/10 Major 7 d/yr ≥98°F today · 15 d/yr by 30 yrs out
- Wind 6/10 Major 70% chance of damaging wind over 30 yrs
- Air quality 2/10 Low 1 unhealthy d/yr today · 2 by 30 yrs out
Nearby sold comps map
Loading sold comps map…
Walkable amenities ~0.75 mi
Loading nearby amenities…
Taxation est. · year 1
- Rental income
- $147,840
- − Mortgage interest
- −$42,012
- − Property taxes
- −$11,250
- − Insurance
- −$3,750
- − Repairs & maintenance
- −$11,827
- − Management
- −$11,827
- − Depreciation
- −$21,818
- Taxable income
- $45,356
- Est. tax owed @ 24.0%
- −$10,885
- After-tax cash flow
- $43,711/yr
For passive investors: Depreciation is non-cash, so a rental often shows a tax loss while cash-flowing — sheltering income. Rental losses are passive: they offset passive income freely, and up to $25,000/yr can offset ordinary (W-2) income if you actively participate and your MAGI is under $100k (phasing out to $0 by $150k); unused losses carry forward. On sale, claimed depreciation is recaptured at up to 25%, and gains may owe capital-gains tax (a 1031 exchange can defer both). Figures are a year-1 estimate at your 24.0% rate — not tax advice; consult a CPA.
Schools (NCES district)
- District
- Central Falls
- NCES district ID
- 4400120
- Math proficiency
- 2% ▼ -6.00%
- Reading proficiency
- 8% ▼ -5.00%
- Median HH income
- $30,478
- Composite
- 3.59/100
- National rank
- #10071
- State rank
- #38 of 39 in RI
Livability — Central Falls
- Score
- 66/100
- State rank
- #21
- US rank
- #11321
Category grades
Schools grade is shown separately in the Schools card above.
Census & demographics
- Census place
- Central Falls, RI
- County
- Providence County · 548,917 people
- City population
- 22,701
- Metro
- Providence-Warwick, RI-MA
- Population (ZIP)
- 22,701
- Household income
- $49,285
- Rent vs Own
- Severe rent burden
- 1380.0
Population outlook (Providence County) Hauer SSP2
- Today (2025)
- 653,469 people
- By 2030
- 660,819 · +1.1%
- By 2040
- 672,747 · +3.0%
- By 2050
- 683,741 · +4.6%
- By 2075
- 720,435 · +10.2%
- By 2100
- 741,582 · +13.5%
Race, ethnicity, and origin ACS 2023
- Neighborhood character
- Predominantly Hispanic (69%)
- Race & ethnicity
- Hispanic / Latino 69% Two or more races 29% White 16% Black 8%
- Hispanic origin (detail)
- Mexican 6% Puerto Rican 15% Dominican 7%
- Common ancestry
- Lithuanian 4% Russian 4% Romanian 1%
- Foreign-born
- 40% · Canada, Jamaica
- Languages at home
- 29% English-only · Spanish 62% Other Indo-European 5% French/Haitian/Cajun 3%
Political lean MEDSL · Providence
- 2024 margin
- D (+14.4) · D 56.1% · R 41.7% · Other 2.2%
- 2008→2024 swing
- -20.0pp toward R · 2008: 34.4pp · 2024: 14.4pp
- All cycles
- 2024: D+14.4 2020: D+22.9 2016: D+21.2 2012: D+34.9 2008: D+34.4
Not yet ingested
- Civics
- —
Market trends
- HPI YoY
- ▲ 4.58%
- Current HPI
- 373.2598
- Rent YoY
- —
- Metro
- Providence-Warwick, RI-MA
- State GDP YoY
- ▲ 2.25%
- F500 in state
- 10
Industry mix (Fortune 500 HQ in RI)
| Industry | F500 HQs | Revenue |
|---|---|---|
| Healthcare | 1 | $373B |
|
||
| Food Distribution | 1 | $31B |
|
||
| Aerospace / Defense | 1 | $14B |
|
||
| Financial Services | 1 | $8B |
|
||
| Consumer Goods | 1 | $4B |
|
||
Price history
+50.0% since first listed10 events — show timeline
- 2026-03-03 Pending — RIS
- 2026-01-21 Price Changed $750,000 RIS
- 2025-12-29 Price Changed $770,000 RIS
- 2025-11-25 Listed $779,000 RIS
- 2025-06-30 Listing Removed — RIS
- 2025-03-14 Listed $849,000 RIS
- 2024-12-10 Listing Removed — RIS
- 2024-08-28 Price Changed $550,000 RIS
- 2024-08-10 Price Changed $600,000 RIS
- 2024-08-06 Listed $500,000 RIS
Cash-flow waterfall
monthlySold comps — $/sqft
last 12 mo · ≤1 miLoading sold comps…