 🏷️ Likely Rental
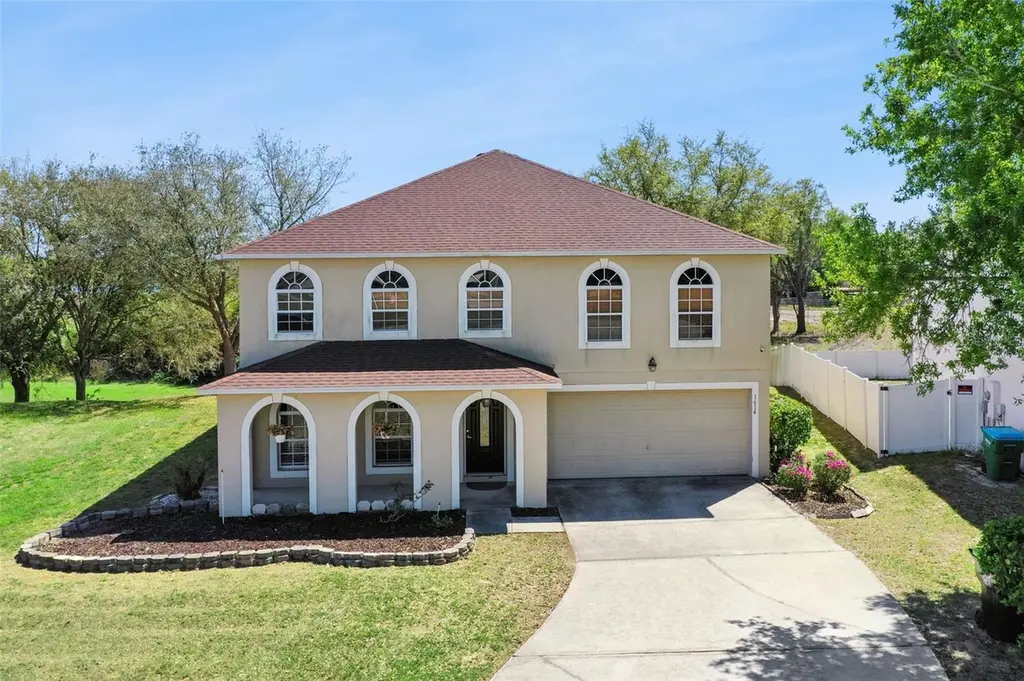
1614 Ridgemoor Dr · Mascotte, FL
Flood risk 1/10 · Minimal
- FEMA flood zone
- X (unshaded)
- Chance of flooding over 30 yrs
- 0.0%
- Est. flood insurance / yr
- $507 – $1,088
Fire risk 6/10 · Moderate
- Est. fire insurance / yr
- $947 – $1,759
Heat risk 8/10 · Major
- Hot days now (above 108°F)
- 7 days/yr
- Hot days in 30 yrs
- 23 days/yr
Wind risk 9/10 · Severe
- Chance of severe wind over 30 yrs
- 99.0%
Air-quality risk 1/10 · Minimal
- Unhealthy air days now
- 0 days/yr
- Unhealthy air days in 30 yrs
- 0 days/yr
Risk factors via First Street. Map © Google.
Why this score? — see what drove the C grade
The composite is a weighted blend of 9 inputs, each scored 0–100. Each bar is that input's sub-score; the figure is the points it added to the 100-point composite (weight × sub-score).
- ARV discount +15.0/15.0
- Cash flow +11.8/30.0
- Appreciation +10.0/10.0
- Schools +4.2/10.0
- Livability +3.6/5.0
- DSCR +3.5/10.0
- 1% rule +2.6/10.0
- Rent growth +2.5/5.0
- Condition / age +2.5/5.0
$380,000
🖨 Deal sheet 📄 Offer letter ✓ Due diligence
Listing remarks MLS
BANK OWNED, SOLD "AS IS", NOT A SHORT SALE. PLEASE ALLOW 2-3 BUSINESS DAYS FOR SELLER RESPONSE. PROPERTY IS TENANT OCCUPIED.
Key facts
- 0.43 acre lot
- 2 garage spots
- Built 2006
Property features AI
Finance
- Other: Homestead exemption applied; Pets allowed
- HOA & community: Has HOA (Dukes Lake HOA / Sentry Management) with required fees; Quarterly association fee of $88 (monthly equivalent $29.33)
Exterior
- Parking: Attached 2-car garage
- Utilities: Public water; Septic sewer; Electricity connected; Water connected; Private utilities available
- Home design: Single family residence; Two-story; Faces northwest
- Construction: Block and frame construction; Shingle roof; Block foundation; Built on a 0.43-acre lot
- Exterior features: Lake view; Asphalt road
Interior
- Kitchen: Range; Microwave; Refrigerator; Electric water heater
- Bedrooms: 4 bedrooms
- Flooring: Carpet; Laminate; Tile
- Bathrooms: 3 full baths; 1 half bath
- Heating & cooling: Central heating; Central air conditioning
- Interior features: Ceiling fans; Walk-in closets
- Laundry & utility: Laundry closet
Neighborhood map
What this means for you Summary
Snapshot
- This is a 4-bed/3.5-bath single-family listed at $380k.
Deal economics
- At list price, monthly cash flow is $-106 ($-1k/yr) — negative.
- To cash-flow at today's rent, offer at most $361k (4.9% below list).
- To meet the 1% rule (rent ≥ 1% of price), the offer needs to be $289k (23.9% below list).
- Recommended offer: $289k (23.9% below list) — sets the bar for 1% rule.
- Cap rate 6.0% vs local median 4.8% in Mascotte — meaningfully above typical; check what's discounted (condition, days-on-market, listing class) to confirm the premium yield is real.
Location & tenants
- Location reads 71/100 on livability (#405 in FL) — a middle-class / working-renter tenant base. Strengths: cost of living A+, housing A+, health & safety A+; Watch: schools D-, amenities F, commute F.
- Lake (suburban): math 49% / reading 50% proficiency, ranked #37 of 73 in FL (top 51%) — families likely to look elsewhere, expect single-tenant / working-renter base with shorter leases.
- Market conditions: 98 active listings in the ZIP; 3 comparable units currently listed for rent nearby; rentals at typical pace (median 24d on market — plan ~3-4 weeks tenant-placement turnaround); solid renter incomes; 4,799 units permitted in Lake County in 2024 (814 in 5+ unit buildings).
- This rent runs 41% of the median local income ($84k/yr) — at the standard rent-burdened threshold; future hikes will face affordability resistance.
Forward outlook
- In year one you build about $41k of equity ($3k loan paydown + $38k appreciation (10.0% local appreciation)).
- Lake County population projected at +37% by 2050 — long-run rental-demand tailwind backs the buy-and-hold thesis.
- By year 2, paydown + projected appreciation supports a ~$65k cash-out refi (75% LTV) — recoverable capital for the next deal without selling this one.
Negotiation context
- It's been on market 91 days — a 9% lower offer ($346k) is reasonable based on typical stale-listing flexibility.
- 6 sale attempts since 20y ago with the ask held roughly flat each time — persistent listings suggest the price (not the market) is what's stuck; bring a comps-based counter.
- Current owner paid $122k; list at $380k implies a 211% gain — meaningful room to come down on a strong offer.
Risks & watch-outs
- Climate carrying-cost: severe wind risk, 99% chance of damaging wind over 30y; major wildfire risk; extreme-heat days projected 7→23/yr by 2055 (HVAC capex compounding) — expect insurance premiums to compound above CPI over the hold.
Questions for the listing agent
- What do current leases actually rent for vs. the listed asking? Can we see a recent rent roll and the last 12 months of T-12 income?
- It's been on market 91 days. Have you received any prior offers? Is the seller open to a 24% concession, seller financing, or rate buy-down credit?
- What does the HOA fee cover, when was the last increase, and are there any pending special assessments or reserve-fund shortfalls?
- Why hasn't it sold? Are there any deal-killer items the seller is aware of (foundation, flood, title, zoning, code violations)?
- Is there a deadline driving the sale (1031 exchange, divorce, estate, relocation)? That informs how much negotiation room exists.
- Schools are D-rated, which usually means shorter tenancies and higher turnover. Who's the typical renter profile here, and what's been the actual vacancy rate?
- What's the average days-on-market for RENTAL listings here right now (not sales)? A rising rental-DOM trend means longer vacancies and softer asking-rent achievability than the comps imply.
- What's the recent tenant-quality profile in this submarket — average credit score on applications, eviction rate, late-payment / NSF rate, and stable-employment percentage? A property-management company in the area should have these aggregated.
- How much new for-sale + rental construction is in the pipeline within 1–3 miles? Heavy new supply typically softens prices + rents 12–24 months out; constrained supply supports both.
Investment metrics
- 1% rule
- 0.76% ✗
- Cap rate
- 5.96%
- Cash-on-cash
- -1.19%
- DSCR
- 0.95
- GRM
- 11.0
CMA / ARV
- ARV (on-the-fly)
- $524,832
- Comps found
- 2
Show comp detail 2 sales within ~0.75 mi
| Address | Dist | Beds/Ba | Sqft | Sold | Price | $/sf | Match |
|---|---|---|---|---|---|---|---|
| 6152 Chorus Dr | 0.59mi | 4/2.5 | 3,269 (+5%) | 8mo | $548,290 | $168 | 54 |
| 2122 Medina Hills Ln | 0.43mi | 5/2.5 (+1) | 3,072 (-2%) | 18mo | $380,000 | $124 | 53 |
Match score weights: distance 35% · size 25% · config 20% · recency 20%. Top-matched comps best support the ARV.
Projected returns pro-forma
10.0% appreciation · 3.0% rent growth · sell at horizon
- IRR
- 23.4%
- Equity multiple
- 2.88×
- Total profit
- $200,114
- Equity at exit
- $342,334
- IRR
- 20.8%
- Equity multiple
- 6.59×
- Total profit
- $594,401
- Equity at exit
- $738,256
Cash invested: $106,400 (down + closing). Projections, not guarantees.
Landlord ↔ Tenant lean methodology
- Overall (STATE)
- 87 Strongly Landlord-Friendly
- State Florida
- 87 Strongly Landlord-Friendly · R+3
- County
- — inherits STATE
- City
- — inherits STATE
ZIP-level market 34753
- Home prices YoY
- 7.2%
- Active inventory
- 98
- Price-to-rent
- 11.0×
Monthly cashflow live
- Estimated rent
- $2,890 medium interval (Pro) →
- Mortgage (P&I)
- −$1,993
- Tax from tax record
- −$209 /mo · $2,509/yr
- Insurance
- −$158
- HOA
- −$29
- Vacancy / Maint / Mgmt
- −$607
- Net cashflow
- $-106
Break-even live
UW: 25.0% down · 7.5% · 30yr · 1.5% tax · 5.0% vac · 8.0% maint · 8.0% mgmt
Financing live
Cash to close
- Down payment
- $95,000
- Closing costs
- $11,400
- Reserves months
- —
- Total cash needed
- —
Loan-product check · same deal, 3 products live
Conventional
25% down · 7.5% · 30yr
- Down + closing
- —
- Monthly P&I
- —
- Monthly cashflow
- —
- DSCR
- —
- Eligible?
- —
Personal DTI + credit; lowest rate.
DSCR
20% down · 8.5% · 30yr
- Down + closing
- —
- Monthly P&I
- —
- Monthly cashflow
- —
- DSCR
- —
- Eligible?
- —
No personal income docs; deal must DSCR.
Hard money
10% down · 12.0% · 12mo
- Down + closing
- —
- Monthly P&I
- —
- Monthly cashflow
- —
- DSCR
- —
- Eligible?
- —
Short-term bridge; refi at stabilization.
Rent comps 3 comps
| Address | Beds | Baths | Sqft | Rent | $/sqft | DOM | Units | Dist |
|---|---|---|---|---|---|---|---|---|
| 1063 Bluegrass Dr Groveland, FL | 4.0 | 2.0 | 2182 | $2,500 | $1.15 | 23d | 1 | 0.76mi |
| 5990 Churchill Square Way Groveland, FL | 5.0 | 3.0 | 2696 | $2,889 | $1.07 | 2d | 1 | 1.39mi |
| 187 Hydra Way Groveland, FL | 4.0 | 3.0 | 2542 | $2,699 | $1.06 | 23d | 1 | 1.42mi |
HOA detail
- Monthly dues
- $29 · $348/yr
Listing history 24 events
-
2026-06-18days on market $380,000 Active 91 DOM
-
2026-06-17days on market $380,000 Active 90 DOM
-
2026-06-16days on market $380,000 Active 89 DOM
-
2026-06-15days on market $380,000 Active 88 DOM
-
2026-06-13days on market $380,000 Active 86 DOM
-
2026-06-09days on market $380,000 Active 82 DOM
-
2026-06-08days on market $380,000 Active 81 DOM
-
2026-06-07days on market $380,000 Active 80 DOM
-
2026-06-04days on market $380,000 Active 77 DOM
-
2026-06-03days on market $380,000 Active 76 DOM
-
2026-06-02days on market $380,000 Active 75 DOM
-
2026-06-01days on market $380,000 Active 74 DOM
-
2026-05-31days on market $380,000 Active 73 DOM
-
2026-03-19$380,000 Active
-
2009-10-27soldstatus $122,000 134-char remark
Show marketing remark (134 chars)
BANK OWNED, SOLD "AS IS", NOT A SHORT SALE. PLEASE ALLOW 2-3 BUSINESS DAYS FOR SELLER RESPONSE. PROPERTY IS TENANT OCCUPIED.
-
2009-09-29$119,900 134-char remark
Show marketing remark (134 chars)
BANK OWNED, SOLD "AS IS", NOT A SHORT SALE. PLEASE ALLOW 2-3 BUSINESS DAYS FOR SELLER RESPONSE. PROPERTY IS TENANT OCCUPIED.
-
2009-08-11historical
-
2008-08-14$159,900
-
2008-08-13historical
-
2008-05-09$199,900
-
2008-05-08historical
-
2007-01-27$239,900
-
2006-11-22soldstatus $248,000
-
2006-09-15$251,800
ⓘ Source: listings_history table (triggers on properties + properties_extension) + one-shot
backfill from property_details.listing_events for pre-trigger history.
Tax reassessment forecast FL · Resets to sale price
- Current annual tax
- $2,509 · $209/mo
- Projected year-2 tax
- $3,154 · $263/mo
- Expected delta
- +$645/yr (+$54/mo · 25.7%)
ⓘ Screening estimate from a state-policy table — verify with the county assessor before closing.
Climate risk First Street
- Flood 1/10 Low FEMA zone X (unshaded) · 0% chance over 30 yrs
- Wildfire 6/10 Major
- Heat 8/10 Severe 7 d/yr ≥108°F today · 23 d/yr by 30 yrs out
- Wind 9/10 Extreme 99% chance of damaging wind over 30 yrs
- Air quality 1/10 Low 0 unhealthy d/yr today · 0 by 30 yrs out
Nearby sold comps map
Loading sold comps map…
Walkable amenities ~0.75 mi
Loading nearby amenities…
Taxation est. · year 1
- Rental income
- $34,683
- − Mortgage interest
- −$21,286
- − Property taxes
- −$2,509
- − Insurance
- −$1,900
- − Repairs & maintenance
- −$2,775
- − Management
- −$2,775
- − HOA
- −$348
- − Depreciation
- −$11,055
- Taxable loss
- −$7,963
- Est. tax savings @ 24.0%
- +$1,911
- After-tax cash flow
- $641/yr
For passive investors: Depreciation is non-cash, so a rental often shows a tax loss while cash-flowing — sheltering income. Rental losses are passive: they offset passive income freely, and up to $25,000/yr can offset ordinary (W-2) income if you actively participate and your MAGI is under $100k (phasing out to $0 by $150k); unused losses carry forward. On sale, claimed depreciation is recaptured at up to 25%, and gains may owe capital-gains tax (a 1031 exchange can defer both). Figures are a year-1 estimate at your 24.0% rate — not tax advice; consult a CPA.
Schools (NCES district)
- District
- Lake
- NCES district ID
- 1201050
- Math proficiency
- 49% ▼ -7.00%
- Reading proficiency
- 50% ▼ -4.00%
- Median HH income
- $46,632
- Composite
- 42.05/100
- National rank
- #3327
- State rank
- #37 of 73 in FL
Livability — Mascotte
- Score
- 71/100
- State rank
- #405
- US rank
- #7156
Category grades
Schools grade is shown separately in the Schools card above.
Census & demographics
- Census place
- Mascotte, FL
- County
- Lake County · 364,602 people
- City population
- 33,565
- Metro
- Orlando-Kissimmee-Sanford, FL
- Population (ZIP)
- 7,985
- Household income
- $83,868
- Rent vs Own
- Severe rent burden
- 16.0
Population outlook (Lake County) Hauer SSP2
- Today (2025)
- 386,640 people
- By 2030
- 417,107 · +7.9%
- By 2040
- 476,676 · +23.3%
- By 2050
- 531,296 · +37.4%
- By 2075
- 648,303 · +67.7%
- By 2100
- 698,530 · +80.7%
Race, ethnicity, and origin ACS 2023
- Neighborhood character
- Diverse neighborhood (Simpson 0.69)
- Race & ethnicity
- White 38% Hispanic / Latino 35% Two or more races 25% Black 20% Asian 3%
- Hispanic origin (detail)
- Mexican 11% Puerto Rican 12% Dominican 2%
- Common ancestry
- Slovak 1% Serbian 1% Romanian 1%
- Foreign-born
- 10% · Canada, Jamaica
- Languages at home
- 67% English-only · Spanish 32%
Political lean MEDSL · Lake
- 2024 margin
- Strong R (+24.7) · D 37.3% · R 62.0%
- 2008→2024 swing
- -11.2pp toward R · 2008: -13.5pp · 2024: -24.7pp
- All cycles
- 2024: R+24.7 2020: R+20.0 2016: R+23.1 2012: R+17.1 2008: R+13.5
Not yet ingested
- Civics
- —
Market trends
- HPI YoY
- ▲ 19.01%
- Current HPI
- 281.96
- Rent YoY
- —
- Metro
- Orlando-Kissimmee-Sanford, FL
- State GDP YoY
- ▲ 3.28%
- F500 in state
- 36
Industry mix (Fortune 500 HQ in FL)
| Industry | F500 HQs | Revenue |
|---|---|---|
| Industrial Technology | 2 | $29B |
|
||
| Insurance | 2 | $17B |
|
||
| Retail | 1 | $60B |
|
||
| Technology Distribution | 1 | $58B |
|
||
| Homebuilding | 1 | $35B |
|
||
| Technology Manufacturing | 1 | $35B |
|
||
Price history
+50.9% since first listed11 events — show timeline
- 2026-03-19 Listed $380,000 Stellar MLS as Distributed by MLS Grid
- 2009-10-27 Sold (MLS) $122,000 Stellar MLS as Distributed by MLS Grid
- 2009-09-29 Listed $119,900 Stellar MLS as Distributed by MLS Grid
- 2009-08-11 Listing Removed — Stellar MLS as Distributed by MLS Grid
- 2008-08-14 Listed $159,900 Stellar MLS as Distributed by MLS Grid
- 2008-08-13 Listing Removed — Stellar MLS as Distributed by MLS Grid
- 2008-05-09 Listed $199,900 Stellar MLS as Distributed by MLS Grid
- 2008-05-08 Listing Removed — Stellar MLS as Distributed by MLS Grid
- 2007-01-27 Listed $239,900 Stellar MLS as Distributed by MLS Grid
- 2006-11-22 Sold (MLS) $248,000 Stellar MLS as Distributed by MLS Grid
- 2006-09-15 Listed $251,800 Stellar MLS as Distributed by MLS Grid
Property tax history
+4.2%/yrLatest (2025): $2,509 · +6.1% YoY. Source: county tax records.
Cash-flow waterfall
monthlySold comps — $/sqft
last 12 mo · ≤1 miLoading sold comps…