 Multi-family
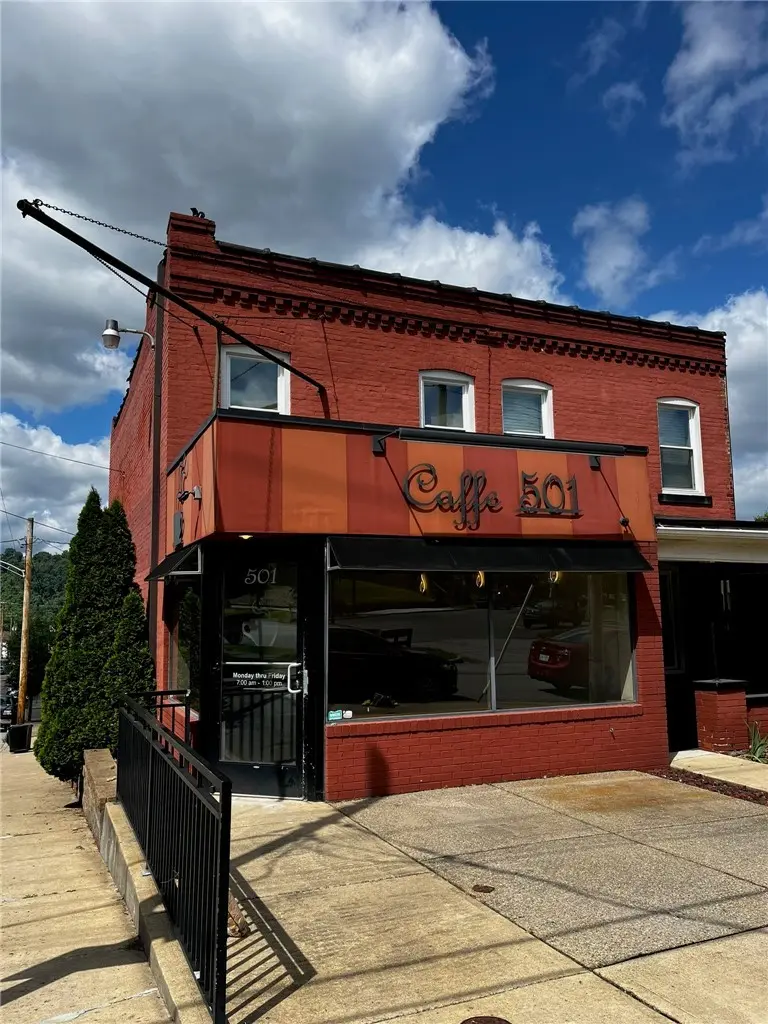
501 Glenwood Ave · Ambridge, PA
Flood risk 1/10 · Minimal
- FEMA flood zone
- X (unshaded)
- Chance of flooding over 30 yrs
- 0.0%
- Est. flood insurance / yr
- $507 – $1,088
Fire risk 2/10 · Minimal
- Est. fire insurance / yr
- $511 – $949
Heat risk 4/10 · Minor
- Hot days now (above 97°F)
- 7 days/yr
- Hot days in 30 yrs
- 19 days/yr
Wind risk 2/10 · Minimal
- Chance of severe wind over 30 yrs
- 0.0%
Air-quality risk 3/10 · Minor
- Unhealthy air days now
- 2 days/yr
- Unhealthy air days in 30 yrs
- 3 days/yr
Risk factors via First Street. Map © Google.
Why this score? — see what drove the B- grade
The composite is a weighted blend of 9 inputs, each scored 0–100. Each bar is that input's sub-score; the figure is the points it added to the 100-point composite (weight × sub-score).
- Cash flow +30.0/30.0
- DSCR +10.0/10.0
- 1% rule +8.8/10.0
- ARV discount +7.5/15.0
- Condition / age +4.0/5.0
- Livability +3.9/5.0
- Schools +3.1/10.0
- Rent growth +2.5/5.0
- Appreciation +0.0/10.0
$385,000
🖨 Deal sheet (PDF) 📄 Offer letter ✓ Due diligence
Multi-family units
County records classify this as Multi-Family (5+ Unit). Listing-text estimate: 1 unit. estimate disagrees with records
5+ unit building — per-unit beds/baths from public records are typically unavailable; the breakdown below (if shown) is an estimate from the listing text.
Listing remarks
Excellent Turn-key mixed use property in the heart of Ambridge. 100% occupied with happy tenants. The portfolio includes 2 newly renovated 2-bedroom residential units, a retail store front with excellent visibility, a 1-chair barber shop and 2 garages. Unit 501R has all new windows, new LVP flooring and newer carpet in the bedrooms. Custom window treatments, Mitsubishi mini-split heating and cooling system. There is a washer/dryer set up and storage in the basement. Unit 503 is a newly remodeled 2 bedroom, 1.5 bath with new kitchen cabinets and lighting. Hardwood floors on the main level and carpeted upper level. Kitchen island with butcher block top. There is a private patio and the large
Key facts
- Mixed use property
- Barber shop
- Retail store front
Tags
Property features AI
Finance
- Financial info: Gross income reported at $38,400; Utilities expense reported at $1,100; Insurance expense reported at $3,500; Individual unit rents reported: $150, $400, $600, $1,250, $800
Exterior
- Parking: Detached garage; On-street parking
- Utilities: Electricity available; Natural gas available; Sewer available; Water available
- Home design: Multi-unit property with 5 total units
- Construction: Brick construction; Asphalt roof
- Exterior features: Zoned commercial; 0.07-acre lot
Interior
- Kitchen: No appliance details provided
- Bedrooms: Two 2-bedroom units
- Bathrooms: Units with a mix of 1 full and 1 half bathroom; Units with 1 bathroom
- Interior features: Unfinished basement; Public transportation access
- Laundry & utility: No laundry details provided
Neighborhood map
What this means for you Summary
Snapshot
- This is a 4-bed/3.5-bath multifamily listed at $385k. Condition is rated good.
Deal economics
- At list price, monthly cash flow is $2k ($18k/yr) — positive.
- The deal already cash-flows at list — no discount required.
- Meets the 1% rule at list price ($5k rent vs $385k).
- Recommended offer: $379k (1.5% below list) — sets the bar for market timing.
- Cap rate 11.1% vs local median 6.6% in Ambridge — top-decile yield for the area; either an underpriced asset or a hidden risk that comps aren't pricing in. Stress-test before assuming the spread holds.
Location & tenants
- Location reads 78/100 on livability (#293 in PA, #2,594 nationally) — a middle-class / working-renter tenant base. Strengths: commute A+, cost of living A+, housing A+; Watch: schools D+, employment D+, crime F.
- Ambridge Area SD (suburban): math 23% / reading 48% proficiency, ranked #408 of 539 in PA (top 76%) — families likely to look elsewhere, expect single-tenant / working-renter base with shorter leases.
- Market conditions: 58 active listings in the ZIP; 11 comparable units currently listed for rent nearby; rentals at typical pace (median 22d on market — plan ~3-4 weeks tenant-placement turnaround); 272 units permitted in Beaver County in 2024 (80 in 5+ unit buildings).
- At $5,300/mo this rent would consume 107% of the median local household income ($60k/yr) (locally 397% of renters already pay >50% of income on rent) — very limited rent-growth headroom before tenants either downsize or default.
Forward outlook
- Local home prices are declining (-3.0%/yr); year-one equity from $3k of loan paydown is wiped out by about $12k of value loss. Plan a longer hold.
- Beaver County population projected at -14% by 2050 — secular population decline; favor cash flow + early exit over multi-decade hold.
- At projected returns (-3.0% appreciation + 3.0% rent growth), your $108k cash investment doubles in ~8 years — after that, you're playing with house money.
Negotiation context
- It's been on market 15 days — a 2% lower offer ($379k) is reasonable based on typical stale-listing flexibility.
Risks & watch-outs
- Watch-outs: built in 1904 — expect roof / HVAC / electrical / plumbing capex.
Questions for the listing agent
- Built in 1904 — when were the roof, HVAC, electrical panel, plumbing, and water heater last replaced?
- Is there a deadline driving the sale (1031 exchange, divorce, estate, relocation)? That informs how much negotiation room exists.
- Schools are D-rated, which usually means shorter tenancies and higher turnover. Who's the typical renter profile here, and what's been the actual vacancy rate?
- Crime grade is F in this area — have there been break-ins, vandalism, or insurance claims at this property in the last 3 years? What carrier currently insures it and at what premium?
- What's the average days-on-market for RENTAL listings here right now (not sales)? A rising rental-DOM trend means longer vacancies and softer asking-rent achievability than the comps imply.
- What's the recent tenant-quality profile in this submarket — average credit score on applications, eviction rate, late-payment / NSF rate, and stable-employment percentage? A property-management company in the area should have these aggregated.
- How much new apartment / multifamily construction is in the pipeline within 1–3 miles? Heavy new supply (>2% of stock underway) typically softens rents 12–24 months out; light construction supports rent growth.
Investment metrics
- 1% rule
- 1.38% ✓
- Cap rate
- 11.05%
- Cash-on-cash
- 16.99%
- DSCR
- 1.76
- GRM
- 6.1
CMA / ARV
No comps found within radius.
Show comp detail 12 sales within ~0.75 mi
| Address | Dist | Beds/Ba | Sqft | Sold | Price | $/sf | Match |
|---|---|---|---|---|---|---|---|
| 903 Beaver Rd | 0.37mi | 4/2.0 | — | 1mo | $105,000 | — | 63 |
| 340 Park Rd | 0.24mi | 4/2.0 | — | 10mo | $180,000 | — | 62 |
| 839 Beaver Rd | 0.34mi | 4/2.0 | — | 6mo | $70,000 | — | 61 |
| 816 Beaver Rd | 0.30mi | 4/2.0 | — | 10mo | $125,000 | — | 59 |
| 256 Maplewood | 0.28mi | 4/2.0 | — | 12mo | $135,000 | — | 59 |
| 941 Pine St | 0.45mi | 5/3.0 (+1) | — | 5mo | $192,000 | — | 56 |
| 952 Melrose Ave | 0.46mi | 3/2.0 (-1) | — | 1mo | $230,000 | — | 54 |
| 1110-1112 Maplewood Ave | 0.61mi | 4/2.0 | — | 0mo | $160,000 | — | 53 |
| 939 Beaver Rd | 0.44mi | 3/2.0 (-1) | — | 7mo | $95,000 | — | 50 |
| 898 11th St | 0.59mi | 3/3.0 (-1) | — | 13mo | $200,000 | — | 42 |
| 1318 Duss Ave | 0.74mi | 4/2.0 | — | 7mo | $157,000 | — | 42 |
| 903 11th St | 0.62mi | 3/2.0 (-1) | — | 11mo | $65,000 | — | 38 |
Match score weights: distance 35% · size 25% · config 20% · recency 20%. Top-matched comps best support the ARV.
Projected returns pro-forma
-3.0% appreciation · 3.0% rent growth · sell at horizon
- IRR
- 8.3%
- Equity multiple
- 1.32×
- Total profit
- $34,908
- Equity at exit
- $57,405
- IRR
- 17.5%
- Equity multiple
- 2.45×
- Total profit
- $155,901
- Equity at exit
- $33,288
Cash invested: $107,800 (down + closing). Projections, not guarantees.
Landlord ↔ Tenant lean methodology
- Overall (STATE)
- 62 Landlord-Friendly
- State Pennsylvania
- 62 Landlord-Friendly · EVEN
- County
- — inherits STATE
- City
- — inherits STATE
ZIP-level market 15003
- Home prices YoY
- -15.7%
- Active inventory
- 58
- Price-to-rent
- 34.9×
Monthly cashflow live
- Estimated rent
- $5,300 high interval (Pro) →
- Mortgage (P&I)
- −$2,019
- Tax est. 1.5%
- −$481 /mo · $5,775/yr
- Insurance
- −$160
- HOA
- −$0
- Vacancy / Maint / Mgmt
- −$1,113
- Net cashflow
- $1,526
Break-even live
Sensitivity live
| Price | -10% $1,792 | -5% $1,659 | +0% $1,526 | +5% $1,393 | +10% $1,260 |
|---|---|---|---|---|---|
| Rent | -10% $1,108 | -5% $1,317 | +0% $1,526 | +5% $1,736 | +10% $1,945 |
| Rate | -1.0pp $1,720 | -0.5pp $1,624 | base $1,526 | +0.5pp $1,427 | +1.0pp $1,325 |
6-unit breakdown (identical units grouped — click to expand)
| Units | Beds | Baths | Est. rent |
|---|---|---|---|
| 4× units | 2 | 1.5 | $3,672 |
| #1 | 2 | 1.5 | $918 |
| #2 | 2 | 1.5 | $918 |
| #3 | 2 | 1.5 | $918 |
| #4 | 2 | 1.5 | $918 |
| 1× unit | 1 | 0 | $766 |
| 1× unit | 0 | 0 | $862 |
| Total (6 units) | $5,300 | ||
UW: 25.0% down · 7.5% · 30yr · 1.5% tax · 5.0% vac · 8.0% maint · 8.0% mgmt
Financing live
Cash to close
- Down payment
- $96,250
- Closing costs
- $11,550
- Reserves months
- —
- Total cash needed
- —
Loan-product check · same deal, 3 products live
Conventional
25% down · 7.5% · 30yr
- Down + closing
- —
- Monthly P&I
- —
- Monthly cashflow
- —
- DSCR
- —
- Eligible?
- —
Personal DTI + credit; lowest rate.
DSCR
20% down · 8.5% · 30yr
- Down + closing
- —
- Monthly P&I
- —
- Monthly cashflow
- —
- DSCR
- —
- Eligible?
- —
No personal income docs; deal must DSCR.
Hard money
10% down · 12.0% · 12mo
- Down + closing
- —
- Monthly P&I
- —
- Monthly cashflow
- —
- DSCR
- —
- Eligible?
- —
Short-term bridge; refi at stabilization.
Rent comps 11 comps
| Address | Beds | Baths | Sqft | Rent | $/sqft | DOM | Units | Dist |
|---|---|---|---|---|---|---|---|---|
| 699 Olive Ln Ambridge, PA | 3.0 | 2.0 | — | $895 | — | 22d | 1 | 0.20mi |
| 355 Maplewood Ave Ambridge, PA | 3.0 | 1.0 | 800 | $935 | $1.17 | 44d | 1 | 0.22mi |
| 332 Elm Rd Ambridge, PA | 3.0 | 1.0 | 1 | $1,600 | $1600.00 | 44d | 1 | 0.22mi |
| 640 Pine St Ambridge, PA | 3.0 | 1.0 | — | $1,500 | — | 2d | 1 | 0.23mi |
| 730 Maplewood Ave Ambridge, PA | 3.0 | 2.0 | — | $1,400 | — | 2d | 1 | 0.30mi |
| 121 Locust St Ambridge, PA | 2.0–3.0 | 1.0 | 875 | $1,250 | $1.43 | 2d | 3 | 0.43mi |
| 793 Valley Rd Ambridge, PA | 3.0 | 2.0 | — | $1,575 | — | 44d | 1 | 0.66mi |
| 1324 Beaver Rd Unit 2 Ambridge, PA | 3.0 | 1.0 | — | $795 | — | 24d | 1 | 0.74mi |
| 1324 Beaver Rd Unit 1 Ambridge, PA | 3.0 | 1.0 | — | $825 | — | 24d | 1 | 0.74mi |
| 1700 Beaver Rd Ambridge, PA | 3.0 | 1.0 | 1099 | $1,495 | $1.36 | 17d | 1 | 0.96mi |
| 266 Beaver St Leetsdale, PA | 3.0 | 1.0 | 1766 | $1,350 | $0.76 | 2d | 1 | 1.35mi |
Listing history 10 events
-
2026-06-18days on market $385,000 Active 15 DOM
-
2026-06-17days on market $385,000 Active 14 DOM
-
2026-06-16days on market $385,000 Active 13 DOM
-
2026-06-15days on market $385,000 Active 12 DOM
-
2026-06-13days on market $385,000 Active 10 DOM
-
2026-06-13days on market $385,000 Active 9 DOM
-
2026-06-09days on market $385,000 Active 6 DOM
-
2026-06-08days on market $385,000 Active 5 DOM
-
2026-06-07remarks 699-char remark
-
2026-06-07$385,000 Active 4 DOM
ⓘ Source: listings_history table (triggers on properties + properties_extension) + one-shot
backfill from property_details.listing_events for pre-trigger history.
Climate risk First Street
- Flood 1/10 Low FEMA zone X (unshaded) · 0% chance over 30 yrs
- Wildfire 2/10 Low
- Heat 4/10 Moderate 7 d/yr ≥97°F today · 19 d/yr by 30 yrs out
- Wind 2/10 Low 0% chance of damaging wind over 30 yrs
- Air quality 3/10 Moderate 2 unhealthy d/yr today · 3 by 30 yrs out
Nearby sold comps map
Loading sold comps map…
Walkable amenities ~0.75 mi
Loading nearby amenities…
Taxation est. · year 1
- Rental income
- $63,600
- − Mortgage interest
- −$21,566
- − Property taxes
- −$5,775
- − Insurance
- −$1,925
- − Repairs & maintenance
- −$5,088
- − Management
- −$5,088
- − Depreciation
- −$11,200
- Taxable income
- $12,958
- Est. tax owed @ 24.0%
- −$3,110
- After-tax cash flow
- $15,206/yr
For passive investors: Depreciation is non-cash, so a rental often shows a tax loss while cash-flowing — sheltering income. Rental losses are passive: they offset passive income freely, and up to $25,000/yr can offset ordinary (W-2) income if you actively participate and your MAGI is under $100k (phasing out to $0 by $150k); unused losses carry forward. On sale, claimed depreciation is recaptured at up to 25%, and gains may owe capital-gains tax (a 1031 exchange can defer both). Figures are a year-1 estimate at your 24.0% rate — not tax advice; consult a CPA.
Condition & rehab AI · 13 photos
A well-maintained multi-family property with newly renovated units, good curb appeal, and a good condition score.
Value-add opportunities
- Both landscaping — enhances curb appeal and rental value
- Both paint — refreshes the exterior and interior
- Both HVAC system — improves comfort and energy efficiency
Renovation cost estimate screening
Value-add ROI direction
- Both landscaping — enhances curb appeal and rental value ↑
- Both paint — refreshes the exterior and interior ↑
- Both HVAC system — improves comfort and energy efficiency ↑
ⓘ Cost ranges are severity-bucket heuristics (US national rule-of-thumb). Get contractor quotes + a written scope before underwriting a rehab budget.
Schools (NCES district)
- District
- Ambridge Area SD
- NCES district ID
- 4202440
- Math proficiency
- 23% ▼ -12.00%
- Reading proficiency
- 48% ▼ -10.00%
- Median HH income
- $49,514
- Composite
- 30.62/100
- National rank
- #6190
- State rank
- #408 of 539 in PA
Livability — Ambridge
- Score
- 78/100
- State rank
- #293
- US rank
- #2594
Category grades
Schools grade is shown separately in the Schools card above.
Census & demographics
- Census place
- Ambridge, PA
- County
- Beaver County · 116,001 people
- City population
- 11,387
- Metro
- Pittsburgh, PA
- Population (ZIP)
- 11,387
- Household income
- $59,550
- Rent vs Own
- Severe rent burden
- 397.0
Population outlook (Beaver County) Hauer SSP2
- Today (2025)
- 164,976 people
- By 2030
- 161,449 · -2.1%
- By 2040
- 151,752 · -8.0%
- By 2050
- 141,155 · -14.4%
- By 2075
- 118,142 · -28.4%
- By 2100
- 91,740 · -44.4%
Race, ethnicity, and origin ACS 2023
- Neighborhood character
- Predominantly White (77%)
- Race & ethnicity
- White 77% Two or more races 10% Black 9% Hispanic / Latino 7%
- Hispanic origin (detail)
- Mexican 2% Puerto Rican 3%
- Common ancestry
- Romanian 7% Scotch-Irish 3% Subsaharan African 3%
- Foreign-born
- 3% · Canada
- Languages at home
- 95% English-only · Other Indo-European 2% Spanish 2% Russian/Polish/Slavic 1%
Political lean MEDSL · Beaver
- 2024 margin
- Strong R (+20.7) · D 39.2% · R 59.9%
- 2008→2024 swing
- -17.9pp toward R · 2008: -2.8pp · 2024: -20.7pp
- All cycles
- 2024: R+20.7 2020: R+17.7 2016: R+20.1 2012: R+6.6 2008: R+2.8
Not yet ingested
- Civics
- —
Market trends
- HPI YoY
- ▼ -46.42%
- Current HPI
- 249.8525
- Rent YoY
- —
- Metro
- Pittsburgh, PA
- State GDP YoY
- ▲ 1.68%
- F500 in state
- 34
Industry mix (Fortune 500 HQ in PA)
| Industry | F500 HQs | Revenue |
|---|---|---|
| Healthcare | 2 | $309B |
|
||
| Insurance | 2 | $27B |
|
||
| Telecommunications / Media | 1 | $124B |
|
||
| Industrial Distribution | 1 | $22B |
|
||
| Financial Services | 1 | $20B |
|
||
| Chemicals / Materials | 1 | $18B |
|
||
Price history
1 event — show timeline
- 2026-06-03 Listed $385,000 West Penn MLS
Cash-flow waterfall
monthlySold comps — $/sqft
last 12 mo · ≤1 miLoading sold comps…