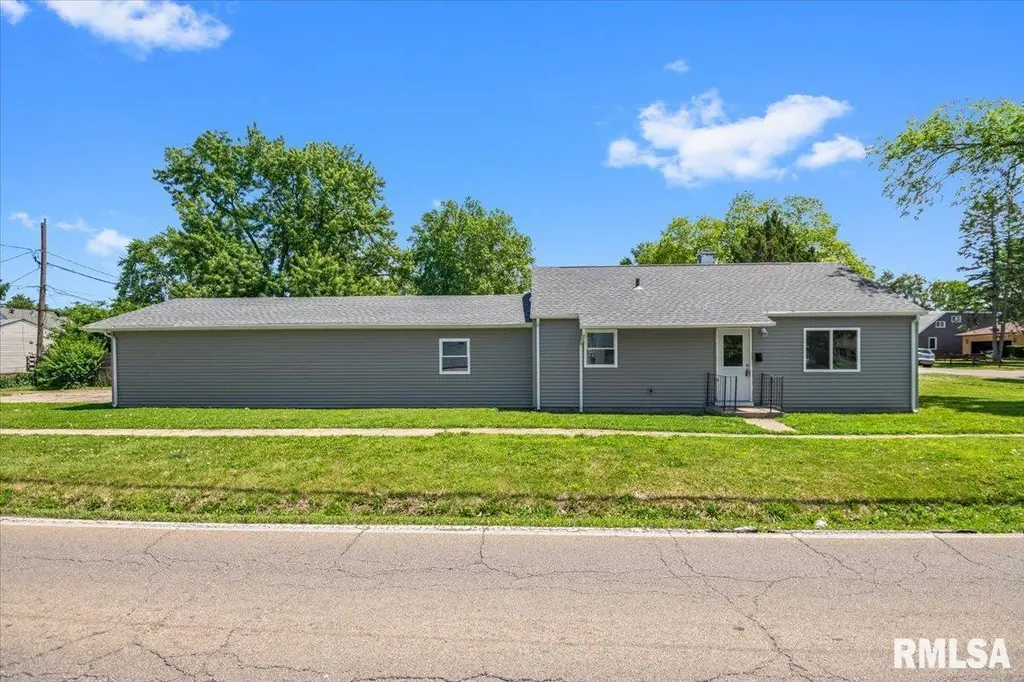
2201 E Converse St · Grandview, IL
Flood risk 3/10 · Minor
- FEMA flood zone
- X (unshaded)
- Chance of flooding over 30 yrs
- 0.1%
- Est. flood insurance / yr
- $473 – $860
Fire risk 1/10 · Minimal
- Est. fire insurance / yr
- $804 – $1,492
Heat risk 4/10 · Minor
- Hot days now (above 104°F)
- 7 days/yr
- Hot days in 30 yrs
- 20 days/yr
Wind risk 2/10 · Minimal
- Chance of severe wind over 30 yrs
- 1.0%
Air-quality risk 2/10 · Minimal
- Unhealthy air days now
- 1 days/yr
- Unhealthy air days in 30 yrs
- 1 days/yr
Risk factors via First Street. Map © Google.
Why this score? — see what drove the C- grade
The composite is a weighted blend of 9 inputs, each scored 0–100. Each bar is that input's sub-score; the figure is the points it added to the 100-point composite (weight × sub-score).
- Cash flow +21.6/30.0
- ARV discount +7.5/15.0
- DSCR +6.9/10.0
- 1% rule +6.4/10.0
- Livability +3.9/5.0
- Rent growth +3.7/5.0
- Condition / age +2.5/5.0
- Schools +1.7/10.0
- Appreciation +0.0/10.0
$109,900
🖨 Deal sheet 📄 Offer letter ✓ Due diligence
Listing remarks MLS
This beautifully updated 3-bed, 1-bath ranch is like new from top to bottom! Featuring a brand-new roof, siding, windows, soffit, fascia, gutters, interior and exterior doors, water heater, and insulation, this home is built for comfort and efficiency. Step inside to find new drywall, fresh paint, updated lighting, and stunning new flooring throughout. The kitchen and bathroom have been completely gutted and redesigned to be functional and efficient. Enjoy the peace of mind of a fully renovated home—just move in and make it yours!
Key facts
- New siding
- New soffit
- 2025 renovations
Tags
Property features AI
Exterior
- Parking: Attached 2-car garage
- Utilities: Public water; Public sewer
- Home design: Single family residence; Shingle roof
- Construction: Not new construction
- Exterior features: Corner, level lot; Paved road access
Interior
- Kitchen: Microwave; Refrigerator
- Bedrooms: 3 bedrooms (Bedroom 1, Bedroom 2, Bedroom 3)
- Flooring: Carpet in bedrooms and some rooms; Luxury vinyl plank in kitchen and living areas
- Bathrooms: 1 full bathroom
- Heating & cooling: Forced air heating; Central air conditioning
- Interior features: Ceiling fans
- Laundry & utility: Laundry room; Washer; Dryer
Neighborhood map
What this means for you Summary
Snapshot
- This is a 3-bed/1.0-bath other listed at $110k.
Deal economics
- At list price, monthly cash flow is $167 ($2k/yr) — positive.
- The deal already cash-flows at list — no discount required.
- Meets the 1% rule at list price ($1k rent vs $110k).
- Recommended offer: $108k (1.5% below list) — sets the bar for market timing.
Location & tenants
- Location reads 77/100 on livability (#171 in IL, #3,167 nationally) — a middle-class / working-renter tenant base. Strengths: commute A+, cost of living A+, crime A; Watch: schools F, amenities F, employment F.
- Springfield SD 186 (urban): math 17% / reading 22% proficiency, ranked #438 of 620 in IL (top 71%) — low school quality limits family demand, transient renter base, plan for 1-2y turnover; 64% free/reduced lunch — lower-income household profile, screen leases tightly.
- Market conditions: Rents rising fast (+5.0%/yr); 131 active listings in the ZIP; 9 comparable units currently listed for rent nearby; rentals at typical pace (median 21d on market — plan ~3-4 weeks tenant-placement turnaround); 225 units permitted in Sangamon County in 2024 (48 in 5+ unit buildings).
Forward outlook
- Local home prices are declining (-3.0%/yr); year-one equity from $760 of loan paydown is wiped out by about $3k of value loss. Plan a longer hold.
- Sangamon County population projected to shrink 9% by 2050 — rents likely to lag national; underwrite the cash flow, not the appreciation.
Negotiation context
- It's been on market 21 days — a 2% lower offer ($108k) is reasonable based on typical stale-listing flexibility.
- 2 sale attempts; this cycle's ask has dropped $20k (15%) from the opening price — seller is motivated, your offer sets the floor, not the list.
Questions for the listing agent
- Is there a deadline driving the sale (1031 exchange, divorce, estate, relocation)? That informs how much negotiation room exists.
- Schools are F-rated, which usually means shorter tenancies and higher turnover. Who's the typical renter profile here, and what's been the actual vacancy rate?
- What's the average days-on-market for RENTAL listings here right now (not sales)? A rising rental-DOM trend means longer vacancies and softer asking-rent achievability than the comps imply.
- What's the recent tenant-quality profile in this submarket — average credit score on applications, eviction rate, late-payment / NSF rate, and stable-employment percentage? A property-management company in the area should have these aggregated.
- How much new for-sale + rental construction is in the pipeline within 1–3 miles? Heavy new supply typically softens prices + rents 12–24 months out; constrained supply supports both.
Investment metrics
- 1% rule
- 1.14% ✓
- Cap rate
- 8.12%
- Cash-on-cash
- 6.52%
- DSCR
- 1.29
- GRM
- 7.3
CMA / ARV
No comps found within radius.
Projected returns pro-forma
-3.0% appreciation · 4.95% rent growth · sell at horizon
- IRR
- -3.9%
- Equity multiple
- 0.85×
- Total profit
- $-4,596
- Equity at exit
- $16,386
- IRR
- 8.1%
- Equity multiple
- 1.67×
- Total profit
- $20,633
- Equity at exit
- $9,502
Cash invested: $30,772 (down + closing). Projections, not guarantees.
Landlord ↔ Tenant lean methodology
- Overall (STATE)
- 43 Moderately Tenant-Leaning
- State Illinois
- 43 Moderately Tenant-Leaning · D+7
- County
- — inherits STATE
- City
- — inherits STATE
ZIP-level market 62702
- Home prices YoY
- -34.9%
- Rents YoY
- 5.0%
- Active inventory
- 131
- Price-to-rent
- 7.3×
Monthly cashflow live
- Estimated rent
- $1,251 high interval (Pro) →
- Mortgage (P&I)
- −$576
- Tax from tax record
- −$199 /mo · $2,388/yr
- Insurance
- −$46
- HOA
- −$0
- Vacancy / Maint / Mgmt
- −$263
- Net cashflow
- $167
Break-even live
UW: 25.0% down · 7.5% · 30yr · 1.5% tax · 5.0% vac · 8.0% maint · 8.0% mgmt
Financing live
Cash to close
- Down payment
- $27,475
- Closing costs
- $3,297
- Reserves months
- —
- Total cash needed
- —
Loan-product check · same deal, 3 products live
Conventional
25% down · 7.5% · 30yr
- Down + closing
- —
- Monthly P&I
- —
- Monthly cashflow
- —
- DSCR
- —
- Eligible?
- —
Personal DTI + credit; lowest rate.
DSCR
20% down · 8.5% · 30yr
- Down + closing
- —
- Monthly P&I
- —
- Monthly cashflow
- —
- DSCR
- —
- Eligible?
- —
No personal income docs; deal must DSCR.
Hard money
10% down · 12.0% · 12mo
- Down + closing
- —
- Monthly P&I
- —
- Monthly cashflow
- —
- DSCR
- —
- Eligible?
- —
Short-term bridge; refi at stabilization.
Rent comps 9 comps
| Address | Beds | Baths | Sqft | Rent | $/sqft | DOM | Units | Dist |
|---|---|---|---|---|---|---|---|---|
| 2281 E Keys Ave Springfield, IL | 2.0 | 1.0 | 800 | $1,200 | $1.50 | 43d | 1 | 0.17mi |
| 3501 E Ridgely Ave Unit FR21 Springfield, IL | 3.0 | 2.0 | 1216 | $1,129 | $0.93 | 20d | 1 | 0.37mi |
| 920 N 19th St Springfield, IL | 3.0 | 1.0 | 1000 | $1,100 | $1.10 | 20d | 1 | 0.65mi |
| 3064 Louise Ln Springfield, IL | 3.0 | 1.0 | 1100 | $1,350 | $1.23 | 20d | 1 | 0.84mi |
| 302 Forrest Ave Springfield, IL | 3.0 | 2.0 | 924 | $1,069 | $1.16 | 20d | 1 | 1.03mi |
| 2213 E Adams St Springfield, IL | 3.0 | 1.0 | 1200 | $1,100 | $0.92 | 43d | 1 | 1.27mi |
| 3319 Ridgewood Ave Springfield, IL | 3.0 | 2.0 | 1248 | $1,094 | $0.88 | 43d | 1 | 1.33mi |
| 1413 N 5th St Springfield, IL | 3.0 | 1.0 | 1200 | $1,200 | $1.00 | 20d | 1 | 1.47mi |
| 3617 N Grand Ave E Springfield, IL | 3.0 | 2.0 | 1056 | $1,179 | $1.12 | 20d | 1 | 1.49mi |
Listing history 22 events
-
2026-06-19days on market $109,900 Active 21 DOM
-
2026-06-18days on market $109,900 Active 20 DOM
-
2026-06-17days on market $109,900 Active 19 DOM
-
2026-06-17price $109,900 Active 18 DOM
-
2026-06-16days on market $119,900 Active 18 DOM
-
2026-06-15days on market $119,900 Active 17 DOM
-
2026-06-14days on market $119,900 Active 15 DOM
-
2026-06-13days on market $119,900 Active 14 DOM
-
2026-06-10days on market $119,900 Active 12 DOM
-
2026-06-09days on market $119,900 Active 11 DOM
-
2026-06-08days on market $119,900 Active 10 DOM
-
2026-06-07pricedays on market $119,900 Active 9 DOM
-
2026-06-05days on market $129,900 Active 6 DOM
-
2026-06-03days on market $129,900 Active 5 DOM
-
2026-06-02days on market $129,900 Active 4 DOM
-
2026-06-01days on market $129,900 Active 3 DOM
-
2026-05-31days on market $129,900 Active 2 DOM
-
2026-05-29$129,900 Active
-
2025-04-01soldstatus $127,000 Closed 542-char remark
Show marketing remark (542 chars)
This beautifully updated 3-bed, 1-bath ranch is like new from top to bottom! Featuring a brand-new roof, siding, windows, soffit, fascia, gutters, interior and exterior doors, water heater, and insulation, this home is built for comfort and efficiency. Step inside to find new drywall, fresh paint, updated lighting, and stunning new flooring throughout. The kitchen and bathroom have been completely gutted and redesigned to be functional and efficient. Enjoy the peace of mind of a fully renovated home—just move in and make it yours!
-
2025-04-01soldstatus $127,000
Show marketing remark (542 chars)
This beautifully updated 3-bed, 1-bath ranch is like new from top to bottom! Featuring a brand-new roof, siding, windows, soffit, fascia, gutters, interior and exterior doors, water heater, and insulation, this home is built for comfort and efficiency. Step inside to find new drywall, fresh paint, updated lighting, and stunning new flooring throughout. The kitchen and bathroom have been completely gutted and redesigned to be functional and efficient. Enjoy the peace of mind of a fully renovated home—just move in and make it yours!
-
2025-03-03status Pending 542-char remark
Show marketing remark (542 chars)
This beautifully updated 3-bed, 1-bath ranch is like new from top to bottom! Featuring a brand-new roof, siding, windows, soffit, fascia, gutters, interior and exterior doors, water heater, and insulation, this home is built for comfort and efficiency. Step inside to find new drywall, fresh paint, updated lighting, and stunning new flooring throughout. The kitchen and bathroom have been completely gutted and redesigned to be functional and efficient. Enjoy the peace of mind of a fully renovated home—just move in and make it yours!
-
2025-02-13$129,500 Active 542-char remark
Show marketing remark (542 chars)
This beautifully updated 3-bed, 1-bath ranch is like new from top to bottom! Featuring a brand-new roof, siding, windows, soffit, fascia, gutters, interior and exterior doors, water heater, and insulation, this home is built for comfort and efficiency. Step inside to find new drywall, fresh paint, updated lighting, and stunning new flooring throughout. The kitchen and bathroom have been completely gutted and redesigned to be functional and efficient. Enjoy the peace of mind of a fully renovated home—just move in and make it yours!
ⓘ Source: listings_history table (triggers on properties + properties_extension) + one-shot
backfill from property_details.listing_events for pre-trigger history.
Tax reassessment forecast IL · Partial reset (capped growth)
- Current annual tax
- $2,388 · $199/mo
- Projected year-2 tax
- $2,441 · $203/mo
- Expected delta
- +$53/yr (+$4/mo · 2.2%)
ⓘ Screening estimate from a state-policy table — verify with the county assessor before closing.
Climate risk First Street
- Flood 3/10 Moderate FEMA zone X (unshaded) · 10% chance over 30 yrs
- Wildfire 1/10 Low
- Heat 4/10 Moderate 7 d/yr ≥104°F today · 20 d/yr by 30 yrs out
- Wind 2/10 Low 100% chance of damaging wind over 30 yrs
- Air quality 2/10 Low 1 unhealthy d/yr today · 1 by 30 yrs out
Nearby sold comps map
Loading sold comps map…
Walkable amenities ~0.75 mi
Loading nearby amenities…
Taxation est. · year 1
- Rental income
- $15,013
- − Mortgage interest
- −$6,156
- − Property taxes
- −$2,388
- − Insurance
- −$550
- − Repairs & maintenance
- −$1,201
- − Management
- −$1,201
- − Depreciation
- −$3,197
- Taxable income
- $321
- Est. tax owed @ 24.0%
- −$77
- After-tax cash flow
- $1,930/yr
For passive investors: Depreciation is non-cash, so a rental often shows a tax loss while cash-flowing — sheltering income. Rental losses are passive: they offset passive income freely, and up to $25,000/yr can offset ordinary (W-2) income if you actively participate and your MAGI is under $100k (phasing out to $0 by $150k); unused losses carry forward. On sale, claimed depreciation is recaptured at up to 25%, and gains may owe capital-gains tax (a 1031 exchange can defer both). Figures are a year-1 estimate at your 24.0% rate — not tax advice; consult a CPA.
Schools (NCES district)
- District
- Springfield SD 186
- NCES district ID
- 1737080
- Math proficiency
- 17% ▼ -7.00%
- Reading proficiency
- 22% ▼ -5.00%
- Median HH income
- $43,744
- Composite
- 16.89/100
- National rank
- #9142
- State rank
- #438 of 620 in IL
Livability — Grandview
- Score
- 77/100
- State rank
- #171
- US rank
- #3167
Category grades
Schools grade is shown separately in the Schools card above.
Census & demographics
- Census place
- Grandview, IL
- County
- Sangamon County · 115,414 people
- Metro
- Springfield, IL
- Population (ZIP)
- 31,033
- Household income
- $51,136
- Rent vs Own
- Severe rent burden
- 1230.0
Population outlook (Sangamon County) Hauer SSP2
- Today (2025)
- 198,317 people
- By 2030
- 196,127 · -1.1%
- By 2040
- 188,664 · -4.9%
- By 2050
- 179,624 · -9.4%
- By 2075
- 155,027 · -21.8%
- By 2100
- 122,588 · -38.2%
Race, ethnicity, and origin ACS 2023
- Neighborhood character
- Predominantly White (72%)
- Race & ethnicity
- White 72% Black 17% Two or more races 8% Hispanic / Latino 3%
- Common ancestry
- Romanian 2% Slovak 2% Serbian 1%
- Foreign-born
- 2% · Canada
- Languages at home
- 96% English-only · Spanish 1% French/Haitian/Cajun 1% Other Indo-European 1%
Political lean MEDSL · Sangamon
- 2024 margin
- Toss-up / Even · D 46.6% · R 51.6% · Other 1.8%
- 2008→2024 swing
- -9.3pp toward R · 2008: 4.4pp · 2024: -5.0pp
- All cycles
- 2024: R+5.0 2020: R+4.4 2016: R+9.4 2012: R+8.7 2008: D+4.4
Not yet ingested
- Civics
- —
Market trends
- HPI YoY
- ▼ -79.98%
- Current HPI
- 149.1926
- Rent YoY
- ▲ 4.95%
- Metro
- Springfield, IL
- State GDP YoY
- ▲ 1.59%
- F500 in state
- 60
Industry mix (Fortune 500 HQ in IL)
| Industry | F500 HQs | Revenue |
|---|---|---|
| Insurance | 4 | $201B |
|
||
| Consumer Goods | 4 | $87B |
|
||
| Industrial Machinery | 3 | $64B |
|
||
| Healthcare | 2 | $55B |
|
||
| Retail / Pharmacy | 1 | $148B |
|
||
| Agriculture / Food | 1 | $86B |
|
||
Price history
+0.3% since first listed5 events — show timeline
- 2026-05-29 Listed $129,900 RMLSA as Distributed by MLS Grid
- 2025-04-01 Sold (Public Records) $127,000 Public Records
- 2025-04-01 Sold (MLS) $127,000 RMLSA as Distributed by MLS Grid
- 2025-03-03 Pending — RMLSA as Distributed by MLS Grid
- 2025-02-13 Listed $129,500 RMLSA as Distributed by MLS Grid
Property tax history
+2.4%/yrLatest (2025): $2,388 · +1.6% YoY. Source: county tax records.
Cash-flow waterfall
monthlySold comps — $/sqft
last 12 mo · ≤1 miLoading sold comps…