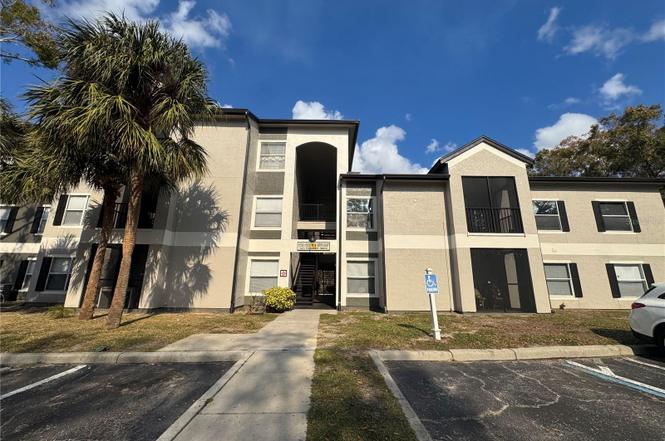
7605 Pissarro Dr #13108 · Doctor Phillips, FL
Flood risk No data
- FEMA flood zone
- —
- Chance of flooding over 30 yrs
- —
- Est. flood insurance / yr
- —
Fire risk No data
- Est. fire insurance / yr
- —
Heat risk No data
- Hot days now (above threshold)
- —
- Hot days in 30 yrs
- —
Wind risk No data
- Chance of severe wind over 30 yrs
- —
Air-quality risk No data
- Unhealthy air days now
- —
- Unhealthy air days in 30 yrs
- —
Risk factors via First Street. Map © Google.
Why this score? — see what drove the D grade
The composite is a weighted blend of 9 inputs, each scored 0–100. Each bar is that input's sub-score; the figure is the points it added to the 100-point composite (weight × sub-score).
- Cash flow +10.6/30.0
- ARV discount +7.5/15.0
- 1% rule +5.3/10.0
- Livability +4.4/5.0
- Schools +4.1/10.0
- DSCR +3.0/10.0
- Rent growth +2.9/5.0
- Condition / age +2.5/5.0
- Appreciation +0.0/10.0
$299,000
🖨 Deal sheet 📄 Offer letter ✓ Due diligence
Listing remarks MLS
Excellent opportunity for investor or first time home buyer! This 4 bedroom 2 bath ground floor condo features split bedrooms, stainless steel appliances, screened patio, inside laundry room, community pool and much more. Conveniently located near major roads, shopping, theme parks and restaurant row!
Key facts
- Gated community
- Screened patio
- Two swimming pools
Tags
Property features AI
Finance
- Other: Unit is unfurnished; Living area 1,323 (per appraiser); Accessible features: accessible approach with ramp, accessible bedroom, accessible closets, accessible common area; Pond and lake water view with water access
- Financial info: Total annual association fees $7,033.92; No lease restrictions
- HOA & community: Monthly HOA fee of $586.16; HOA covers pool, building maintenance, grounds maintenance, security, sewer, trash, and water; Association approval not required; Community amenities: clubhouse, fitness center, park, playground, pool, sidewalks, tennis courts, wheelchair access; Pets allowed
Exterior
- Parking: No truck/RV/motorcycle parking restriction (community rule)
- Security: Community security included in association
- Utilities: Private water source; Public sewer; Electricity available; Water available
- Home design: Condominium; Residential property; One story; North-facing
- Construction: Stucco construction; Shingle roof; Slab foundation; Built as Building/Unit 13 (unit number 13108 on first floor)
- Exterior features: Balcony; Sliding doors; Storage
Interior
- Kitchen: Dishwasher; Disposal; Microwave; Range hood
- Bedrooms: 4 bedrooms
- Flooring: Ceramic tile
- Bathrooms: 2 full bathrooms
- Heating & cooling: Central heating; Central air conditioning
- Interior features: Ceiling fans; Eat-in kitchen; Kitchen/family room combo; Living room/dining room combo; Split bedroom floor plan; Walk-in closets
- Laundry & utility: Laundry in kitchen; Washer; Dryer
Neighborhood map
What this means for you Summary
Snapshot
- This is a 4-bed/2.0-bath condo listed at $299k.
Deal economics
- At list price, monthly cash flow is $-150 ($-2k/yr) — negative.
- To cash-flow at today's rent, offer at most $273k (8.8% below list).
- Meets the 1% rule at list price ($3k rent vs $299k).
- Recommended offer: $263k (12.0% below list) — sets the bar for market timing.
- Cap rate 5.7% vs local median 2.5% in Doctor Phillips — top-decile yield for the area; either an underpriced asset or a hidden risk that comps aren't pricing in. Stress-test before assuming the spread holds.
Location & tenants
- Location reads 88/100 on livability (#7 in FL, #226 nationally) — a professional / high-income tenant draw. Strengths: crime A+, amenities A+, employment A+; Watch: schools D+, cost of living F.
- Orange (suburban): math 46% / reading 51% proficiency, ranked #43 of 73 in FL (top 59%) — families likely to look elsewhere, expect single-tenant / working-renter base with shorter leases.
- Market conditions: Rents rising (+1.7%/yr); 318 active listings in the ZIP; 11 comparable units currently listed for rent nearby; rentals leasing fast (median 5d on market — plan ~1-2 weeks tenant-placement turnaround); solid renter incomes; 8,053 units permitted in Orange County in 2024 (3,133 in 5+ unit buildings).
- This rent runs 38% of the median local income ($98k/yr) — at the standard rent-burdened threshold; future hikes will face affordability resistance.
Forward outlook
- Local home prices are declining (-3.0%/yr); year-one equity from $2k of loan paydown is wiped out by about $9k of value loss. Plan a longer hold.
- Orange County population projected at +52% by 2050 — long-run rental-demand tailwind backs the buy-and-hold thesis.
Negotiation context
- It's been on market 160 days — a 12% lower offer ($263k) is reasonable based on typical stale-listing flexibility.
- 3 sale attempts since 18y ago with the ask held roughly flat each time — persistent listings suggest the price (not the market) is what's stuck; bring a comps-based counter.
- Current owner paid $136k; list at $299k implies a 119% gain — meaningful room to come down on a strong offer.
Questions for the listing agent
- What do current leases actually rent for vs. the listed asking? Can we see a recent rent roll and the last 12 months of T-12 income?
- It's been on market 160 days. Have you received any prior offers? Is the seller open to a 12% concession, seller financing, or rate buy-down credit?
- What does the HOA fee cover, when was the last increase, and are there any pending special assessments or reserve-fund shortfalls?
- Any open or pending special assessments — roof, HVAC, plumbing, elevator, façade? What's the per-unit balance and payoff schedule, and is the seller paying it off at close or rolling it to the buyer?
- Why hasn't it sold? Are there any deal-killer items the seller is aware of (foundation, flood, title, zoning, code violations)?
- Is there a deadline driving the sale (1031 exchange, divorce, estate, relocation)? That informs how much negotiation room exists.
- Schools are D-rated, which usually means shorter tenancies and higher turnover. Who's the typical renter profile here, and what's been the actual vacancy rate?
- The area grade is low — what's the realistic commute time and amenity access for the typical tenant pool here? Any planned neighborhood developments (good or bad) we should know about?
- What's the average days-on-market for RENTAL listings here right now (not sales)? A rising rental-DOM trend means longer vacancies and softer asking-rent achievability than the comps imply.
- What's the recent tenant-quality profile in this submarket — average credit score on applications, eviction rate, late-payment / NSF rate, and stable-employment percentage? A property-management company in the area should have these aggregated.
- How much new apartment / multifamily construction is in the pipeline within 1–3 miles? Heavy new supply (>2% of stock underway) typically softens rents 12–24 months out; light construction supports rent growth.
Investment metrics
- 1% rule
- 1.03% ✓
- Cap rate
- 5.69%
- Cash-on-cash
- -2.15%
- DSCR
- 0.90
- GRM
- 8.1
CMA / ARV
No comps found within radius.
Projected returns pro-forma
-3.0% appreciation · 1.72% rent growth · sell at horizon
- IRR
- -21.5%
- Equity multiple
- 0.26×
- Total profit
- $-61,542
- Equity at exit
- $44,582
- IRR
- -19.1%
- Equity multiple
- 0.04×
- Total profit
- $-80,054
- Equity at exit
- $25,852
Cash invested: $83,720 (down + closing). Projections, not guarantees.
Landlord ↔ Tenant lean methodology
- Overall (STATE)
- 87 Strongly Landlord-Friendly
- State Florida
- 87 Strongly Landlord-Friendly · R+3
- County
- — inherits STATE
- City
- — inherits STATE
ZIP-level market 32819
- Rents YoY
- 1.7%
- Active inventory
- 318
- Price-to-rent
- 8.1×
Monthly cashflow live
- Estimated rent
- $3,078 high interval (Pro) →
- Mortgage (P&I)
- −$1,568
- Tax from tax record
- −$303 /mo · $3,638/yr
- Insurance
- −$125
- HOA
- −$586
- Vacancy / Maint / Mgmt
- −$646
- Net cashflow
- $-150
Break-even live
UW: 25.0% down · 7.5% · 30yr · 1.5% tax · 5.0% vac · 8.0% maint · 8.0% mgmt
Financing live
Cash to close
- Down payment
- $74,750
- Closing costs
- $8,970
- Reserves months
- —
- Total cash needed
- —
Loan-product check · same deal, 3 products live
Conventional
25% down · 7.5% · 30yr
- Down + closing
- —
- Monthly P&I
- —
- Monthly cashflow
- —
- DSCR
- —
- Eligible?
- —
Personal DTI + credit; lowest rate.
DSCR
20% down · 8.5% · 30yr
- Down + closing
- —
- Monthly P&I
- —
- Monthly cashflow
- —
- DSCR
- —
- Eligible?
- —
No personal income docs; deal must DSCR.
Hard money
10% down · 12.0% · 12mo
- Down + closing
- —
- Monthly P&I
- —
- Monthly cashflow
- —
- DSCR
- —
- Eligible?
- —
Short-term bridge; refi at stabilization.
Rent comps 11 comps
| Address | Beds | Baths | Sqft | Rent | $/sqft | DOM | Units | Dist |
|---|---|---|---|---|---|---|---|---|
| 7605 Pissarro Dr #13304 Orlando, FL | 3.0 | 2.0 | 1193 | $1,795 | $1.50 | 16d | 1 | 0.03mi |
| 7606 Pissarro Dr #14106 Orlando, FL | 3.0 | 2.0 | 1193 | $2,800 | $2.35 | 22d | 1 | 0.03mi |
| 7524 Seurat St Orlando, FL | 4.0 | 2.0 | 1500 | $3,895 | $2.60 | 4d | 1 | 0.05mi |
| 7524 Seurat St #12102 Orlando, FL | 4.0 | 2.0 | 1323 | $3,500 | $2.65 | 10d | 1 | 0.05mi |
| 6265 Sand Lake Vista Dr Orlando, FL | 1.0–3.0 | 1.0–2.0 | 1183 | $3,253 | $2.75 | 2d | 27 | 0.15mi |
| 7361 Alpine Butterfly Ln Orlando, FL | 3.0 | 2.5 | 1638 | $2,850 | $1.74 | 7d | 1 | 0.39mi |
| 6500 Sand Lake Sound Rd Orlando, FL | 3.0 | 1.0–2.0 | 989 | $3,267 | $3.30 | 2d | 22 | 0.52mi |
| 8000 Essex Point Cir Orlando, FL | 1.0–3.0 | 1.0–2.0 | 1033 | $2,498 | $2.42 | 3d | 22 | 1.27mi |
| 7119 Sand Lake Reserve Dr Orlando, FL | 1.0–3.0 | 1.0–2.0 | 1041 | $2,810 | $2.70 | 2d | 17 | 1.38mi |
| 8048 Sandpoint Blvd Orlando, FL | 3.0 | 2.5 | 1507 | $2,800 | $1.86 | 3d | 1 | 1.42mi |
| 8048 Sandpoint Blvd Orlando, FL | 3.0 | 2.5 | 1507 | $2,800 | $1.86 | 20d | 1 | 1.42mi |
HOA detail condo
- Monthly dues
- $586 · $7,032/yr
- Likely covers
- pool
- Assessments
- None detected in remarks — confirm with the listing agent.
Listing history 22 events
-
2026-06-18days on market $299,000 Active 160 DOM
-
2026-06-17days on market $299,000 Active 159 DOM
-
2026-06-16days on market $299,000 Active 158 DOM
-
2026-06-15days on market $299,000 Active 157 DOM
-
2026-06-13days on market $299,000 Active 155 DOM
-
2026-06-13days on market $299,000 Active 154 DOM
-
2026-06-09days on market $299,000 Active 151 DOM
-
2026-06-08days on market $299,000 Active 150 DOM
-
2026-06-07days on market $299,000 Active 149 DOM
-
2026-06-04days on market $299,000 Active 146 DOM
-
2026-06-03days on market $299,000 Active 145 DOM
-
2026-06-02days on market $299,000 Active 144 DOM
-
2026-06-02days on market $299,000 Active 143 DOM
-
2026-05-31days on market $299,000 Active 142 DOM
-
2026-01-09$299,000 Active
-
2016-03-03soldstatus $136,500
-
2010-08-31soldstatus $82,000 302-char remark
Show marketing remark (302 chars)
Excellent opportunity for investor or first time home buyer! This 4 bedroom 2 bath ground floor condo features split bedrooms, stainless steel appliances, screened patio, inside laundry room, community pool and much more. Conveniently located near major roads, shopping, theme parks and restaurant row!
-
2010-07-20$76,900 302-char remark
Show marketing remark (302 chars)
Excellent opportunity for investor or first time home buyer! This 4 bedroom 2 bath ground floor condo features split bedrooms, stainless steel appliances, screened patio, inside laundry room, community pool and much more. Conveniently located near major roads, shopping, theme parks and restaurant row!
-
2010-02-02historical
-
2008-01-25$79,900
-
2005-05-06soldstatus $239,700
-
2005-05-06soldstatus $239,700
ⓘ Source: listings_history table (triggers on properties + properties_extension) + one-shot
backfill from property_details.listing_events for pre-trigger history.
Tax reassessment forecast FL · Resets to sale price
- Current annual tax
- $3,638 · $303/mo
- Projected year-2 tax
- $3,638 · $303/mo
- Expected delta
- $0/yr ($0/mo · 0.0%)
ⓘ Screening estimate from a state-policy table — verify with the county assessor before closing.
Nearby sold comps map
Loading sold comps map…
Walkable amenities ~0.75 mi
Loading nearby amenities…
Taxation est. · year 1
- Rental income
- $36,942
- − Mortgage interest
- −$16,749
- − Property taxes
- −$3,638
- − Insurance
- −$1,495
- − Repairs & maintenance
- −$2,955
- − Management
- −$2,955
- − HOA
- −$7,032
- − Depreciation
- −$8,698
- Taxable loss
- −$6,581
- Est. tax savings @ 24.0%
- +$1,579
- After-tax cash flow
- $-218/yr
For passive investors: Depreciation is non-cash, so a rental often shows a tax loss while cash-flowing — sheltering income. Rental losses are passive: they offset passive income freely, and up to $25,000/yr can offset ordinary (W-2) income if you actively participate and your MAGI is under $100k (phasing out to $0 by $150k); unused losses carry forward. On sale, claimed depreciation is recaptured at up to 25%, and gains may owe capital-gains tax (a 1031 exchange can defer both). Figures are a year-1 estimate at your 24.0% rate — not tax advice; consult a CPA.
Schools (NCES district)
- District
- Orange
- NCES district ID
- 1201440
- Math proficiency
- 46% ▼ -9.00%
- Reading proficiency
- 51% ▼ -2.00%
- Median HH income
- $49,350
- Composite
- 41.47/100
- National rank
- #3461
- State rank
- #43 of 73 in FL
Livability — Doctor Phillips
- Score
- 88/100
- State rank
- #7
- US rank
- #226
Category grades
Schools grade is shown separately in the Schools card above.
Census & demographics
- County
- Orange County · 1,471,359 people
- City population
- 30,213
- Metro
- Orlando-Kissimmee-Sanford, FL
- Population (ZIP)
- 30,213
- Household income
- $98,109
- Rent vs Own
- Severe rent burden
- 930.0
Population outlook (Orange County) Hauer SSP2
- Today (2025)
- 1,618,226 people
- By 2030
- 1,787,404 · +10.5%
- By 2040
- 2,125,621 · +31.4%
- By 2050
- 2,454,016 · +51.6%
- By 2075
- 3,173,711 · +96.1%
- By 2100
- 3,607,781 · +122.9%
Race, ethnicity, and origin ACS 2023
- Neighborhood character
- Diverse neighborhood (Simpson 0.68)
- Race & ethnicity
- White 51% Hispanic / Latino 20% Two or more races 17% Black 12% Asian 8%
- Hispanic origin (detail)
- Mexican 2% Puerto Rican 6% Cuban 4% Dominican 2%
- Common ancestry
- Estonian 4% Romanian 3% Lithuanian 2%
- Foreign-born
- 27% · Canada, China, Jamaica
- Languages at home
- 65% English-only · Spanish 17% Other Indo-European 9% French/Haitian/Cajun 2%
Political lean MEDSL · Orange
- 2024 margin
- D (+13.6) · D 56.1% · R 42.5% · Other 1.3%
- 2008→2024 swing
- -5.0pp toward R · 2008: 18.6pp · 2024: 13.6pp
- All cycles
- 2024: D+13.6 2020: D+23.1 2016: D+24.6 2012: D+18.2 2008: D+18.6
Not yet ingested
- Civics
- —
Market trends
- HPI YoY
- ▼ -265.00%
- Current HPI
- 285.9384
- Rent YoY
- ▲ 1.72%
- Metro
- Orlando-Kissimmee-Sanford, FL
- State GDP YoY
- ▲ 3.28%
- F500 in state
- 36
Industry mix (Fortune 500 HQ in FL)
| Industry | F500 HQs | Revenue |
|---|---|---|
| Industrial Technology | 2 | $29B |
|
||
| Insurance | 2 | $17B |
|
||
| Retail | 1 | $60B |
|
||
| Technology Distribution | 1 | $58B |
|
||
| Homebuilding | 1 | $35B |
|
||
| Technology Manufacturing | 1 | $35B |
|
||
Price history
+24.7% since first listed8 events — show timeline
- 2026-01-09 Listed $299,000 Stellar MLS as Distributed by MLS Grid
- 2016-03-03 Sold (Public Records) $136,500 Public Records
- 2010-08-31 Sold (MLS) $82,000 Stellar MLS as Distributed by MLS Grid
- 2010-07-20 Listed $76,900 Stellar MLS as Distributed by MLS Grid
- 2010-02-02 Listing Removed — Stellar MLS as Distributed by MLS Grid
- 2008-01-25 Listed $79,900 Stellar MLS as Distributed by MLS Grid
- 2005-05-06 Sold (Public Records) $239,700 Public Records
- 2005-05-06 Sold (Public Records) $239,700 Public Records
Property tax history
+16.7%/yrLatest (2025): $3,638 · +6.3% YoY. Source: county tax records.
Cash-flow waterfall
monthlySold comps — $/sqft
last 12 mo · ≤1 miLoading sold comps…